
Discuss pharmacokinetics & pharmacodynamics? Discuss pharmacokinetics and dynamics of inhalational anesthetic agents?
pharmacokinetics ADME absorption distribution metabolism elimination diagram
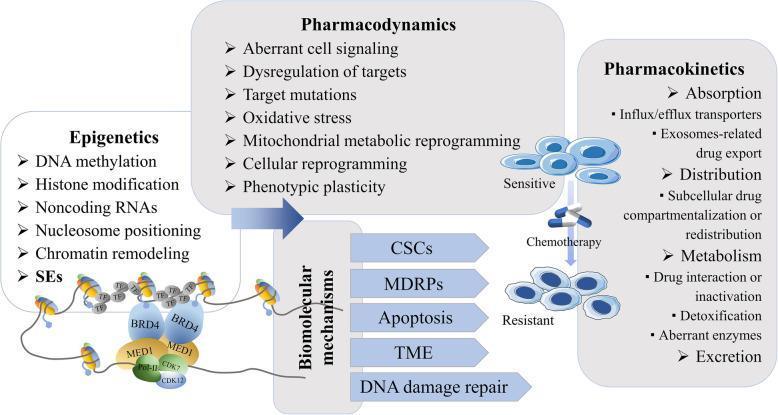
A pathophysiology diagram illustrating the multifactorial mechanisms contributing to tumor chemoresistance. The visual outlines three primary domains: Pharmacokinetics, Pharmacodynamics, and Epigenetics. The Pharmacokinetics section details drug absorption (influx/efflux transporters, exosome-related export), distribution (subcellular compartmentalization), metabolism (inactivation, detoxification, aberrant enzymes), and excretion. The Pharmacodynamics section lists aberrant cell signaling, target mutations, oxidative stress, and phenotypic plasticity. The Epigenetics domain highlights DNA methylation, histone modification, and super-enhancers (SEs), including a molecular illustration of the SE complex involving BRD4, MED1, RNA Pol-II, and CDKs. Centrally, a dynamic process shows 'Sensitive' cancer cells transitioning to a 'Resistant' phenotype following chemotherapy exposure. This transition is linked to key biomolecular mechanisms: Cancer Stem Cells (CSCs), Multidrug Resistance Proteins (MDRPs), dysregulated apoptosis, the Tumor Microenvironment (TME), and enhanced DNA damage repair. This diagram serves as an educational summary of how cellular, genetic, and pharmacological factors converge to facilitate cancer drug evasion.
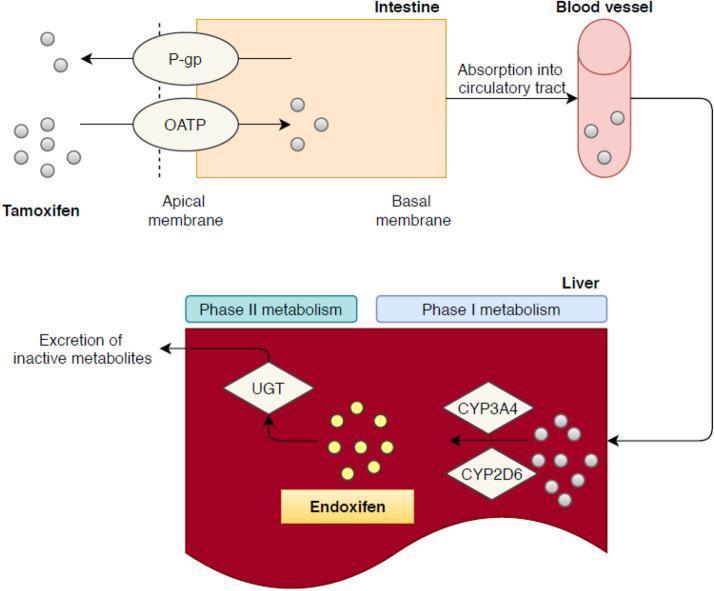
A pathophysiology diagram illustrating the pharmacokinetics and metabolic pathway of Tamoxifen. The top portion depicts intestinal absorption where Tamoxifen molecules cross the apical membrane via the influx transporter OATP (organic anion transporting polypeptide) and are simultaneously subject to efflux by P-gp (P-glycoprotein). The drug then crosses the basal membrane into a blood vessel for systemic absorption into the circulatory tract. The lower portion focuses on hepatic metabolism within the liver. Phase I metabolism is shown converting Tamoxifen into its active metabolite, Endoxifen, facilitated by the cytochrome P450 enzymes CYP3A4 and CYP2D6. Subsequently, Phase II metabolism involves the enzyme UGT (UDP-glucuronosyltransferase), which glucuronidates the metabolites for the final excretion of inactive metabolites. This diagram serves as an educational tool for understanding drug biotransformation, enzymatic activation, and the role of membrane transporters in pharmacology.
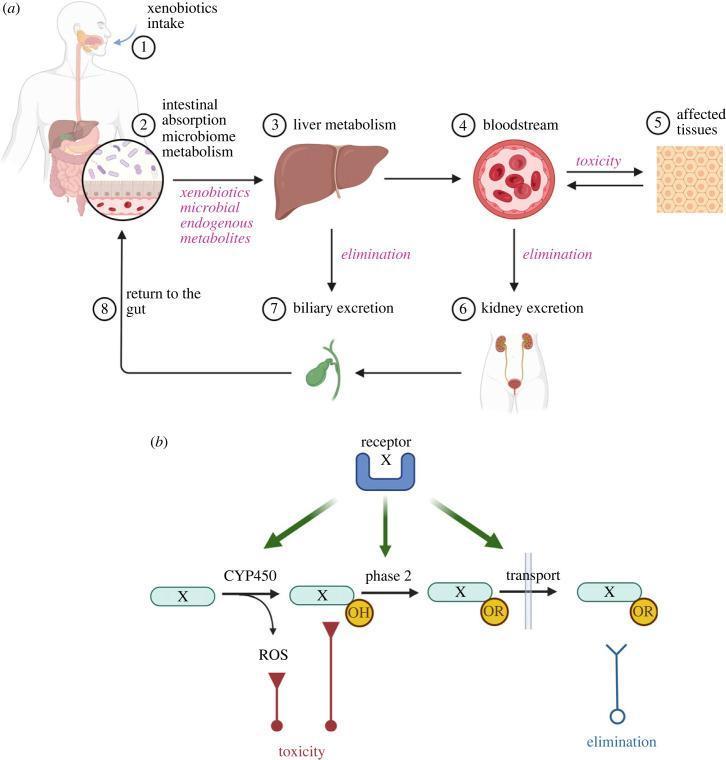
Educational diagram illustrating the toxicokinetics and metabolic pathways of xenobiotics in the human body. Panel (a) presents a systemic flowchart starting from (1) xenobiotics intake through (2) intestinal absorption and microbiome metabolism. The pathway continues to (3) liver metabolism and distribution into the (4) bloodstream, potentially causing (5) toxicity in affected tissues. Elimination routes include (6) kidney excretion via urine and (7) biliary excretion, which may result in a (8) return to the gut. Panel (b) details the molecular biotransformation phases. Phase 1 involves Cytochrome P450 (CYP450) enzymes adding a reactive oxygen/hydroxyl group (-OH) to the xenobiotic (X), which may generate reactive oxygen species (ROS) and cellular toxicity. Phase 2 enzymes conjugate the metabolite with a hydrophilic group (-OR) to enhance water solubility. Finally, Phase 3 involves transport mechanisms across plasma membranes leading to systemic elimination. The diagram highlights the balance between detoxification and the potential for metabolite-induced toxicity.
inhalational anesthetic FA FI ratio blood gas solubility MAC minimum alveolar concentration
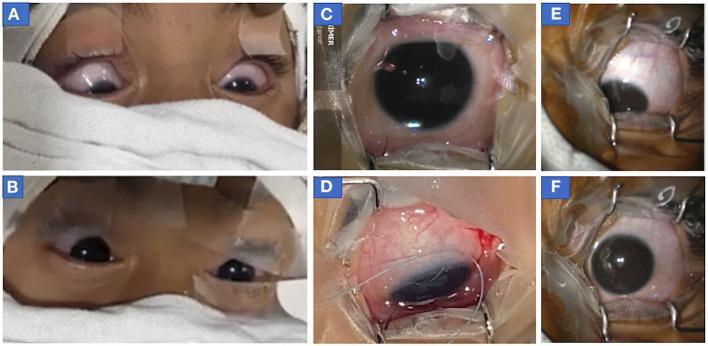
This composite of clinical photographs illustrates eccentric eye positioning, specifically downdrift, occurring under general anesthesia in pediatric patients during ophthalmic surgery. Panels A and B show a bilateral symmetric downward gaze (downdrift) at a higher minimum alveolar concentration (MAC 1.4) compared to the centralized position achieved after reducing anesthetic depth (MAC 1.2). Panels C and D provide a close-up intraoperative view of a single eye; C shows the primary position, while D demonstrates downdrift with adduction (inward and downward) following anesthetic deepening. Panel D also displays surgical features including a lid speculum, conjunctival incision, and traction sutures. Panels E and F repeat this phenomenon in a third case, showing eccentric downgaze and slight adduction at high MAC, with return to center at lower MAC. These images serve as educational material for anesthesiology and ophthalmology, highlighting the clinical sign of anesthesia-induced eccentric eye positioning (AEEP) and its correlation with the depth of anesthesia (DOA) during surgical procedures.
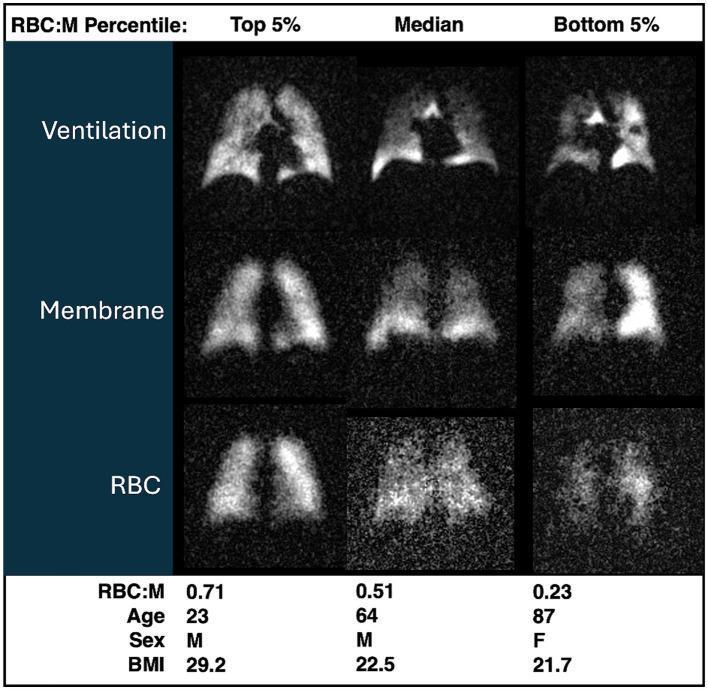
This diagnostic comparison chart displays Hyperpolarized Xenon-129 MRI (XeMRI) lung scans from three subjects, illustrating pulmonary gas exchange across different RBC to membrane (RBC:M) ratios. The 3x3 grid organizes grayscale axial thoracic images by physiological components—Ventilation, Membrane, and RBC signals—across three cohorts: Top 5th percentile (RBC:M 0.71), Median (RBC:M 0.51), and Bottom 5th percentile (RBC:M 0.23). The top row depicts gas distribution (Ventilation), the middle row shows the Xenon signal dissolved in the alveolar-capillary tissue (Membrane), and the bottom row highlights the Xenon signal transferred into red blood cells (RBC). Key visual trends include a marked decrease in RBC signal intensity and clarity as the RBC:M ratio and age progress (from 23 to 87 years), while the Membrane signal remains relatively preserved. This comparison serves as a clinical visualization of age-related declines in gas exchange efficiency, specifically tracking the impairment of gas transfer into the pulmonary vasculature.
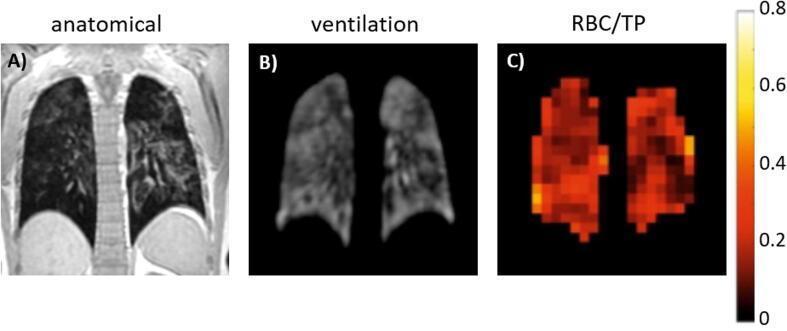
This set of three thoracic magnetic resonance images (MRI) demonstrates a comparison between structural and functional imaging in a patient with acute COVID-19. Panel A shows a 1H anatomical Spoiled Gradient Recalled (SPGR) image in the coronal plane, providing high-resolution structural detail of the lungs, trachea, and diaphragm. Panel B presents a 129Xe ventilation image, showing the regional distribution of inhaled hyperpolarized xenon gas within the alveolar space; despite the patient's illness, ventilation appears relatively preserved. Panel C features a 129Xe RBC/TP (Red Blood Cell to Tissue/Plasma) map acquired using the IDEAL sequence. This functional map represents the gas exchange efficiency by measuring the ratio of xenon dissolved in red blood cells versus that in the lung parenchyma and blood plasma. The map uses a pseudocolor scale where darker red indicates a lower ratio and yellow indicates a higher ratio (scale 0 to 0.8). In this clinical case, the RBC/TP ratio is significantly reduced (0.188) compared to healthy norms (0.47), visually indicating impaired pulmonary gas exchange across the alveolar-capillary barrier despite normal ventilation.
Pharmacokinetics & Pharmacodynamics
PART 1: GENERAL PHARMACOKINETICS (PK)
A. Routes of Drug Administration
| Route | Key Features |
|---|---|
| Oral (PO) | Most convenient; subject to first-pass effect; slow onset |
| Intravenous (IV) | 100% bioavailability; fastest onset; no absorption step |
| Intramuscular (IM) | Bypasses first-pass; rate dependent on blood flow |
| Sublingual/Buccal | Bypasses first-pass via direct portal venous bypass |
| Transdermal | Slow, sustained delivery; avoids GI and first-pass |
| Inhalation | Rapid; large surface area; avoids first-pass |
B. Absorption
- Lipid solubility: Lipid-soluble, non-ionized drugs cross membranes more readily.
- Ionization (Henderson-Hasselbalch): Only the unionized fraction can cross membranes. Weak acids are better absorbed in the acidic gastric environment; weak bases in the alkaline intestine.
- Molecular size: Smaller molecules cross membranes more readily.
- First-pass effect: Oral drugs absorbed from the GI tract pass through the portal circulation and liver before entering systemic circulation, where significant metabolism may reduce bioavailability.
- P-glycoprotein efflux pump: Located at intestinal epithelium - pumps drugs out of enterocytes, reducing absorption and contributing to multidrug resistance.
- IV administration = 100% bioavailability.
- Calculated as: F = AUC(oral) / AUC(IV) × 100%
C. Distribution
- Plasma protein binding: Drugs bound to albumin (acidic drugs) or alpha-1-acid glycoprotein (basic drugs) are pharmacologically inactive and cannot be distributed to tissues. Only free (unbound) drug is active.
- Volume of Distribution (Vd):
- Vd = Amount of drug in body / Plasma drug concentration
- Small Vd: drug stays in blood (high protein binding, hydrophilic)
- Large Vd: drug distributes extensively to tissues (lipophilic)
- Tissue compartments: Highly perfused organs (brain, heart, liver, kidneys) equilibrate rapidly (vessel-rich group). Muscle, fat, and bone equilibrate more slowly.
- Blood-brain barrier (BBB): Only lipid-soluble, non-ionized, low-molecular-weight drugs penetrate readily.
- Redistribution: After initial distribution to highly perfused tissues, drug redistributes to less-perfused tissues (e.g., thiopental - rapid CNS effect then redistribution to muscle/fat causes rapid awakening).
D. Metabolism (Biotransformation)
Phase I Reactions (Functionalization)
- Introduce or expose a polar functional group (-OH, -NH₂, -SH) via oxidation, reduction, or hydrolysis.
- Cytochrome P450 (CYP) system: Primary Phase I system. Located in hepatic endoplasmic reticulum.
- Key isoforms: CYP3A4/5 (most abundant; metabolizes ~50% of drugs), CYP2D6, CYP2C9, CYP2C19, CYP1A2
- CYP3A4 also found in intestinal mucosa - contributes to first-pass metabolism of drugs like cyclosporine, midazolam
- Genetic polymorphism: CYP2D6 - "poor metabolizers" lack the enzyme (codeine gives no benefit as it can't be activated to morphine); "ultrarapid metabolizers" convert codeine too fast, risking opioid toxicity in breastfed infants
- May increase, decrease, or have no effect on pharmacologic activity.
- Prodrugs are activated by Phase I (e.g., codeine → morphine; clopidogrel → active thienopyridine).
Phase II Reactions (Conjugation/Synthetic)
- Conjugation with glucuronide, sulfate, acetate, glutathione, or methyl groups.
- Products are generally inactive (exceptions: morphine-6-glucuronide is active) and water-soluble for renal/biliary excretion.
- Occur simultaneously with or after Phase I.
CYP Inducers & Inhibitors
- Inducers (increase CYP expression → faster drug metabolism → reduced effect): rifampin, carbamazepine, phenytoin, barbiturates, St. John's Wort
- Inhibitors (reduce CYP activity → reduced metabolism → increased drug levels/toxicity): ketoconazole, erythromycin, grapefruit juice, fluoxetine
E. Elimination & Pharmacokinetic Parameters
Renal Excretion
- Glomerular filtration: Free (unbound) drug filtered.
- Active tubular secretion: Organic acid/base transporters actively secrete drugs into tubular lumen.
- Passive tubular reabsorption: Lipid-soluble/unionized drugs reabsorbed back into blood. Urine pH manipulation alters reabsorption (acidifying urine traps basic drugs; alkalinizing traps acidic drugs - used in overdose management).
Half-life (t½)
- Time for plasma drug concentration to decrease by 50%.
- t½ = 0.693 × Vd / Clearance
- ~3.3 half-lives to reach 90% of steady state; ~5 half-lives to reach full steady state.
- Clinically: drugs are typically considered eliminated after 5 half-lives.
Clearance (CL)
- Volume of plasma cleared of drug per unit time (mL/min).
- CL = Dose / AUC = Vd × Ke (elimination rate constant)
- Hepatic clearance can be flow-limited (high-extraction drugs like lidocaine) or capacity-limited (low-extraction drugs like warfarin).
Steady State (C_ss)
- Achieved when rate of drug administration equals rate of elimination.
- Reached in ~4-5 half-lives regardless of dosing interval or dose size.
- Dosing frequency affects peak-trough fluctuation but NOT the C_ss level; dose size affects C_ss level.
Zero-order vs First-order Kinetics
- First-order: Rate of elimination proportional to plasma concentration (constant fraction eliminated per unit time) - applies to most drugs.
- Zero-order: Rate of elimination is constant regardless of concentration (constant amount eliminated per unit time) - occurs at saturating concentrations (e.g., alcohol, phenytoin, aspirin at high doses); these drugs have no true half-life and can accumulate unpredictably.
PART 2: GENERAL PHARMACODYNAMICS (PD)
A. Drug-Receptor Interaction
Types of Drug-Receptor Interaction
| Term | Definition |
|---|---|
| Agonist | Binds receptor and activates it (intrinsic activity = 1) |
| Partial Agonist | Binds and activates, but with submaximal intrinsic activity (<1) |
| Antagonist | Binds receptor but does NOT activate it (intrinsic activity = 0) |
| Inverse Agonist | Binds receptor and produces opposite effect to agonist |
Competitive vs Non-competitive Antagonism
- Competitive (reversible): Antagonist competes with agonist for same receptor site; overcome by increasing agonist dose. Shifts dose-response curve to the right (increased EC50, same Emax).
- Non-competitive (irreversible/allosteric): Cannot be overcome by increasing agonist. Reduces Emax.
B. Dose-Response Relationships
- Potency (EC50): Concentration producing 50% of maximal effect. A drug with lower EC50 is more potent.
- Efficacy (Emax): The maximum effect a drug can produce. A drug can be highly potent but have low efficacy.
- Therapeutic index (TI): TI = TD50 / ED50 (ratio of toxic dose to effective dose). Drugs with narrow TI require careful monitoring (e.g., digoxin, lithium, aminoglycosides).
C. Signal Transduction (Receptor Types)
- Ligand-gated ion channels (Type I): Fast onset (milliseconds). Example: nicotinic acetylcholine receptor (Na⁺/K⁺ flux), GABA-A receptor (Cl⁻ flux), NMDA receptor.
- G-protein coupled receptors (GPCRs, Type II): Seconds to minutes. Examples:
- Gs → adenylyl cyclase → ↑cAMP (β-adrenergic, glucagon)
- Gi → ↓cAMP (α2-adrenergic, opioid)
- Gq → phospholipase C → IP3/DAG (α1-adrenergic, muscarinic M1/M3)
- Enzyme-linked receptors (Type III): Hours. Examples: insulin receptor (tyrosine kinase), cytokine receptors.
- Intracellular/nuclear receptors (Type IV): Hours to days (gene transcription). Examples: steroid hormones (glucocorticoids, sex hormones), thyroid hormone.
D. Drug Tolerance & Tachyphylaxis
- Tolerance: Reduced drug effect with repeated dosing (may involve receptor downregulation, enzyme induction, or physiologic adaptation).
- Tachyphylaxis: Rapid tolerance occurring with very short repeated exposures (e.g., tyramine, ephedrine - due to catecholamine depletion).
- Physical dependence: Adaptive state manifest as a withdrawal syndrome upon abrupt discontinuation.
PART 3: PHARMACOKINETICS OF INHALATIONAL ANESTHETIC AGENTS
A. The FA/FI Concept
- FA = alveolar concentration (also called the end-tidal concentration, which reflects brain partial pressure at equilibrium)
- FI = inspired concentration being delivered
- A rapid rise in FA/FI = faster induction of anesthesia.
B. Factors Increasing FA/FI (Speed of Induction)
1. Inspired Concentration / Fresh Gas Flow
- Higher FI drives FA/FI up faster.
- Concentration effect: With highly concentrated agents (especially N₂O at high inspired concentrations), uptake into blood of large volumes of gas concentrates remaining gas in alveoli, causing FA to rise faster than expected.
- Second gas effect: When N₂O is co-administered with a potent volatile agent, the rapid uptake of N₂O concentrates the volatile agent in the alveolus, accelerating its rate of rise.
2. Alveolar Ventilation
- Increasing minute ventilation (respiratory rate or tidal volume) delivers more fresh anesthetic to alveoli, increasing FA/FI.
- This is especially important for agents with higher blood solubility (e.g., older agents like halothane), where increased ventilation can partially compensate for slow uptake.
3. Functional Residual Capacity (FRC)
- Large FRC = larger "reservoir" of gas that must be "washed in" with anesthetic, slowing rise in FA/FI.
- N₂O given as 75% of inspired gas must fill the FRC before FA begins to rise efficiently.
C. Factors Decreasing FA/FI (Blood & Tissue Uptake)
V̇B = λb/g × Q × (PA - Pv) / PB
- λb/g = blood:gas partition coefficient
- Q = cardiac output
- PA = alveolar partial pressure
- Pv = mixed venous partial pressure
- PB = barometric pressure
1. Blood:Gas Partition Coefficient (Solubility)
| Agent | Blood:Gas Coefficient | Speed of Induction/Emergence |
|---|---|---|
| Desflurane | 0.42 | Very fast |
| Nitrous oxide (N₂O) | 0.47 | Very fast |
| Sevoflurane | 0.65 | Fast |
| Isoflurane | 1.4 | Moderate |
| Halothane | 2.5 | Slow |
| Ether (historical) | 12 | Very slow |
- A low blood:gas coefficient means the drug is poorly soluble in blood → blood quickly becomes saturated → less uptake from alveoli → FA rises quickly → faster induction.
- A high coefficient means blood acts as a large reservoir, continuously taking up drug → FA rises slowly → slow induction.
- By the same logic, emergence is faster with low-solubility agents (desflurane, sevoflurane) because elimination from blood to alveoli is rapid.
2. Cardiac Output (Q)
- High cardiac output (e.g., anxiety, hyperthyroidism): More blood circulates through the lungs per minute, picking up more anesthetic from alveoli → FA/FI rises MORE slowly (paradoxically, high CO slows induction for soluble agents).
- Low cardiac output (e.g., shock, heart failure): Less uptake → FA/FI rises faster → risk of overdose (especially important clinically in critically ill patients).
- For low-solubility agents, cardiac output has little influence because blood becomes saturated quickly regardless.
3. Alveolar-Venous Partial Pressure Difference (PA - Pv)
- At the start of induction, Pv = 0 (no anesthetic in venous blood) → maximum uptake gradient.
- As induction proceeds, tissues absorb anesthetic → Pv rises → gradient narrows → uptake slows → FA/FI rises.
D. Distribution (Tissue Uptake)
| Compartment | Examples | Perfusion | Equilibration Time |
|---|---|---|---|
| Vessel-rich group (VRG) | Brain, heart, liver, kidneys | Very high | Minutes |
| Muscle group | Skeletal muscle | Moderate | ~30 minutes |
| Fat group | Adipose tissue | Low | Hours |
| Vessel-poor group | Bone, tendons, cartilage | Very low | Very slow |
- Brain equilibrates rapidly with arterial blood → anesthetic effect begins quickly once arterial levels rise.
- Fat acts as a large sink for lipid-soluble agents; with prolonged anesthesia, fat continues to accumulate drug, prolonging emergence.
- The tissue:blood partition coefficient (or tissue solubility) determines how much drug each tissue can hold at equilibrium.
E. Elimination (Emergence)
- Inspired concentration reduced to zero → FA falls.
- The rate of fall of FA (and thus brain concentration) depends on:
- Blood:gas partition coefficient (low solubility = fast emergence)
- Duration of anesthesia: With prolonged procedures, fat becomes saturated; continued release from fat into blood maintains brain levels → slower emergence.
- Alveolar ventilation: Higher ventilation speeds washout, especially for soluble agents.
- Cardiac output: Has less influence on emergence than induction.
Diffusion Hypoxia (Fink Effect) with N₂O
- On discontinuing N₂O, large volumes of N₂O rapidly exit blood into alveoli, diluting alveolar O₂ and CO₂.
- Transient decrease in alveolar PO₂ → hypoxia.
- Prevented by giving 100% O₂ for at least 5-10 minutes at the end of N₂O anesthesia.
F. Metabolism
| Agent | Hepatic Metabolism | Key Metabolite/Concern |
|---|---|---|
| Desflurane | <0.02% | Negligible |
| Isoflurane | 0.2% | Negligible hepatotoxicity |
| Sevoflurane | 3-5% | Fluoride ions; Compound A (from CO₂ absorbent) |
| N₂O | <0.004% | Oxidizes vitamin B12 (methionine synthase inhibition - prolonged use concern) |
| Halothane | 20% | Trifluoroacetyl halide → immune hepatitis ("halothane hepatitis") |
| Enflurane | 8% | Fluoride ions → renal concern at high doses |
- Compound A: Produced when sevoflurane reacts with desiccated CO₂ absorbent (especially Baralyme > soda lime) - nephrotoxic in rodents, clinical significance in humans remains debated.
- Carbon monoxide: Desflurane > isoflurane > sevoflurane degrade to CO when CO₂ absorbents are very dry (<5% water content); clinically important when circuits are left open with gas flow overnight.
PART 4: PHARMACODYNAMICS OF INHALATIONAL ANESTHETIC AGENTS
A. Mechanism of Action
-
Meyer-Overton Rule (Lipid Theory): Anesthetic potency correlates linearly (on log-log scale) with lipid solubility (oil:gas partition coefficient). Anesthetics dissolve in and perturb lipid membranes, altering membrane fluidity and ion channel function. However, this does not fully explain agent specificity or why some lipid-soluble drugs are not anesthetics.
-
Protein (Ion Channel) Theory: Modern evidence favors direct interaction with membrane proteins:
- Potentiation of GABA-A receptors (Cl⁻ influx → hyperpolarization): shared mechanism with benzodiazepines/barbiturates; primary mechanism for most volatile agents.
- Inhibition of NMDA receptors (glutamate antagonism): nitrous oxide, ketamine; contributes to analgesia and amnesia.
- Potentiation of glycine receptors: contributes to immobility.
- Inhibition of nicotinic ACh receptors.
- Modulation of two-pore domain K⁺ channels (TREK-1/TASK): contribute to hyperpolarization.
-
Multi-site unitary theory: Anesthesia results from simultaneous actions at multiple molecular sites, with no single target sufficient to explain all components of the anesthetic state.
B. Minimum Alveolar Concentration (MAC)
MAC = Alveolar concentration of anesthetic (at 1 atm, in vol%) that prevents movement in response to a surgical skin incision in 50% of patients.
- Analogous to ED50 for IV drugs.
- Lower MAC = greater potency.
- Measured at steady state (alveolar = arterial = brain concentration).
| Agent | MAC (%) in O₂ | Blood:Gas Coefficient | Oil:Gas Coefficient |
|---|---|---|---|
| N₂O | 104% | 0.47 | 1.4 |
| Desflurane | 6-7% | 0.42 | 18.7 |
| Sevoflurane | 2% | 0.65 | 47-54 |
| Isoflurane | 1.17% | 1.4 | 90.8 |
| Halothane | 0.75% | 2.5 | 224 |
MAC Variants
| Parameter | Definition | Approx Value |
|---|---|---|
| MAC-awake | Concentration at which 50% of patients respond to verbal command (open eyes) | 0.15-0.5 × MAC |
| MAC-amnesia | Concentration preventing recall | ~0.25 × MAC |
| MAC-BAR | Concentration blocking adrenergic response to noxious stimulus | ~1.5 × MAC |
Factors Affecting MAC
- Increasing age (↓ ~6% per decade)
- Pregnancy (↓ ~30-40%)
- Hypothermia (↓ ~5-7% per °C below 37°C)
- Hypotension (MAP <40 mmHg)
- Severe anemia (Hgb <4 g/dL)
- CNS depressants (opioids, benzodiazepines, α2-agonists, N₂O)
- Hypothyroidism
- Lithium, methyldopa, reserpine (catecholamine depletion)
- Acute alcohol intoxication
- Young age
- Hyperthermia
- Chronic alcohol abuse
- CNS stimulants (cocaine, amphetamines - catecholamine release)
- Hyperthyroidism
- Anxiety/stress
- Duration of anesthesia
- PaO₂ (unless very low)
- Gender
- Hypo/hypercarbia (moderate ranges)
- Anesthesia type (spinal/epidural)
C. CNS Effects
- Dose-dependent CNS depression: Produces amnesia (0.25 MAC) → sedation → hypnosis → anesthesia → CNS isoelectricity (2+ MAC).
- EEG: Progressive burst suppression with increasing dose. Isoelectricity achievable with desflurane (uniquely reverts to continuous activity despite constant MAC - a property unique to desflurane).
- CMRO₂: All volatile agents decrease cerebral metabolic rate for O₂ in a dose-dependent manner.
- Cerebral blood flow (CBF): All potent agents increase CBF in a dose-related manner by direct cerebral vasodilation. Isoflurane, sevoflurane, desflurane cause less cerebral vasodilation per MAC-multiple than halothane.
- At <1.5 MAC: sevoflurane and desflurane have minimal effect on CBF.
- Phenomenon of "uncoupling": CMRO₂ falls but CBF rises → net vasodilation → potential ↑ ICP in patients with intracranial mass lesions.
- Hypocapnia can blunt or abolish volatile anesthetic-induced increases in CBF.
- Autoregulation: Impaired by volatile agents in a dose-dependent manner (cerebral autoregulation curve shifts and may be abolished at >2 MAC).
- Seizures: Sevoflurane at high doses (1.5-2 MAC) with hypocapnia may provoke EEG abnormalities; clinical significance uncertain. Enflurane is the most clearly epileptogenic of the halogenated agents.
D. Cardiovascular Effects
- ↓ Blood pressure: Via ↓ myocardial contractility + ↓ SVR (vasodilation)
- ↓ Cardiac output: Isoflurane > desflurane/sevoflurane in direct myocardial depression at equivalent MAC
- ↓ SVR: Isoflurane and desflurane more than halothane
- Heart rate: Isoflurane and desflurane tend to maintain or mildly increase HR; halothane may cause bradycardia
- Desflurane: Rapid increase in inspired concentration → transient tachycardia and hypertension due to sympathetic stimulation (reflex from rapid rate of rise)
- Arrhythmias: Halothane sensitizes the myocardium to catecholamine-induced arrhythmias (most important); this is much less with isoflurane/sevoflurane/desflurane
- Myocardial protection: Volatile agents can produce ischemic preconditioning (protection against ischemia-reperfusion injury via KATP channels)
E. Respiratory Effects
- ↓ Tidal volume with compensatory ↑ respiratory rate (net: ↓ minute ventilation → ↑ PaCO₂)
- ↓ Ventilatory response to hypercapnia and hypoxia (blunts peripheral and central chemoreceptors)
- Airway smooth muscle relaxation → bronchodilation (useful in asthmatic patients)
- ↑ Airway secretions: Halothane, ether (less with modern agents)
- Airway irritation: Desflurane is most pungent (avoids inhalation induction); isoflurane intermediate; sevoflurane is least irritating (preferred for inhalation induction, especially in children)
F. Other Organ Effects
- Modern agents (isoflurane, sevoflurane, desflurane): minimal hepatotoxicity; may afford some cytoprotection against ischemic injury.
- Halothane hepatitis: Rare (1:20,000-35,000) immune-mediated fulminant hepatic necrosis from trifluoroacetyl hapten formation; can be fatal. Cross-sensitivity possible with other halogenated agents.
- Fluoride ions from metabolism of methoxyflurane (withdrawn) and enflurane caused nephrotoxicity (high-output renal failure). Sevoflurane metabolism produces fluoride ions but clinical nephrotoxicity is rare because sevoflurane's metabolism is rapid and brief.
- Compound A from sevoflurane + desiccated absorbent: nephrotoxic in animals; low-flow (<2 L/min) sevoflurane use remains a theoretical concern in humans.
- All volatile agents potentiate non-depolarizing neuromuscular blockers (reduce required doses).
- Malignant hyperthermia (MH): All volatile agents (and succinylcholine) are potent triggers in genetically susceptible patients (RYR1 mutation → uncontrolled calcium release from sarcoplasmic reticulum → hyperthermia, rigidity, acidosis). Treated with dantrolene.
- All volatile agents relax uterine smooth muscle in a dose-dependent manner → risk of uterine atony and hemorrhage. Limit to <0.5 MAC during obstetric procedures.
- Volatile anesthetics have global warming potential far exceeding CO₂. Desflurane has the highest warming potential; delivery with lower fresh gas flows reduces environmental impact.
Summary Comparison of Common Inhalational Agents
| Property | N₂O | Desflurane | Sevoflurane | Isoflurane | Halothane |
|---|---|---|---|---|---|
| MAC (%) | 104 | 6-7 | 2 | 1.17 | 0.75 |
| Blood:gas | 0.47 | 0.42 | 0.65 | 1.4 | 2.5 |
| Induction speed | Fast | Fastest | Fast | Moderate | Slow |
| Pungency | Low | High | Low | Moderate | Low |
| Myocardium sensitization | No | No | Minimal | Minimal | Yes |
| Metabolism | <0.004% | <0.02% | 3-5% | 0.2% | 20% |
| Hepatotoxicity | No | No | Rare | Rare | Yes (immune) |
| MH trigger | No | Yes | Yes | Yes | Yes |
| Epileptogenicity | Low | Low | Possible at high dose | Low | Low |
- Barash, Cullen & Stoelting's Clinical Anesthesia, 9e - Ch. 18 (Inhalational Anesthetics)
- Lippincott Illustrated Reviews: Pharmacology - Ch. 1 (Pharmacokinetics) & Ch. 2 (Pharmacodynamics)
- Katzung's Basic and Clinical Pharmacology, 16e - Ch. on General PK/PD principles