Give Me DNB style comprehensive answer for “ Oxygen Dissociation curve “ including relevant diagrams with labelling, flowchart ( if present), bullet point regarding this should be in your answer , potential questions to asked related to this topic.
Reading File
Finding Sources
Finding Sources
Searching Images
oxygen dissociation curve hemoglobin sigmoid
Reading File
Reading File
Reading File
Loading Image
Reading File
Reading File
Reading File
Loading Image
Reading File
Finding Sources
Finding Sources
Loading Image
Your credits are exhausted. Your daily credits reset tomorrow, or you can purchase a top-up for more.
Waiting
Reading File
Finding Sources
Loading Image
Reading File
Loading Image
Finding Sources
I now have all the material needed. Let me compile the full DNB-style comprehensive answer.
Oxygen Dissociation Curve — DNB Comprehensive Answer
1. DEFINITION
The Oxygen Dissociation Curve (ODC) represents the relationship between the partial pressure of oxygen (PO₂) in blood and the percentage saturation of hemoglobin (SaO₂) with oxygen, at standard physiological conditions (pH 7.40, temperature 37°C, PaCO₂ 40 mmHg).
2. KEY DIAGRAMS
Diagram 1 — Standard ODC (Total vs. Dissolved O₂)
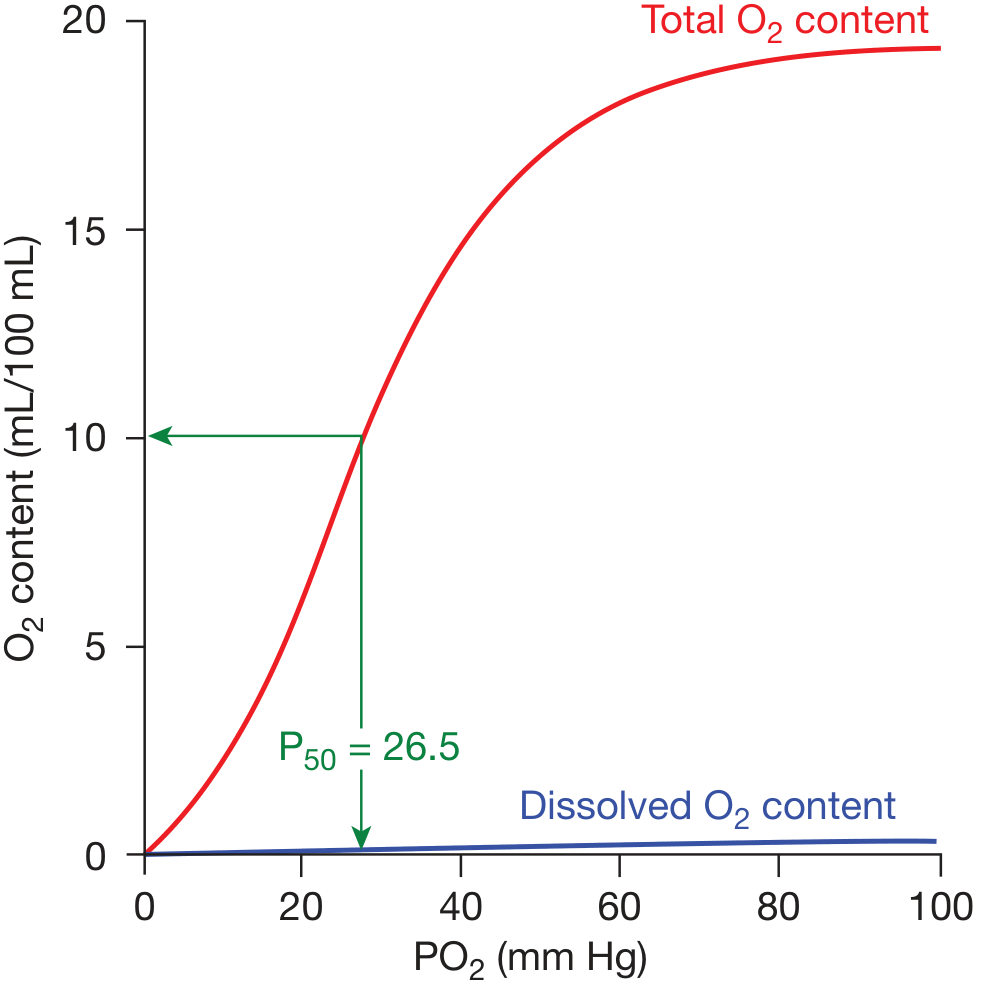
Labels on the standard curve:
- Red line = Total O₂ content (Hb-bound + dissolved)
- Blue line = Dissolved O₂ (linear, tiny proportion)
- P₅₀ = 26.5 mmHg (PO₂ at which Hb is 50% saturated)
- X-axis: PO₂ (mm Hg) | Y-axis: O₂ content (mL/100 mL blood)
- Flat upper portion (plateau): PO₂ 70–100 mmHg — loading zone (lungs)
- Steep middle portion: PO₂ 20–60 mmHg — unloading zone (tissues)
— Fishman's Pulmonary Diseases and Disorders, Fig. 15-1
Diagram 2 — Shifts of the ODC (Harrison's Principles)
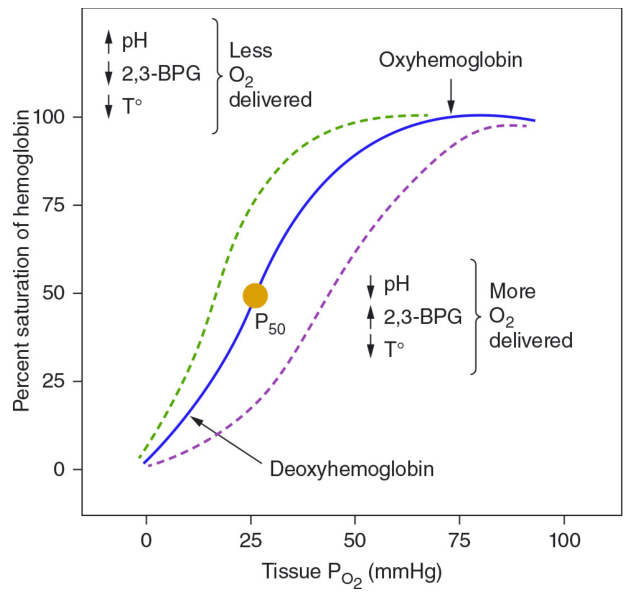
Key labels:
- Blue solid line = Normal curve, P₅₀ at ~26 mmHg
- Green dashed = Left shift → ↑ O₂ affinity → Less O₂ delivered to tissues
- Purple dashed = Right shift → ↓ O₂ affinity → More O₂ delivered to tissues
Diagram 3 — Bohr Effect (pH shift, Lippincott Biochemistry)
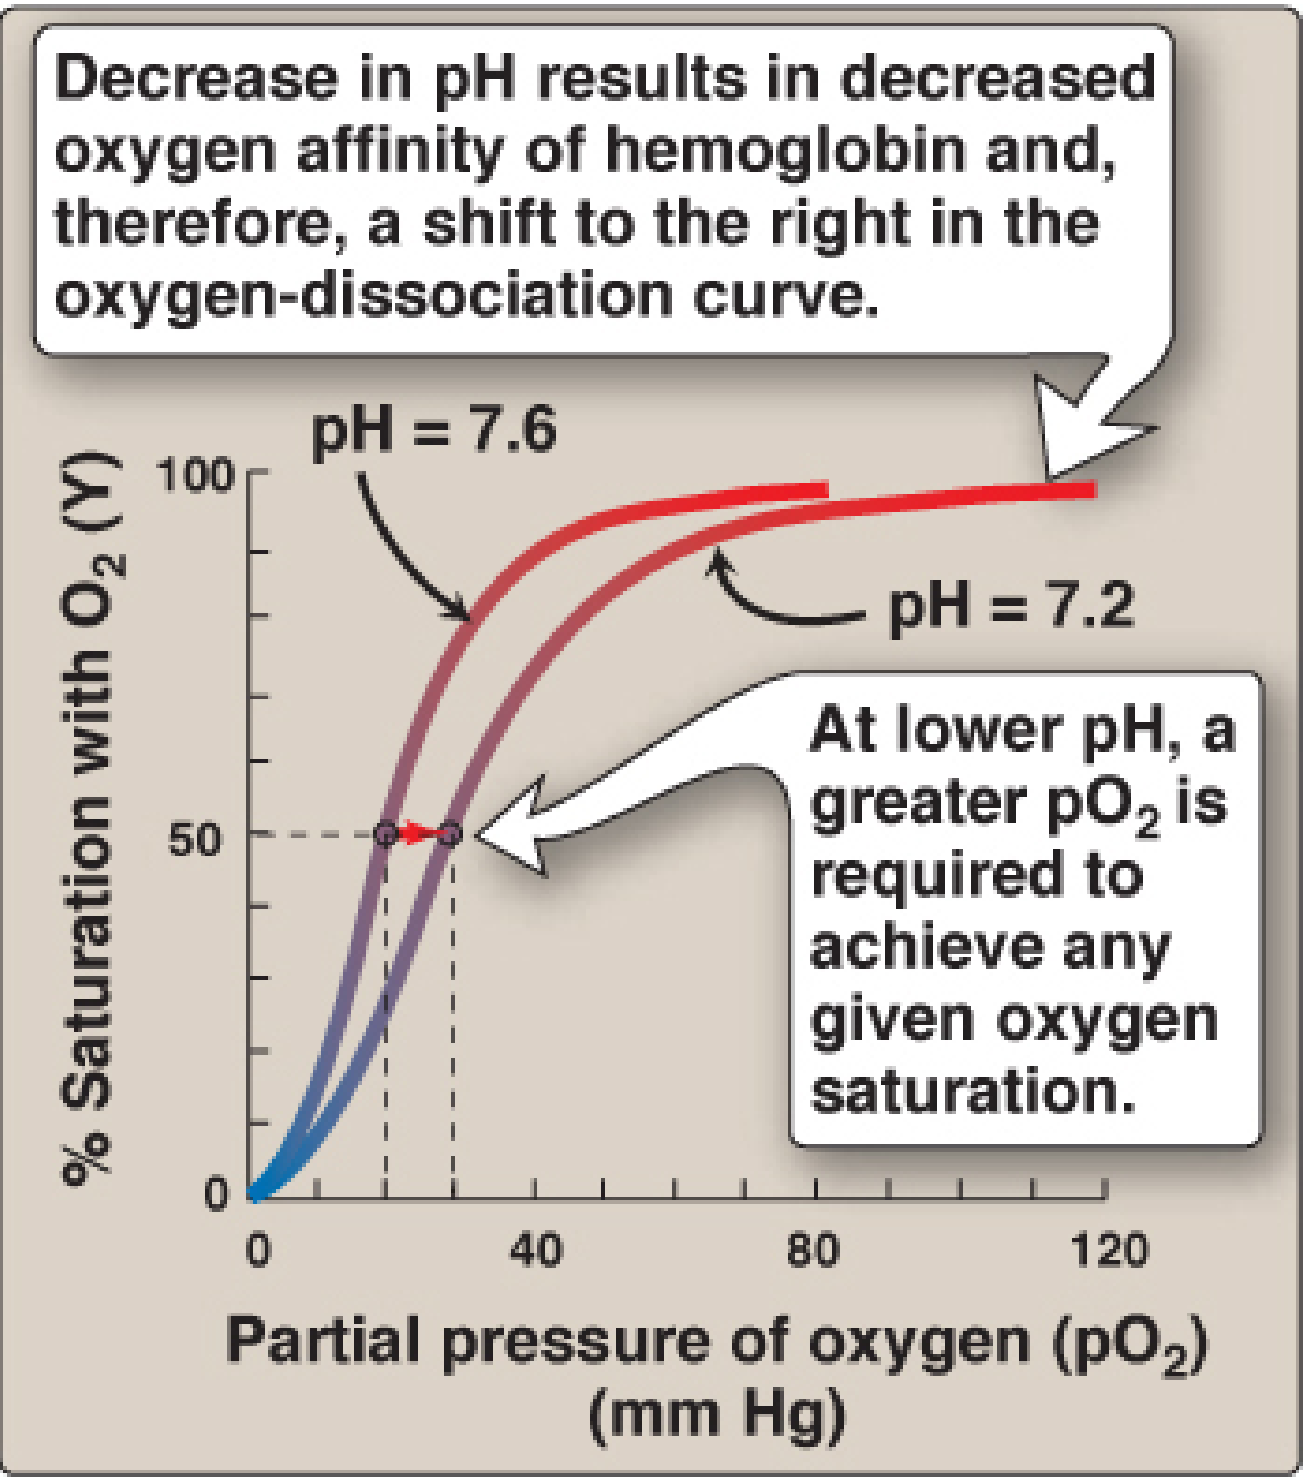
- pH 7.2 → Rightward shift → Lower O₂ affinity → More O₂ released to tissues
- pH 7.6 → Leftward shift → Higher O₂ affinity → Less O₂ released
— Lippincott Illustrated Reviews: Biochemistry 8th Ed., Fig. 3.9
Diagram 4 — Effect of 2,3-BPG on ODC (Lippincott Biochemistry)
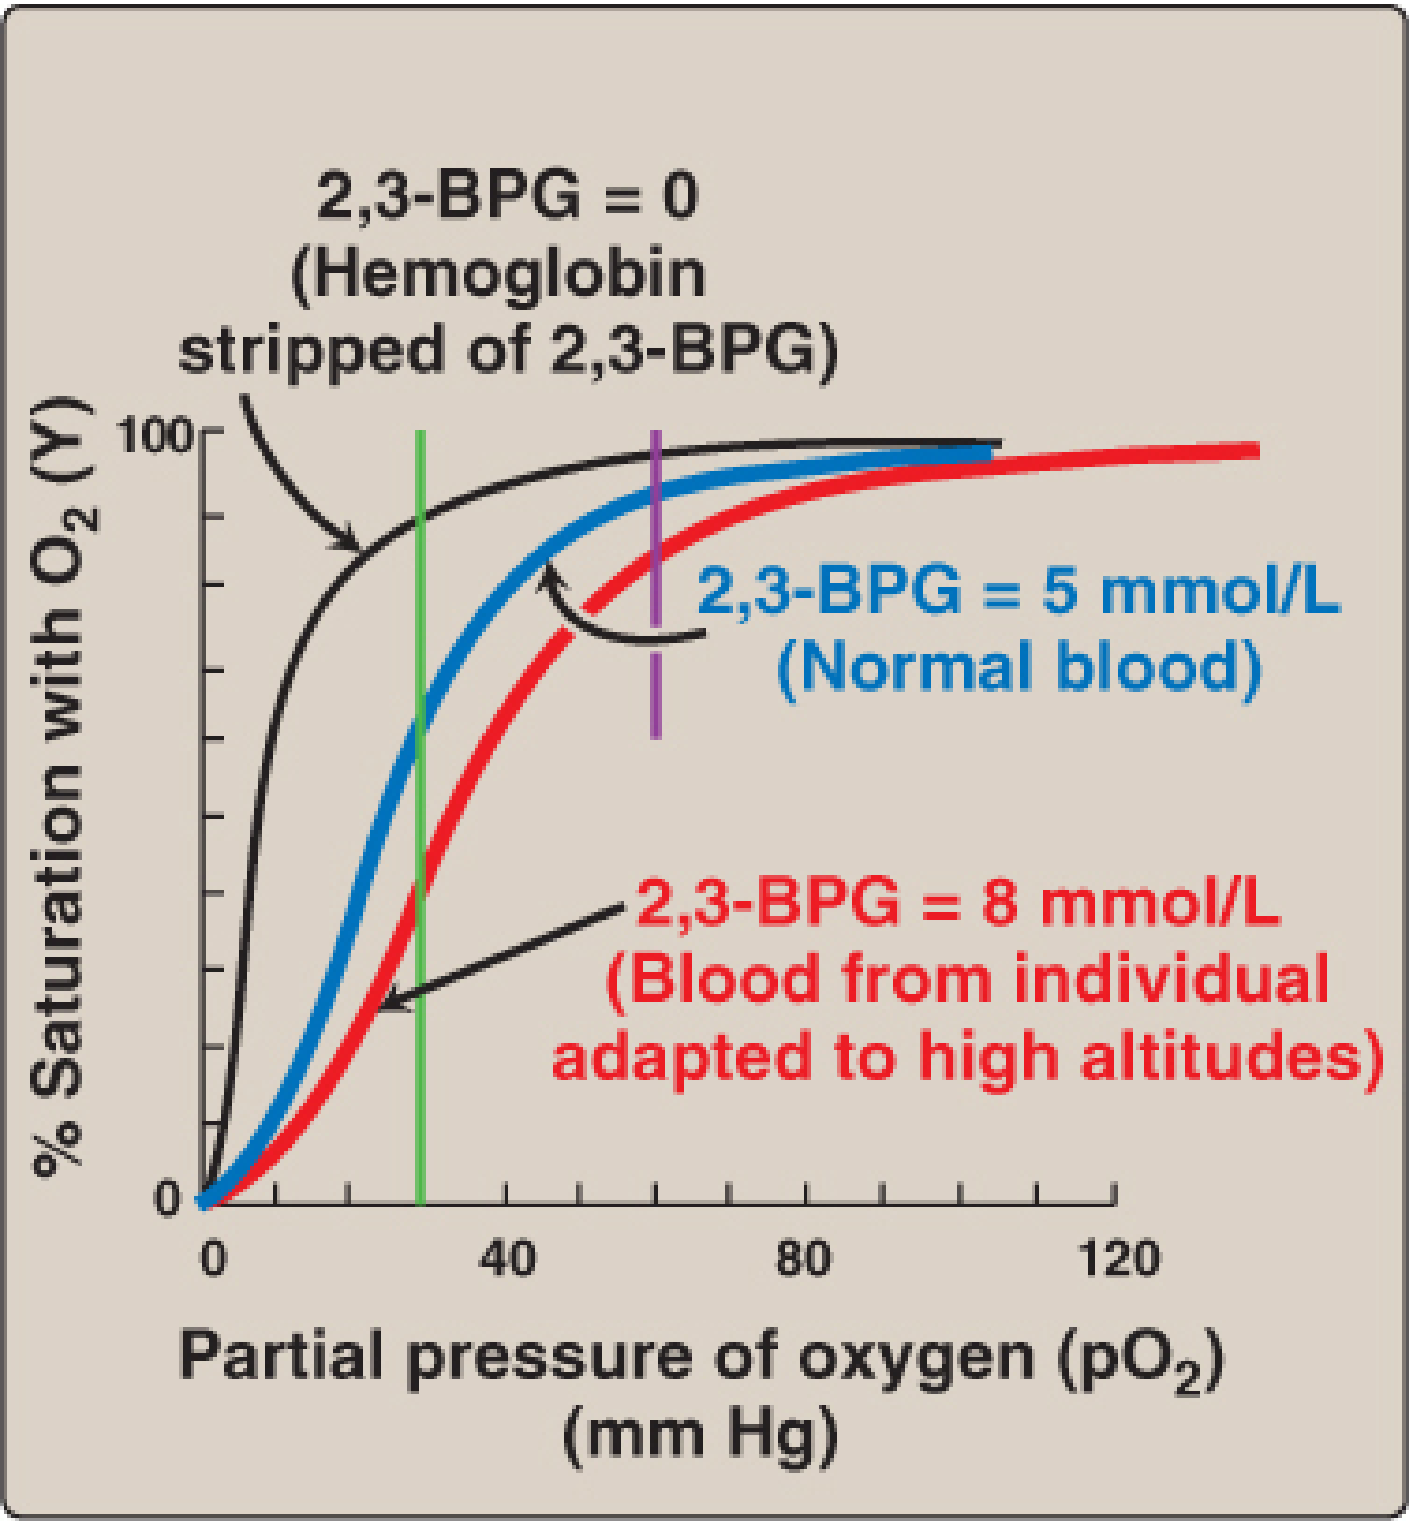
- Black curve (2,3-BPG = 0): Extremely high O₂ affinity, acts as O₂ trap
- Blue (normal, 5 mmol/L): Standard ODC
- Red (8 mmol/L, high altitude): Rightward shift, ↑ O₂ delivery to tissues
— Lippincott Illustrated Reviews: Biochemistry 8th Ed., Fig. 3.12
Diagram 5 — Multiple Shift Factors (Guyton & Hall)
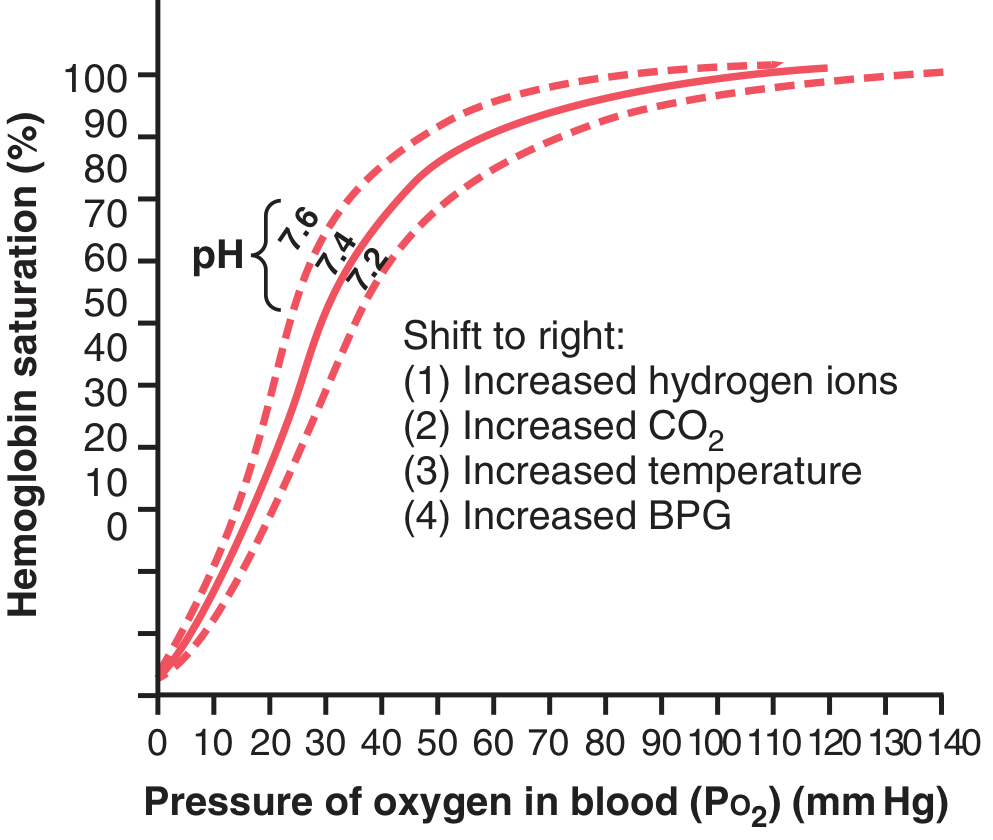
Right shift causes listed:
- ↑ Hydrogen ions (↓ pH)
- ↑ CO₂
- ↑ Temperature
- ↑ 2,3-BPG
— Guyton & Hall Textbook of Medical Physiology, Fig. 41.10
3. SHAPE OF THE CURVE — WHY SIGMOID?
- Myoglobin has a hyperbolic curve (single polypeptide, single heme) — binds O₂ with uniform affinity; would not release O₂ at tissue PO₂
- Hemoglobin has a sigmoid (S-shaped) curve due to cooperative binding (allostery)
- Hb is a tetramer (2α + 2β chains); each subunit influences the others
- Binding of one O₂ molecule to a heme group increases affinity of remaining heme groups for O₂ — this is positive cooperativity
- Hemoglobin's affinity for the last O₂ is ~300× greater than for the first
- The structural basis: T (tense/deoxy) state has low O₂ affinity → O₂ binding converts to R (relaxed/oxy) state with high O₂ affinity
— Lippincott Illustrated Reviews: Biochemistry 8th Ed., pp. 100–101
4. PHYSIOLOGICAL SIGNIFICANCE OF SIGMOID SHAPE
| Region of Curve | PO₂ Range | Function |
|---|---|---|
| Flat upper portion (plateau) | 70–100 mmHg | O₂ loading in lungs; large drops in PaO₂ cause little drop in SaO₂ |
| Steep middle portion | 20–60 mmHg | O₂ unloading in tissues; small drop in PO₂ releases large amounts of O₂ |
| Lower flat portion | <20 mmHg | Residual O₂ reserve; myoglobin takes over here |
Clinical implication of plateau:
- Even if PaO₂ falls from 100 to 70 mmHg (e.g., in mild lung disease), SaO₂ remains ~94% — significant protective reserve
- Below PaO₂ 60 mmHg (SaO₂ ~90%), the curve enters the steep zone — small falls in PaO₂ cause dramatic falls in SaO₂ → clinical hypoxia
5. P₅₀ — DEFINITION AND SIGNIFICANCE
- P₅₀ = PO₂ at which hemoglobin is exactly 50% saturated with oxygen
- Normal P₅₀ = 26.5 mmHg (at pH 7.4, 37°C, PaCO₂ 40 mmHg)
- P₅₀ is an index of oxygen affinity:
- ↑ P₅₀ → Right shift → ↓ O₂ affinity → ↑ O₂ delivery to tissues
- ↓ P₅₀ → Left shift → ↑ O₂ affinity → ↓ O₂ delivery (O₂ held tightly by Hb)
6. ALLOSTERIC EFFECTORS — FACTORS SHIFTING THE ODC
6A. Bohr Effect (H⁺ and CO₂)
Mechanism:
- In metabolizing tissues, CO₂ is produced → enters RBCs → converted to H₂CO₃ (by carbonic anhydrase) → dissociates to HCO₃⁻ + H⁺
- ↑ H⁺ protonates specific histidine residues on deoxyhemoglobin → forms salt bridges → stabilizes T (deoxy) state → releases O₂
- The reaction:
HbO₂ + H⁺ ⇌ HbH⁺ + O₂
- In lungs: CO₂ is exhaled → ↓ pCO₂ → ↑ pH → shifts curve LEFT → Hb loads O₂
- In tissues: ↑ CO₂, ↓ pH → shifts curve RIGHT → Hb unloads O₂
Summary: The Bohr effect is a physiological feedback system that automatically delivers more O₂ to metabolically active (acidic) tissues
6B. 2,3-Bisphosphoglycerate (2,3-BPG / 2,3-DPG)
- Most abundant organic phosphate in RBCs
- Synthesized via Rapoport–Luebering shunt of glycolysis
- Binds exclusively to deoxyhemoglobin (not oxyhemoglobin), in a central cavity formed by the two β-chains
- Binding stabilizes T (deoxy) state → ↓ O₂ affinity → RIGHT shift
2,3-BPG levels increase in:
- Chronic hypoxia (COPD, emphysema)
- High altitude (adaptation mechanism)
- Chronic anemia
- Pregnancy (facilitates O₂ transfer to fetus)
- Hyperthyroidism, fever
2,3-BPG levels decrease in:
- Stored bank blood (O₂ affinity increases → stored blood = "O₂ trap")
- 2,3-BPG restores in 6–24 hours after transfusion
- Septic shock, hypothyroidism, hexokinase deficiency
— Lippincott Illustrated Reviews: Biochemistry 8th Ed., pp. 107–108
6C. Temperature
| Temperature | Direction | Effect |
|---|---|---|
| ↑ Temperature (exercise, fever, infection) | RIGHT shift | ↑ O₂ delivery to tissues |
| ↓ Temperature (hypothermia) | LEFT shift | Hb holds O₂ more tightly |
6D. Carbon Monoxide (CO)
- CO binds hemoglobin iron with 220× greater affinity than O₂ → forms carboxyhemoglobin
- CO shifts remaining heme sites to R (oxy) conformation → LEFT shift of ODC
- Changes curve shape from sigmoid → hyperbolic
- Net result: Hb cannot release O₂ to tissues → tissue hypoxia despite normal PaO₂
- Treatment: 100% O₂ (or hyperbaric O₂) to displace CO
7. COMPREHENSIVE SHIFT SUMMARY TABLE
| Factor | Direction | Mechanism | O₂ Delivery |
|---|---|---|---|
| ↑ pH (alkalosis) | LEFT | Salt bridges disrupted; R state stabilized | ↓ |
| ↓ pH (acidosis) | RIGHT | Salt bridges in T state | ↑ |
| ↑ CO₂ | RIGHT | Bohr effect; carbamate formation | ↑ |
| ↓ CO₂ | LEFT | Reverse Bohr effect | ↓ |
| ↑ Temperature | RIGHT | Destabilizes Hb-O₂ bond | ↑ |
| ↓ Temperature | LEFT | Stabilizes bond | ↓ |
| ↑ 2,3-BPG | RIGHT | Stabilizes T state | ↑ |
| ↓ 2,3-BPG | LEFT | R state predominates | ↓ |
| CO poisoning | LEFT | Shifts to R conformation | ↓↓ |
| Fetal Hb (HbF) | LEFT | γ-chains bind 2,3-BPG poorly | ↑ uptake from placenta |
| Methemoglobin | LEFT | Fe²⁺ → Fe³⁺ | ↓ |
| High altitude (acute) | — | No shift yet (compensatory later) | — |
— Mulholland & Greenfield's Surgery 7e, Table 10.6; Lippincott Biochemistry 8e
8. FETAL HEMOGLOBIN (HbF)
- Structure: α₂γ₂ (γ-chains replace β-chains)
- γ-chains bind 2,3-BPG less avidly than β-chains → HbF has higher O₂ affinity than HbA (adult Hb)
- HbF ODC is shifted LEFT relative to maternal Hb
- Physiological purpose: Enables O₂ transfer from maternal blood (lower saturation) to fetal blood across placenta
- P₅₀ of HbF ≈ 19–20 mmHg vs. 26.5 mmHg for HbA
- After birth: HbF → HbA replacement over 3–6 months; compensated by ↑ 2,3-BPG to maintain O₂ delivery
— Mulholland & Greenfield's Surgery 7e; Morgan & Mikhail's Clinical Anesthesiology 7e
9. OXYGEN CONTENT EQUATION
$$\text{CaO}_2 = (1.34 \times [\text{Hb}] \times \text{SaO}_2) + (0.003 \times \text{PaO}_2)$$
- 1.34 mL = O₂ carrying capacity per gram of Hb (Hüfner's constant)
- 0.003 mL/dL/mmHg = solubility coefficient of dissolved O₂
- Normal CaO₂ ≈ 20 mL/100 mL blood
- Normal CvO₂ (mixed venous) ≈ 15 mL/100 mL blood (SvO₂ ~75%)
- O₂ delivery (DO₂) = CaO₂ × Cardiac Output
- O₂ extraction = CaO₂ − CvO₂ ≈ 5 mL/100 mL at rest (25% of delivered O₂)
10. FLOWCHART — O₂ LOADING & UNLOADING
ALVEOLAR CAPILLARY
PO₂ = 100 mmHg → High PO₂ + High pH (CO₂ exhaled)
         ↓
    Hb shifts to R (oxy) state
         ↓
    Hb LOADS O₂ (SaO₂ ~98%)
         ↓
ARTERIAL BLOOD → transported to tissues
         ↓
TISSUE CAPILLARY
↑ CO₂, ↑ H⁺, ↑ 2,3-BPG, ↑ Temperature
PO₂ = 40 mmHg (mixed venous)
         ↓
    Hb shifts to T (deoxy) state
    [Bohr Effect active]
         ↓
    Hb UNLOADS O₂ (~25% extracted at rest)
         ↓
VENOUS BLOOD (SvO₂ ~75%) → back to lungs
11. CLINICAL APPLICATIONS
| Scenario | ODC Shift | Clinical Relevance |
|---|---|---|
| Stored bank blood | LEFT (↓ 2,3-BPG) | O₂ trap; poor tissue delivery — restores in 6–24h |
| Massive transfusion | LEFT | Risk of tissue hypoxia despite Hb correction |
| High altitude | RIGHT (↑ 2,3-BPG after hours) | Adaptation → more O₂ unloaded |
| COPD/Chronic anemia | RIGHT | Compensatory ↑ 2,3-BPG |
| CO poisoning | LEFT | Functional anemia + O₂ trapping → treat with O₂ |
| Sepsis/Exercise | RIGHT | ↑ Temp, ↓ pH → ↑ tissue O₂ |
| Hypothermia | LEFT | ↓ O₂ unloading (protective in cardiac surgery) |
| Pulse oximetry (SpO₂) | — | Measures HbO₂ saturation — unreliable in CO poisoning (falsely high) |
| Methemoglobinemia | LEFT | Fe²⁺ → Fe³⁺; co-oximetry needed |
| Alkalosis (over-ventilation) | LEFT | Causes tetany due to ↑ Hb-O₂ affinity → ↓ ionized Ca²⁺ |
12. COMPARISON: MYOGLOBIN vs. HEMOGLOBIN ODC
| Feature | Myoglobin | Hemoglobin |
|---|---|---|
| Structure | Monomer (1 heme) | Tetramer (4 hemes) |
| Curve shape | Hyperbolic | Sigmoidal |
| O₂ affinity | Very high (P₅₀ ~1–2 mmHg) | Lower (P₅₀ ~26.5 mmHg) |
| Cooperativity | None | Positive cooperativity |
| Allosteric effectors | Not affected | Affected by pH, CO₂, 2,3-BPG, temperature |
| Function | O₂ storage in muscle | O₂ transport in blood |
| O₂ release at tissue PO₂ | Very little (holds O₂ at 40 mmHg) | ~25% unloaded at rest |
13. QUICK-RECALL BULLET POINTS
- Normal SaO₂ in arterial blood: 97–99% (PaO₂ ~100 mmHg)
- Normal SvO₂ in mixed venous blood: ~75% (PO₂ ~40 mmHg)
- P₅₀ normal: 26.5 mmHg; HbF P₅₀: ~19–20 mmHg (LEFT shifted)
- Hb carries ~1.34 mL O₂/g (Hüfner's constant); each gram Hb = theoretical max 1.39 mL
- At PaO₂ = 60 mmHg → SaO₂ ≈ 90% → critical threshold (steep slope begins)
- Bohr effect = rightward shift due to ↑ H⁺/CO₂ → enhances tissue O₂ delivery
- 2,3-BPG binds β-chains of deoxyhemoglobin → stabilizes T state → right shift
- HbF has γ-chains that bind 2,3-BPG poorly → LEFT shift → higher O₂ affinity
- CO poisoning → LEFT shift + converts sigmoid to hyperbolic curve
- Hill coefficient (n) for Hb ≈ 2.8 (reflects cooperativity; 1 = no cooperativity)
- Stored blood: 2,3-BPG depleted after days; replenished within 6–24 hours post-transfusion
- In exercise: RIGHT shift due to ↑ temp, ↓ pH, ↑ CO₂, ↑ 2,3-BPG → maximizes O₂ delivery
- Hypothermia in cardiac surgery deliberately uses LEFT shift → protects myocardium
14. POTENTIAL DNB VIVA / EXAM QUESTIONS
Level 1 — Fundamental
- What is the oxygen dissociation curve? Why is it sigmoid and not hyperbolic?
- Define P₅₀. What is its normal value? What does it indicate?
- What is the Bohr effect? What is its physiological significance?
- What is the oxygen-carrying capacity of hemoglobin? Write the Fick equation for oxygen content.
Level 2 — Mechanisms
5. How does 2,3-BPG shift the ODC? Where does it bind? When are 2,3-BPG levels elevated?
6. Compare the ODC of fetal hemoglobin (HbF) with adult hemoglobin (HbA). Explain the structural basis.
7. Why does stored blood cause tissue hypoxia even after transfusion? How is it treated?
8. Explain the R (relaxed) and T (tense) states of hemoglobin and their relation to cooperative O₂ binding.
Level 3 — Clinical Application
9. A patient with CO poisoning has normal PaO₂ and normal pulse oximetry but is hypoxic. Explain.
10. How does high altitude adaptation involve the ODC? What adaptive mechanism shifts the curve?
11. Why is a left shift of the ODC detrimental in a patient receiving massive blood transfusion?
12. A patient with metabolic alkalosis develops perioral tingling and carpal spasm. How does the ODC explain this?
13. How does the ODC explain the "oxygen reserve" protecting patients with mild-moderate lung disease?
14. What happens to the ODC in methemoglobinemia? How is it diagnosed?
15. A premature neonate has persistent hypoxia despite O₂ therapy. How does HbF contribute? When does HbF switch to HbA?
Level 4 — Integrated / Exam Essay Topics
16. Draw and label the standard ODC. Describe the factors causing left and right shifts with clinical examples.
17. Discuss the physiological and clinical significance of the sigmoid shape of the ODC.
18. Explain oxygen transport in blood with equations. How does anemia differ from hypoxemia in terms of ODC?
Sources: Fishman's Pulmonary Diseases and Disorders; Lippincott Illustrated Reviews: Biochemistry 8e; Guyton & Hall Textbook of Medical Physiology; Harrison's Principles of Internal Medicine 21e; Mulholland & Greenfield's Surgery 7e; Morgan & Mikhail's Clinical Anesthesiology 7e
This is a shared conversation. Sign in to Orris to start your own chat.