
Fundoscopy detail
Reading File
Fundoscopy (ophthalmoscopy) allows direct visualization of the retina, optic disc, macula, and retinal vessels. Let me pull comprehensive textbook content on this topic.
Searching sources...
Finding Sources
Finding Sources
Kanski's Clinical Ophthalmology is the gold standard reference here. Let me read the key blocks.
Reading File
Reading File
Reading File
Reading File
Finding Sources
Finding Sources
Finding Sources
Finding Sources
Finding Sources
Reading File
Reading File
Now let me fetch the key fundus images from Kanski's to include in the answer.
Loading Image
Loading Image
Loading Image
I now have comprehensive material to write a detailed, well-structured answer. Let me compile it.
Fundoscopy (Ophthalmoscopy) - Detailed Overview
Source: Kanski's Clinical Ophthalmology 10th Ed. | Bradley & Daroff's Neurology in Clinical Practice
What is Fundoscopy?
Fundoscopy (ophthalmoscopy) is direct or indirect examination of the posterior segment of the eye - specifically the optic disc, retinal vasculature, macula, and retinal background. It can reveal disease of the eye itself or systemic disease elsewhere in the body (diabetes, hypertension, raised intracranial pressure).
Types of Fundoscopy
1. Direct Ophthalmoscopy
The most commonly used bedside technique.
- Magnification: ×15 (significantly magnified, monocular image)
- Field of view: Small (approximately 5°)
- Stereopsis: None
- Key advantage: Portable, can be performed at the bedside
The Red Reflex
By placing a +15 D lens and examining from 15-20 cm, lens and vitreous opacities can be detected. Absence of the red reflex indicates a media opacity (dense cataract, vitreous haemorrhage).
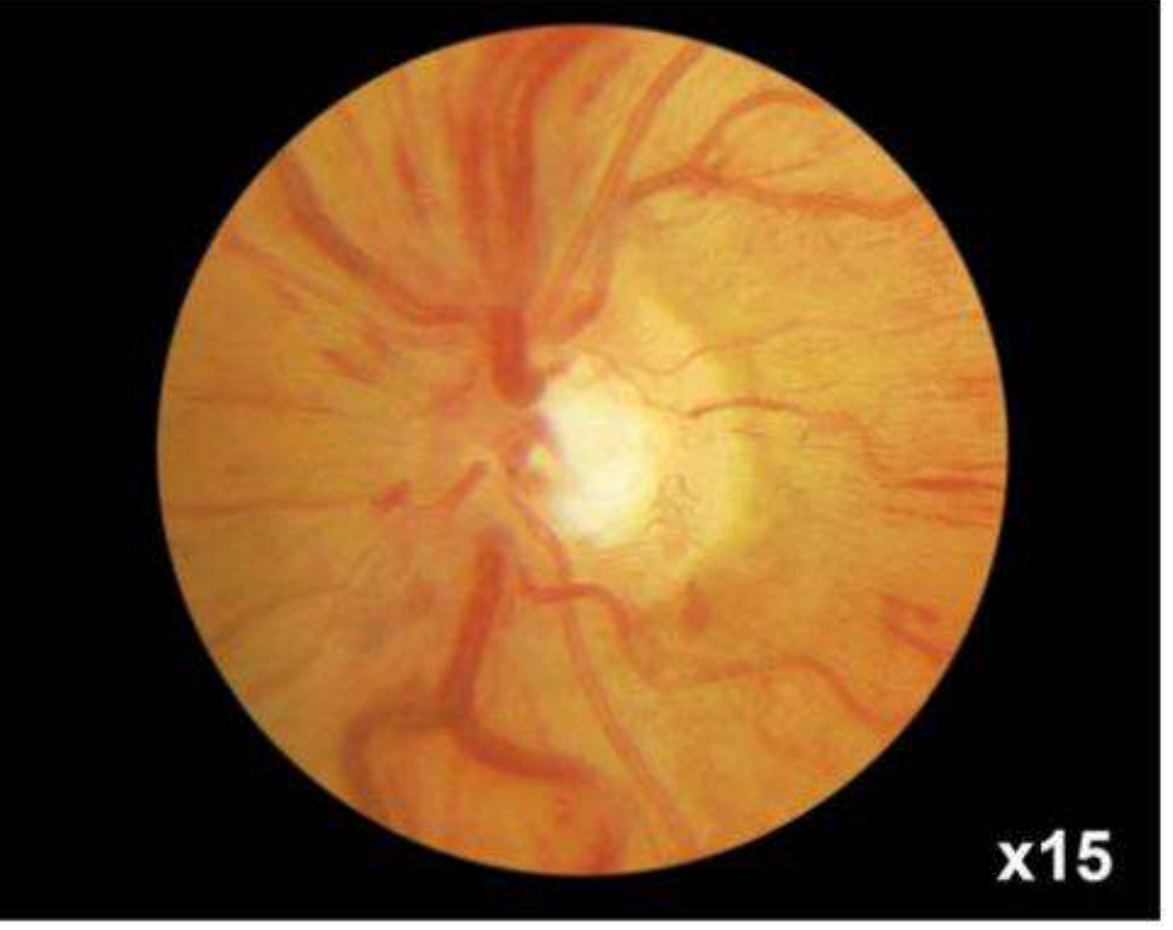
Fig. - Normal fundus image at ×15 magnification (direct ophthalmoscopy). Note the bright optic disc, radiating retinal vessels, and orange background.
Technique (Step by Step):
- Dim room lights; ask patient to fixate on a distant target (minimises miosis from accommodation)
- Examine the right eye with your right hand/right eye, standing on the patient's right. Reverse for the left eye.
- Select 'O' on the lens dial
- Direct the beam at the pupil and approach from the temporal side at a slight angle
- The optic disc comes into view at approximately 3.5 cm from the eye
- Adjust focus with the index finger rotating the lens dial:
- Hyperopes: use plus lens (green numbers)
- Myopes: use minus lens (red numbers)
- Examine the disc first (clarity, colour, elevation, cup, vessels), check for spontaneous venous pulsation
- Follow vessels into the periphery (ask patient to look up/down/sides for the periphery)
- Locate the macula by moving the light 2 disc diameters temporally from the disc, or ask the patient to look directly at the light
To reduce corneal reflection: use the small aperture and direct the beam toward the edge of the pupil rather than the centre.
2. Slit Lamp Biomicroscopy (Indirect Ophthalmoscopy)
Uses contact or non-contact lenses with the slit lamp. Provides a stereoscopic, inverted and laterally reversed image with a wider field of view than direct ophthalmoscopy.
Non-contact Lenses:
| Lens | Magnification | Field of View | Working Distance | Best Use |
|---|---|---|---|---|
| 60 D | High | Narrow | 13 mm | Posterior pole, high magnification |
| 78 D | Intermediate | Intermediate | - | General purpose |
| 90 D | Lower | Wide | 7 mm (short) | Useful with small pupils |
Correction factors for disc size estimation:
- Volk 60 D: ×0.88-1.0
- 90 D: ×1.3
Technique:
- Slit beam adjusted to ~¼ of full diameter
- Illumination angled coaxial with the viewing system
- Lens held close to the eye with flat surface toward the patient
3. Head-Mounted Binocular Indirect Ophthalmoscopy (BIO)
- Allows retinal visualisation through greater media opacity than slit lamp
- Readily facilitates scleral indentation
- Image is inverted and laterally reversed, viewed stereoscopically
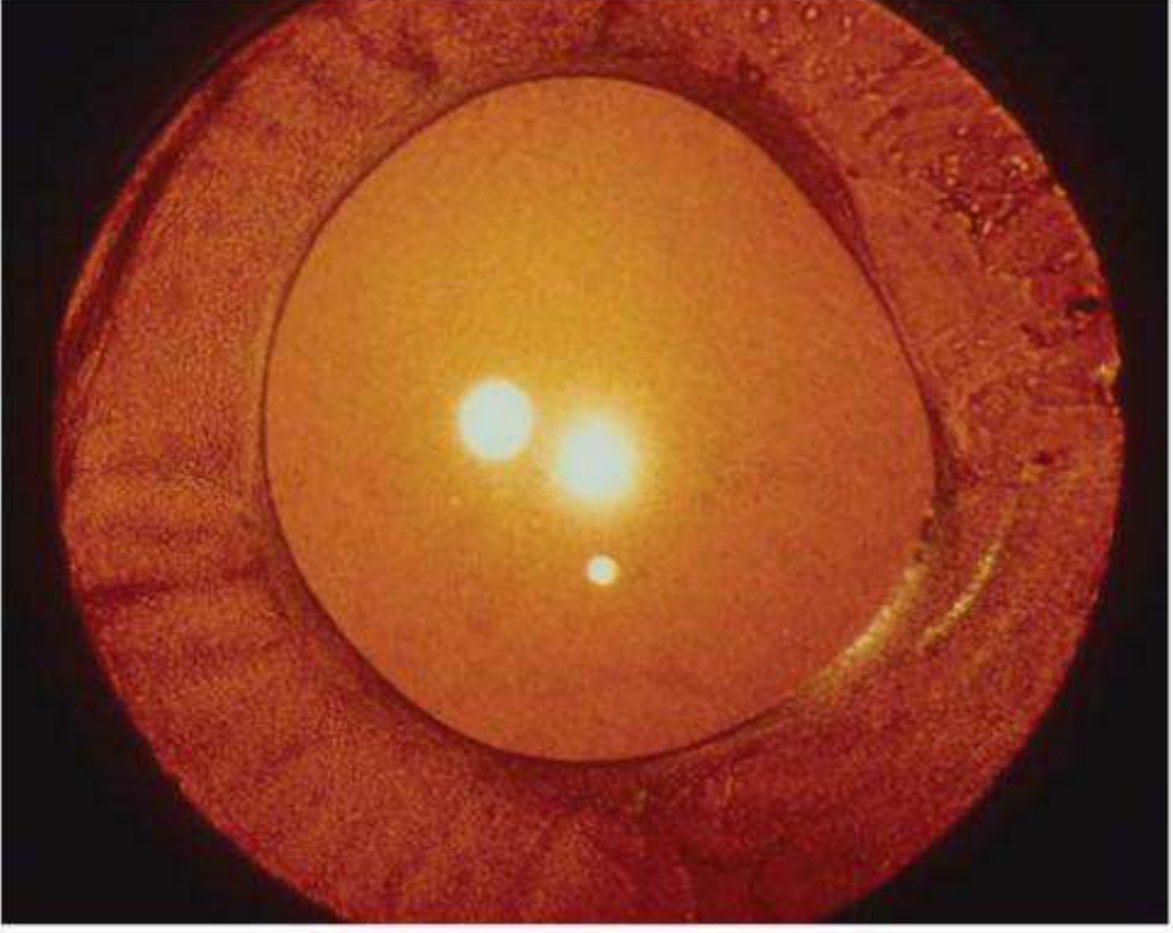
Fig. - Red reflex showing anterior capsular thickening (lens opacities appear as bright spots within the pupillary area).
BIO Lenses:
| Lens | Magnification | Field of View | Notes |
|---|---|---|---|
| 20 D | ×3 | ~45° | Most commonly used for general examination |
| 28 D | ×2.27 | 53° | Shorter working distance, useful for small pupils |
| 40 D | ×1.5 | 65° | Mainly for small children, wide scan |
| Panretinal 2.2 | ~20 D equivalent | ~28 D equivalent | Can be used with small pupils |
| Macula Plus 5.5 | Ultra-high | Small | Macula and optic disc detail |
Magnification formula: 60 ÷ dioptric power = magnification
(e.g., 20 D lens → 60 ÷ 20 = ×3)
BIO Technique:
- Patient supine (reclining chair preferred, not sitting)
- Pupils must be dilated
- Set eyepieces to correct interpupillary distance
- Examine peripheral fundus first (helps patient adapt to light)
- Ask patient to move eyes into optimal positions to view periphery
4. Scleral Indentation
Used to visualise the retina anterior to the equator (periphery beyond what is otherwise visible). Also permits kinetic evaluation of the retina.
- A cotton-tipped applicator is applied to the outside of the eyelid at the tarsal plate margin
- Indenter kept tangential to the globe at all times (perpendicular indentation causes pain and risks scleral perforation)
- For 3 and 9 o'clock positions: direct scleral indentation with topical anaesthesia
What to Examine Systematically
From Neurology in Clinical Practice (Bradley & Daroff):
Step-by-step evaluation order:
- Red reflex - absent = media opacity
- Follow a retinal vessel centrally to locate the optic disc
- Optic disc - assess for:
- Oedema/papilloedema (blurred disc margins, loss of spontaneous venous pulsation)
- Pallor (optic atrophy)
- Cupping (glaucoma - cup:disc ratio; normal ≤0.5)
- Peripapillary region - look for:
- Haemorrhages
- Cotton-wool spots (nerve fibre layer infarcts)
- Hard exudates
- Retinal folds
- Retinal vasculature - arteries and veins from the disc
- Macula - temporal to the optic disc, the area of finest central vision
Key Normal Fundus Landmarks
| Structure | Normal Appearance |
|---|---|
| Optic disc | Round/oval, pink-orange, sharp margins, central pale cup |
| Cup:Disc ratio | ≤0.5 (values >0.6 raise suspicion for glaucoma) |
| Retinal arteries | Bright red, narrower, with a central light reflex |
| Retinal veins | Darker red, wider (artery:vein ratio = 2:3) |
| Macula | Avascular, darker than surrounding retina, central foveal reflex (bright spot) |
| Background | Uniform orange-red (from RPE and choroidal pigment) |
Common Abnormal Fundoscopic Findings
| Finding | Significance |
|---|---|
| Papilloedema | Raised intracranial pressure (bilateral disc swelling, loss of venous pulsation, haemorrhages) |
| Optic disc pallor | Optic atrophy (multiple sclerosis, optic neuritis, ischaemia) |
| Increased cup:disc ratio (>0.6) | Glaucoma |
| Cotton-wool spots | Nerve fibre layer infarcts - hypertension, diabetes, HIV retinopathy |
| Hard exudates | Lipid deposits - diabetic maculopathy, hypertensive retinopathy |
| Flame haemorrhages | Hypertensive retinopathy (nerve fibre layer) |
| Dot/blot haemorrhages | Diabetic retinopathy (deep retinal layers) |
| Neovascularisation | Proliferative diabetic retinopathy |
| AV nipping (nicking) | Hypertensive retinopathy - arterial wall thickening compresses underlying vein at crossings |
| Silver/copper wiring | Arteriolar sclerosis in hypertension |
| Roth spots | White-centred retinal haemorrhages - infective endocarditis, leukaemia |
| Absent red reflex | Cataract, vitreous haemorrhage, retinoblastoma (in children - white reflex/leukocoria) |
| Cherry-red spot | Central retinal artery occlusion, lysosomal storage disorders |
| Macular star | Hypertensive retinopathy - hard exudates radiating from macula |
Dilation for Fundoscopy
- Preferred when possible - gives a much better view
- Can be done without dilation in a darkened room with patient fixating a distant target
- Mydriatics used: Tropicamide 1% (short-acting), Cyclopentolate 1%
- Contraindications to dilation: Suspected narrow-angle glaucoma, head injury monitoring (obscures pupillary response), certain corneal/anterior segment pathology
- In patients with normal anterior chamber anatomy, risk of precipitating angle-closure glaucoma is minimal
Fundoscopy in Systemic Disease - At a Glance
| Systemic Condition | Key Fundoscopic Findings |
|---|---|
| Diabetes mellitus | Microaneurysms, dot/blot haemorrhages, hard exudates, neovascularisation, vitreous haemorrhage |
| Hypertension | Copper/silver wiring, AV nicking, flame haemorrhages, cotton-wool spots, papilloedema (malignant hypertension), macular star |
| Raised ICP | Bilateral papilloedema, loss of venous pulsation |
| Multiple sclerosis | Optic disc pallor (after optic neuritis) |
| Glaucoma | Increased C:D ratio, cup asymmetry, disc notching, RNFL defects |
| Infective endocarditis | Roth spots |
| Sickle cell disease | Sea-fan neovascularisation, salmon-patch haemorrhages |
Sources: Kanski's Clinical Ophthalmology: A Systematic Approach, 10th Ed., pp. 21-27 | Bradley and Daroff's Neurology in Clinical Practice, p. 250
Visual acuity detail.
Finding Sources
Searching sources...
Reading File
Reading File
Reading File
Reading File
Finding Sources
Reading File
Finding Sources
Reading File
Reading File
Reading File
Loading Image
I have comprehensive content from Kanski's Clinical Ophthalmology and Guyton's Physiology. Now let me compile the full detailed answer.
Visual Acuity - Detailed Overview
Source: Kanski's Clinical Ophthalmology 10th Ed. | Guyton & Hall Medical Physiology | Ganong's Review of Medical Physiology
Definition and Physiology
Visual acuity (VA) is the ability to resolve fine spatial detail - specifically the minimum angle of resolution (MAR), i.e., the minimum angle of separation (subtended at the nodal point of the eye) between two objects that allows them to be perceived as distinct.
Physiological basis (Guyton & Hall):
- A focused point of light on the retina has a minimum diameter of ~11 micrometres (due to optical imperfections)
- Foveal cone diameter: ~1.5 µm
- Two points can be distinguished when their centres are ≥2 µm apart on the retina
- Normal visual acuity = 25 seconds of arc (the minimum angle between two distinguishable points)
- At 10 metres: two points must be 1.5-2 mm apart to be seen as separate
- VA is maximum at the fovea (<0.5 mm / <500 µm diameter = <2° of visual field)
- VA falls >10-fold toward the retinal periphery due to convergence of multiple rods/cones onto single optic nerve fibres
Distance Visual Acuity
1. Snellen Chart
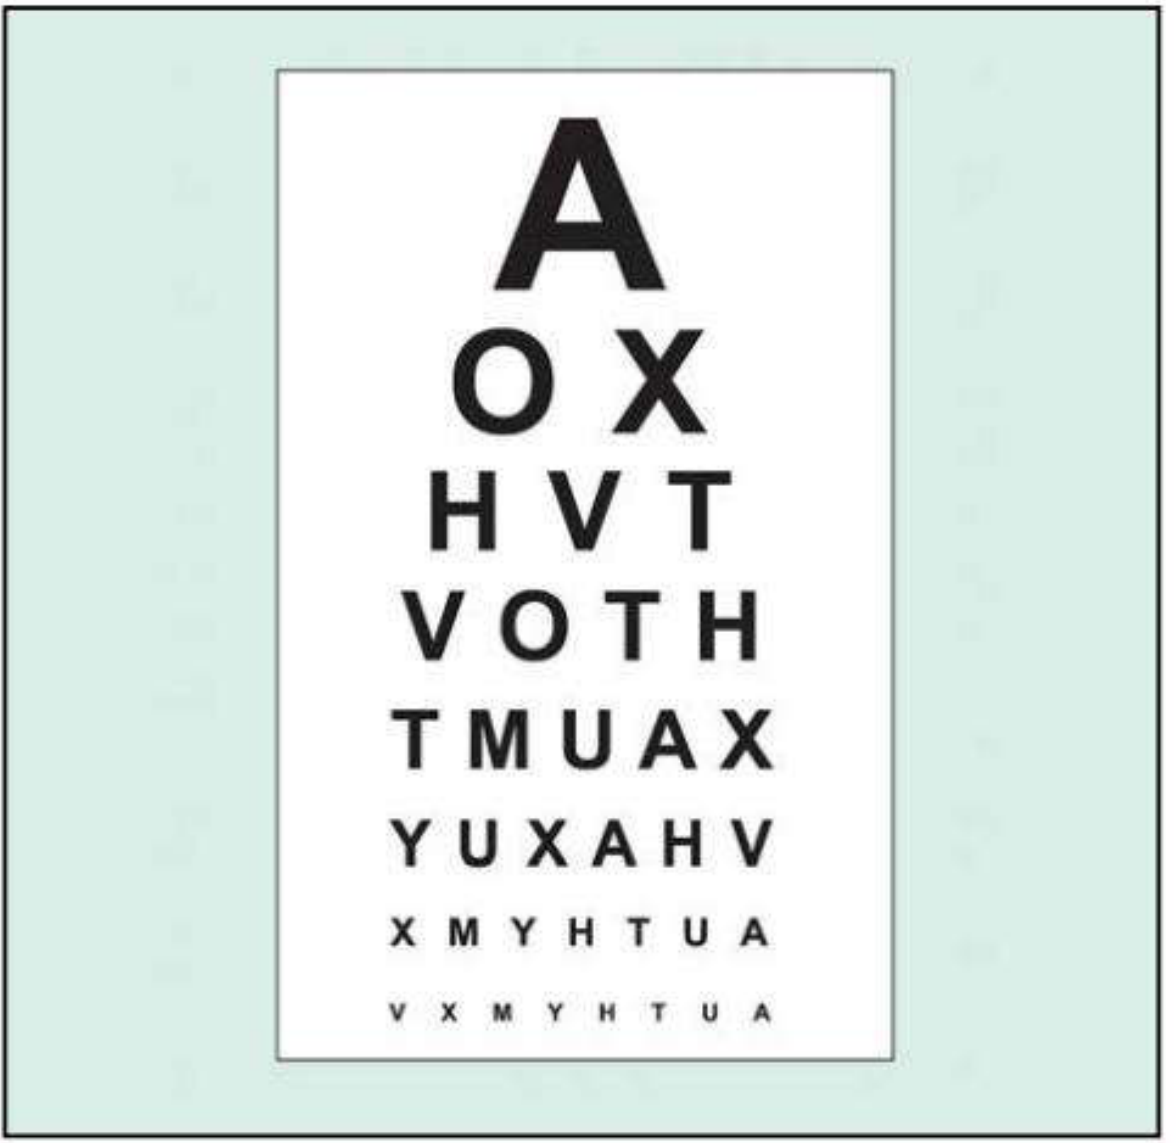
Fig. - Snellen visual acuity chart used at 6 m (20 ft)
The most widely used clinical chart. Uses optotypes (black letters/symbols on a white background) of progressively decreasing size.
Snellen Notation:
The result is expressed as a fraction: distance tested / distance at which the letter should normally be readable
| Notation | Meaning |
|---|---|
| 6/6 (metric) = 20/20 (imperial) | Normal VA - reads at 6 m what a normal person reads at 6 m |
| 6/12 (20/40) | Reads at 6 m what a normal person reads at 12 m |
| 6/60 (20/200) | Reads at 6 m what a normal person reads at 60 m |
| 6/4 (20/13) | Better than normal |
- Testing distance: 6 metres (or with a mirror)
- Worse eye tested first, other eye occluded
- Patient uses own glasses or contact lenses (corrected VA)
- Normal corrected VA in young adults is often better than 6/6
Limitations of Snellen chart:
- More letters on lower lines creates unbalanced "crowding" effect
- Fewer larger letters reduce accuracy at lower VA levels
- Variable readability between individual letters
- Lines not balanced for consistency
- Letter/row spacing is not systematic
- Lower accuracy and consistency - unsuitable for research
2. LogMAR Visual Acuity
LogMAR = Logarithm of the Minimum Angle of Resolution
This is the standard in clinical research and increasingly in clinical practice.
Concept:
- If a 6/6 letter subtends 5' of arc, each limb has an angular width of 1' → MAR = 1'
- 6/12 line: MAR = 2'; 6/60 line: MAR = 10'
- LogMAR score = log₁₀(MAR)
| Snellen | MAR | LogMAR |
|---|---|---|
| 6/6 (20/20) | 1' | 0.00 |
| 6/7.5 (20/25) | 1.25' | 0.10 |
| 6/9.5 (20/32) | 1.58' | 0.20 |
| 6/12 (20/40) | 2' | 0.30 |
| 6/15 (20/50) | 2.5' | 0.40 |
| 6/19 (20/63) | 3.2' | 0.50 |
| 6/24 (20/80) | 4' | 0.60 |
| 6/30 (20/100) | 5' | 0.70 |
| 6/38 (20/125) | 6.3' | 0.80 |
| 6/48 (20/160) | 8' | 0.90 |
| 6/60 (20/200) | 10' | 1.00 |
| Better than 6/6 | <1' | Negative values (e.g. -0.10 = 6/4.8) |
Scoring: Each letter = 0.02 logMAR units (5 letters per line × 0.1 per line). Test continues until half the letters on a line are missed. This credits every individual correct letter.
Advantages over Snellen:
| Snellen Disadvantage | LogMAR Advantage |
|---|---|
| Unbalanced crowding effect | Equal letters per line controls crowding |
| Variable letter readability | Standardised letter readability |
| 6m testing distance needed | 4m distance (smaller room, no mirror) |
| Unsuitable for research | Gold standard for clinical trials |
| Simpler to use | More complex scoring |
3. LogMAR Chart Types
Bailey-Lovie Chart:
- Used at 6 m
- 5 letters per line, spacing proportional to letter size
- 6/6 letter = 5' height × 4' width
- Letter and row spacing based on letter dimensions
ETDRS Chart (Early Treatment Diabetic Retinopathy Study):
- Calibrated for 4 m
- Uses Sloan optotypes - equiluminous, equal legibility between letters and rows
- Square letters based on a 5×4 grid
- Standard in diabetic retinopathy and clinical trials
Special VA Tests
Pinhole (PH) Visual Acuity
A pinhole aperture (opaque occluder with 1 mm hole/s) compensates for refractive error by eliminating peripheral light rays.
- If VA < 6/6, repeat with pinhole
- PH VA improves → reduced VA is due to refractive error (correctable)
- PH VA does not improve (or worsens) → reduced VA is due to pathology (macular disease, posterior lens opacity, amblyopia)
Note: In patients with macular disease and posterior lens opacities, pinhole acuity may be worse than with spectacle correction.
Best-Corrected Visual Acuity (BCVA)
VA achieved with optimal refractive correction (determined by a full refraction, not just current glasses). BCVA is the clinical benchmark and defines the true functional level of the visual system.
Very Poor Visual Acuity - Grading Scale
When VA is too poor to read the chart, use the following hierarchy (from worse to better):
| Grade | Test | How |
|---|---|---|
| No perception of light (NPL) | Patient cannot detect any light | - |
| Perception of light (PL) | Detects pen torch light only | Can they localise which quadrant light comes from? (Tests if media opacity is the sole cause) |
| Hand movements (HM) | Distinguishes whether examiner's hand moves | Held just in front of patient |
| Counting fingers (CF) | Counts fingers held up | Usually at 1 metre; record distance |
| Low Snellen/logMAR | Chart-based measurement | If achievable |
Localising the direction of light in PL vision indicates the cause is a media opacity (e.g. dense cataract) rather than retinal/optic nerve disease.
Near Visual Acuity
Tested using near vision charts (logMAR or ETDRS versions) or a test-type book at a comfortable reading distance (measured and noted).
- Patient wears distance correction + presbyopia correction (reading glasses)
- Tested each eye separately, then both together
- Near vision is a sensitive indicator of macular disease (particularly useful for monitoring AMD, diabetic maculopathy)
Contrast Sensitivity
A separate but related aspect of visual function.
Principle: Measures the ability to distinguish an object against its background. A target must be both large enough and have sufficient contrast with its background. This tests low-contrast discrimination rather than high-contrast resolution (as on standard charts).
Clinical relevance:
- Standard VA charts use high-contrast optotypes; contrast sensitivity tests low-contrast function
- Conditions where contrast sensitivity is reduced with normal VA: amblyopia, optic neuropathy, certain cataracts, higher-order aberrations
- Useful when patients report visual symptoms (especially in dim light) but have good Snellen VA
Tests:
| Test | Method |
|---|---|
| Pelli-Robson chart | Viewed at 1 m; rows of equal-sized letters with decreasing contrast (0.15 log units per 3-letter group); patient reads until lowest-resolvable group |
| Sinusoidal (sine wave) gratings | Patient views increasingly lower-contrast gratings |
| SPARCS (Spaeth Richman) | Computer-based; 5-10 min per eye; tests both central and peripheral contrast sensitivity; usable in illiterate patients (grating-based) |
Amsler Grid - Macular Function Test
Tests the central 20° of the visual field centred on fixation. Principally used for macular disease screening and monitoring.
Indications:
- AMD monitoring (especially for macular neovascularisation / MNV)
- Macular oedema, central serous retinopathy
- Central visual field defects of any origin
Seven Amsler Charts:
| Chart | Design | Purpose |
|---|---|---|
| 1 | White grid on black; 400 × 5 mm squares (each = 1° at 33 cm) | Standard test |
| 2 | Diagonal lines added | Helps fixation in patients with central scotoma |
| 3 | Red squares | Detects colour scotomas; stimulates long-wavelength foveal cones (toxic maculopathy, optic neuropathy, chiasmal lesions) |
| 4 | Random dots only | Distinguishes scotoma from metamorphopsia (no form to distort) |
| 5 | Horizontal lines | Metamorphopsia along specific meridians; useful for reading difficulty |
| 6 | White background, closer lines | More detailed metamorphopsia evaluation |
| 7 | Fine central grid (each square = 0.5°) | More sensitive for early central changes |
Technique:
- Pupils NOT dilated (to avoid photostress effect)
- Do not examine on slit lamp beforehand
- Wear presbyopic correction if needed
- Chart well illuminated at ~33 cm
- Cover one eye
- Fix on the central dot
- Report any distortion (metamorphopsia), waviness, blank areas, or missing squares
Abnormal responses:
- Metamorphopsia (wavy/distorted lines) - macular disease
- Scotoma (blank area) - any cause
- Patients with macular disease often see the central dot only, with surrounding grid area missing
Photostress Test
Assesses macular function (dark adaptation recovery) and differentiates macular disease from optic nerve lesions.
Principle: Bright light bleaches visual pigment, causing temporary retinal insensitivity (a scotoma). Recovery speed depends on photoreceptor ability to re-synthesise visual pigment.
Technique:
- Record BCVA first
- Patient fixates on a pen torch held ~3 cm from the eye for ~10 seconds
- Photostress Recovery Time (PSRT) = time to re-read any 3 letters of the pre-test acuity line
Normal PSRT: 15-30 seconds
- Prolonged PSRT = macular disease (slow visual pigment regeneration)
- Normal PSRT = optic nerve lesion (photoreceptors intact)
Light Brightness Comparison Test
Tests optic nerve function (normal in early/moderate retinal disease).
Technique:
- Shine indirect ophthalmoscope light into the normal eye, then the diseased eye
- Ask if brightness is symmetric
- Patient rates the diseased eye on a 1-5 scale relative to the normal eye
Reduced brightness = optic neuropathy (not retinal disease)
Summary: VA Measurement Hierarchy
Distance VA (Snellen or LogMAR)
    ↓ If < 6/6
    Pinhole VA
        ↓ Improves → refractive error
        ↓ Doesn't improve → pathology
Near VA
    ↓ Sensitive for macular disease
Contrast Sensitivity
    ↓ Reduced with normal VA → amblyopia / optic neuropathy
Amsler Grid
    ↓ Metamorphopsia / scotoma → macular disease
Very poor VA scale: CF → HM → PL → NPL
Sources: Kanski's Clinical Ophthalmology: A Systematic Approach, 10th Ed., pp. 17-21 | Guyton & Hall Textbook of Medical Physiology, p. 627 | Ganong's Review of Medical Physiology, 26th Ed., p. 206
This is a shared conversation. Sign in to Orris to start your own chat.