
Write in detail about gene expression and gene mutations. Write in detail about DNA recombinant technology and its applications. Write in detail about gene therapy and RNA processing. Write in detail about MAPK signalling pathways in eukaryotic cells. Explain protein synthesis in detail.Explain the Ras–MAP kinase pathway and signal transduction through ion channels. these are the LAQs , so givde me exam oriented ans like topper and also add diagrams related to the tropics
Topic Breakdown
- Gene Expression and Gene Mutations — regulation of gene expression (prokaryotic/eukaryotic), types of mutations (point, frameshift, silent, missense, nonsense), causes and consequences, DNA repair
- Recombinant DNA Technology and Applications — restriction enzymes, vectors, cloning steps, PCR, applications in medicine/agriculture/industry
- Gene Therapy and RNA Processing — types of gene therapy (ex vivo/in vivo), vectors, examples (SCID, ADA deficiency); RNA processing (capping, splicing, polyadenylation, editing)
- MAPK Signalling Pathway in Eukaryotic Cells — ERK/JNK/p38 cascades, upstream activators, biological roles
- Protein Synthesis — transcription, translation (initiation, elongation, termination), post-translational modification
- Ras-MAP Kinase Pathway and Signal Transduction through Ion Channels — Ras activation cascade, ligand-gated/voltage-gated channels, second messengers
Brief Overview
Which LAQ topic should I write in full exam-oriented detail first (with diagrams)?
Topic Breakdown
- Gene Expression and Gene Mutations — regulation of gene expression (prokaryotic/eukaryotic), types of mutations (point, frameshift, silent, missense, nonsense), causes and consequences, DNA repair
- Recombinant DNA Technology and Applications — restriction enzymes, vectors, cloning steps, PCR, applications in medicine/agriculture/industry
- Gene Therapy and RNA Processing — types of gene therapy (ex vivo/in vivo), vectors, examples (SCID, ADA deficiency); RNA processing (capping, splicing, polyadenylation, editing)
- MAPK Signalling Pathway in Eukaryotic Cells — ERK/JNK/p38 cascades, upstream activators, biological roles
- Protein Synthesis — transcription, translation (initiation, elongation, termination), post-translational modification
- Ras-MAP Kinase Pathway and Signal Transduction through Ion Channels — Ras activation cascade, ligand-gated/voltage-gated channels, second messengers
Brief Overview
Quick answer
LAQ Answers — Molecular Biology & Cell Signalling (Exam-Oriented)
1. Gene Expression and Gene Mutations
A. Gene Expression
- Transcription — DNA → mRNA (in nucleus, by RNA polymerase)
- RNA processing — capping, splicing, polyadenylation (eukaryotes)
- Translation — mRNA → protein (on ribosomes)
- Post-translational modification — folding, glycosylation, phosphorylation
- Structural genes (lacZ, lacY, lacA) under control of a single promoter/operator
- Negative control: Repressor protein (lacI) binds operator, blocks RNA polymerase, in absence of lactose
- Induction: Allolactose binds repressor → repressor releases operator → transcription proceeds
- Positive control: CAP-cAMP complex enhances promoter binding when glucose is low (catabolite repression)
| Level | Mechanism |
|---|---|
| Chromatin level | Histone acetylation/methylation, DNA methylation (epigenetics) |
| Transcriptional | Promoters, enhancers, silencers, transcription factors |
| Post-transcriptional | Alternative splicing, RNA editing, miRNA/siRNA silencing |
| Translational | mRNA stability, initiation factor regulation |
| Post-translational | Protein modification, degradation (ubiquitin-proteasome) |
B. Gene Mutations
- Point mutation — single base pair change
- Substitution: one base replaced by another
- Silent mutation (no change in amino acid, due to codon degeneracy)
- Missense mutation (changes amino acid) — e.g., Sickle cell anemia (GAG→GTG, Glu→Val at position 6 of β-globin)
- Nonsense mutation (creates premature stop codon) — e.g., some β-thalassemias
- Frameshift mutation: insertion/deletion of bases not in multiples of 3, shifts reading frame downstream
- Substitution: one base replaced by another
- Spontaneous (replication errors, tautomeric shifts, depurination)
- Induced (chemical mutagens, radiation, UV light)
- Loss of function
- Gain of function
- Dominant negative
- Neutral/silent
- Physical: UV rays, X-rays, gamma rays
- Chemical: Nitrous acid, alkylating agents, base analogs (5-bromouracil), intercalating agents (ethidium bromide)
- Biological: Transposons, viruses
| Repair type | Mechanism | Defect disease |
|---|---|---|
| Base excision repair (BER) | Removes single damaged base | — |
| Nucleotide excision repair (NER) | Removes damaged nucleotide stretch (UV damage) | Xeroderma pigmentosum |
| Mismatch repair (MMR) | Corrects replication errors | Lynch syndrome (HNPCC) |
| Non-homologous end joining/Homologous recombination | Double strand break repair | BRCA1/2 mutations (breast/ovarian cancer) |
2. Recombinant DNA Technology and Its Applications
Steps involved (write as a flowchart for exam marks):
- Restriction endonucleases (e.g., EcoRI, BamHI, HindIII) cut DNA at specific palindromic sequences, producing "sticky ends"
- Plasmids (pBR322, pUC), bacteriophages (lambda), cosmids, Ti plasmid (in plants), viral vectors (adenovirus, retrovirus, AAV — for eukaryotic/gene therapy use)
- Vector must have: origin of replication, selectable marker (antibiotic resistance), multiple cloning site
- DNA ligase joins the foreign DNA fragment (insert) with the cut vector, forming recombinant DNA
- Recombinant DNA introduced into host cell (bacteria — E. coli; or eukaryotic cells) via:
- Heat shock/CaCl₂ method
- Electroporation
- Microinjection
- Gene gun (biolistic method)
- Viral vector-mediated transfer
- Using antibiotic resistance markers or blue-white screening (lacZ system)
- Colony hybridization, PCR-based screening
- Amplification of the gene, or expression of protein product
Polymerase Chain Reaction (PCR) — important allied technique
- In vitro amplification of DNA using:
- Template DNA
- Primers (forward/reverse)
- Taq DNA polymerase (thermostable)
- dNTPs
- Steps: Denaturation (94-96°C) → Annealing (50-65°C) → Extension (72°C) — repeated cycles (exponential amplification)
Applications of Recombinant DNA Technology
- Recombinant insulin (Humulin) — first rDNA product, produced in E. coli
- Human growth hormone (Somatotropin) for dwarfism
- Hepatitis B vaccine — recombinant surface antigen
- Factor VIII/IX for hemophilia
- Erythropoietin for anemia
- Monoclonal antibodies (trastuzumab, rituximab)
- Gene therapy vectors
- Diagnostic tools: DNA probes, PCR-based diagnosis (e.g., HIV, TB, COVID-19 RT-PCR)
- Bt cotton/Bt brinjal (pest resistance via Cry genes from Bacillus thuringiensis)
- Golden rice (Vitamin A enriched, beta-carotene pathway genes)
- Herbicide-resistant crops (Roundup Ready soybean)
- Flavr Savr tomato (delayed ripening)
- Enzyme production (proteases, amylases for detergents)
- Biofuel production
- DNA fingerprinting (RFLP, STR analysis) for paternity testing, criminal identification
- Gene knockout/knock-in studies
- Transgenic animal models (e.g., transgenic mice)
- CRISPR-Cas9 genome editing (modern extension of rDNA technology)
3. Gene Therapy and RNA Processing
A. Gene Therapy
- Germline gene therapy — modifies germ cells (sperm/egg); changes heritable; ethically controversial, not used clinically in humans
- Somatic gene therapy — modifies somatic cells; not heritable; clinically approved approach
- Ex vivo gene therapy: Cells removed from patient → gene inserted in vitro → modified cells reintroduced
- Example: ADA-SCID (Adenosine Deaminase deficiency - Severe Combined Immunodeficiency) — first successful gene therapy (1990, by W. French Anderson): lymphocytes withdrawn, functional ADA gene introduced via retroviral vector, reinfused
- In vivo gene therapy: Vector carrying therapeutic gene directly administered into patient's body
- Example: Luxturna (RPE65 gene, for inherited retinal dystrophy), Zolgensma (SMN1 gene for spinal muscular atrophy)
| Vector | Feature |
|---|---|
| Retrovirus | Integrates into host genome; used for dividing cells |
| Adenovirus | Non-integrating, strong immune response |
| Adeno-associated virus (AAV) | Low immunogenicity, widely used now |
| Lentivirus | Can infect non-dividing cells |
| Liposomes/Naked DNA | Non-viral, safer but less efficient |
- Gene augmentation (adding a normal copy of gene)
- Gene silencing (using antisense/siRNA to block defective gene)
- Gene editing (CRISPR-Cas9, to correct the mutation directly)
- Oncolytic virus therapy (for cancers)
B. RNA Processing (Post-transcriptional modification of pre-mRNA)
- Addition of 7-methylguanosine cap to the 5' end
- Function: Protects mRNA from degradation (5'→3' exonucleases), assists ribosome binding for translation initiation
- Removal of introns (non-coding intervening sequences) and joining of exons (coding sequences)
- Carried out by the spliceosome — a complex of snRNPs (U1, U2, U4, U5, U6 small nuclear RNAs + proteins)
- Mechanism: recognizes GU (5' splice site) and AG (3' splice site) consensus sequences, forms a lariat structure, cuts and ligates exons
- Alternative splicing: different combinations of exons joined → multiple protein isoforms from a single gene (major source of proteome diversity)
- Cleavage downstream of AAUAAA signal sequence
- Addition of ~200 adenine residues (poly-A tail) by poly-A polymerase
- Function: mRNA stability, export from nucleus, translation efficiency
- RNA editing — post-transcriptional alteration of RNA sequence (e.g., ApoB mRNA editing, ADAR enzymes converting A→I)
- RNA interference (RNAi) — siRNA/miRNA-mediated silencing of gene expression
4. MAPK Signalling Pathway in Eukaryotic Cells
General Architecture (three-tier kinase cascade):
Extracellular signal (growth factor)
        ↓
Receptor (RTK) activation
        ↓
MAPKKK (MAP kinase kinase kinase) — e.g., Raf
        ↓ (phosphorylates)
MAPKK (MAP kinase kinase) — e.g., MEK
        ↓ (phosphorylates on Thr and Tyr)
MAPK (MAP kinase) — e.g., ERK
        ↓
Nuclear translocation → Transcription factor activation → Gene expression
Major MAPK sub-families:
| Pathway | Activated by | Key kinases | Main outcome |
|---|---|---|---|
| ERK1/2 (classical) | Growth factors (EGF, PDGF) via RTK-Ras | Raf → MEK1/2 → ERK1/2 | Cell proliferation, differentiation |
| JNK (SAPK) | Stress, UV, cytokines (TNF, IL-1) | MEKK → MKK4/7 → JNK | Apoptosis, inflammation |
| p38 MAPK | Osmotic stress, inflammatory cytokines | MEKK → MKK3/6 → p38 | Inflammation, apoptosis, stress response |
Mechanism of activation (ERK pathway as prototype):
- Growth factor binds Receptor Tyrosine Kinase (RTK) → receptor dimerization and autophosphorylation
- Adaptor protein Grb2 binds phosphotyrosine residues
- Grb2 recruits SOS (guanine nucleotide exchange factor)
- SOS activates Ras (GDP → GTP exchange)
- Ras-GTP activates Raf (MAPKKK)
- Raf phosphorylates and activates MEK (MAPKK)
- MEK phosphorylates ERK (MAPK) on both threonine and tyrosine residues
- Activated ERK translocates to nucleus, phosphorylates transcription factors (Elk-1, c-Fos, c-Myc)
- Gene transcription → cell cycle progression, proliferation
- Mutated Ras (oncogene, e.g., KRAS in pancreatic/colorectal cancer) or BRAF (V600E mutation in melanoma) causes constitutive MAPK activation → uncontrolled proliferation → cancer
- Targeted drugs: Vemurafenib (BRAF inhibitor), Trametinib (MEK inhibitor)
5. Protein Synthesis (Translation) — Detailed
Requirements:
- mRNA (template)
- Ribosomes (70S in prokaryotes: 30S+50S; 80S in eukaryotes: 40S+60S)
- tRNA (adaptor molecules, charged with amino acids)
- Aminoacyl-tRNA synthetases (charge tRNA with correct amino acid — ATP dependent)
- Initiation, elongation, release factors
- GTP, Mg²⁺
Steps of Translation:
- Amino acid + ATP + tRNA → aminoacyl-tRNA (charged tRNA) + AMP + PPi (catalyzed by aminoacyl-tRNA synthetase — high specificity/proofreading step)
- Small ribosomal subunit binds mRNA at 5' cap (eukaryotes) or Shine-Dalgarno sequence (prokaryotes)
- Initiator tRNA (Met-tRNA in eukaryotes, fMet-tRNA in prokaryotes) pairs with start codon (AUG)
- Initiation factors (eIFs in eukaryotes, IFs in prokaryotes) mediate assembly
- Large ribosomal subunit joins → forms complete initiation complex with initiator tRNA in P site
- Codon recognition: Aminoacyl-tRNA (matching next codon) enters A site, assisted by elongation factor (EF-Tu/eEF1, GTP-dependent)
- Peptide bond formation: Peptidyl transferase (a ribozyme activity of large rRNA) catalyzes bond between amino acid in A site and growing peptide chain in P site
- Translocation: Ribosome moves one codon (3 nucleotides) along mRNA (5'→3'), catalyzed by EF-G/eEF2 (GTP-dependent); tRNA shifts from A→P→E sites, empty tRNA exits from E site
- Stop codon (UAA, UAG, UGA) enters A site — no corresponding tRNA
- Release factors (RF1/RF2/RF3 in prokaryotes; eRF1/eRF3 in eukaryotes) bind
- Peptidyl transferase hydrolyzes bond between polypeptide and tRNA → releases polypeptide
- Ribosomal subunits dissociate
- Folding (chaperones — Hsp70, chaperonins)
- Cleavage of signal peptides
- Glycosylation, phosphorylation, disulfide bond formation, ubiquitination
- Targeting to organelles (via signal sequences, e.g., ER, mitochondria, nucleus)
Key features to mention for marks:
- Genetic code is triplet, degenerate, non-overlapping, nearly universal, unambiguous
- Polysome/Polyribosome: multiple ribosomes translating same mRNA simultaneously — increases efficiency
- Wobble hypothesis: explains degeneracy — third codon base pairing is flexible
6. Ras-MAP Kinase Pathway and Signal Transduction through Ion Channels
A. Ras-MAP Kinase Pathway (detailed mechanism — expands on Topic 4)
- Ligand binding: Growth factor (e.g., EGF) binds extracellular domain of Receptor Tyrosine Kinase (RTK)
- Receptor dimerization and trans-autophosphorylation of intracellular tyrosine residues
- Adaptor recruitment: Grb2 (via SH2 domain) binds phosphotyrosines
- GEF recruitment: Grb2 (via SH3 domain) recruits SOS (Son of Sevenless — a Guanine nucleotide Exchange Factor)
- Ras activation: SOS catalyzes exchange of GDP for GTP on Ras → Ras-GTP (active form)
- Ras-GTP activates Raf (serine/threonine kinase, MAPKKK) by recruiting it to the membrane
- Raf phosphorylates MEK (MAPKK)
- MEK phosphorylates ERK (MAPK) on Thr and Tyr residues (dual phosphorylation)
- ERK dimerizes, translocates to nucleus
- Phosphorylates transcription factors (Elk-1, c-Fos, c-Jun, c-Myc) → activates immediate early genes → cell proliferation, differentiation, survival
- Oncogenic RAS mutations (point mutations at codons 12, 13, 61) impair GAP-mediated GTP hydrolysis → Ras locked in active GTP-bound state → constitutive proliferative signaling → found in ~30% of human cancers (pancreatic, colorectal, lung)
- This pathway is a major target for anticancer drug development
B. Signal Transduction through Ion Channels
- Channel opens directly upon neurotransmitter binding (no second messenger needed)
- Examples:
- Nicotinic acetylcholine receptor — cation channel (Na⁺/K⁺), opens on ACh binding → depolarization → muscle contraction
- GABA-A receptor — Cl⁻ channel, opens on GABA binding → hyperpolarization → inhibitory neurotransmission
- Glutamate receptors (NMDA, AMPA) — cation channels, excitatory transmission
- Open/close in response to changes in membrane potential
- Examples: Voltage-gated Na⁺ channels (action potential generation/upstroke), voltage-gated K⁺ channels (repolarization), voltage-gated Ca²⁺ channels (neurotransmitter release, muscle contraction, second messenger generation)
- Indirect gating: GPCR activation → G-protein → second messenger (cAMP, IP3, DAG) → modulates channel
- Example: cGMP-gated channels in retinal rod cells (phototransduction); cardiac muscarinic K⁺ channels via Gβγ subunits
- Action potential reaches presynaptic terminal
- Voltage-gated Ca²⁺ channels open → Ca²⁺ influx
- Ca²⁺ triggers synaptic vesicle fusion → ACh release into synaptic cleft
- ACh binds nicotinic receptor (ligand-gated Na⁺/K⁺ channel) on postsynaptic membrane
- Conformational change opens channel → Na⁺ influx (net) → depolarization (End Plate Potential)
- If threshold reached → voltage-gated Na⁺ channels open → action potential propagates → muscle contraction
- Extremely rapid response (milliseconds vs seconds-minutes for GPCR/RTK pathways)
- Directly converts chemical signal into electrical signal
- No amplification via enzymatic cascade (unlike GPCR/second messenger systems) — a direct structural change
Exam tip summary
gene mutation types point mutation frameshift diagram
recombinant DNA technology cloning steps diagram plasmid vector
RNA processing pre-mRNA splicing capping polyadenylation diagram
MAPK signaling pathway cascade diagram Ras Raf MEK ERK
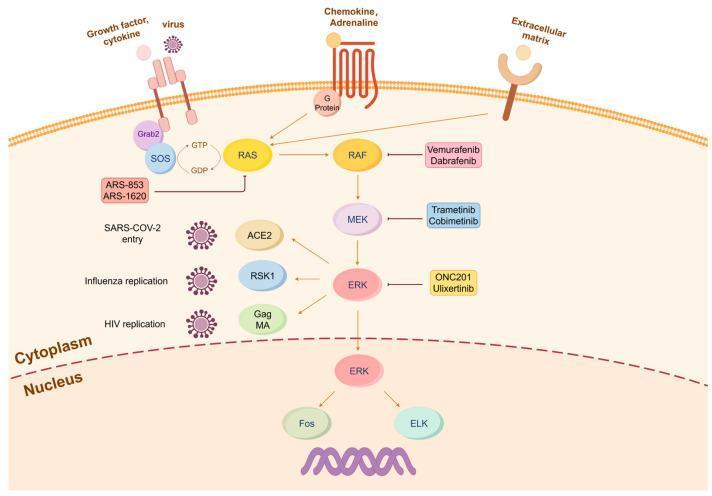
A pathophysiology diagram illustrating the canonical MAPK/ERK signaling pathway and its exploitation by viral pathogens. The diagram shows the cell membrane with various receptors, including Receptor Tyrosine Kinases (RTK) and G-protein coupled receptors (GPCR), responding to growth factors, cytokines, chemokines, and viruses. The intracellular signaling cascade initiates with Grb2 and SOS facilitating the transition of RAS-GDP to RAS-GTP. The signal proceeds through a sequential phosphorylation relay of RAF, MEK, and ERK. Activated ERK translocates from the cytoplasm to the nucleus, where it activates transcription factors Fos and ELK to influence gene expression. The diagram highlights points of viral interference: SARS-CoV-2 entry via ACE2, influenza replication utilizing RSK1, and HIV replication involving Gag MA, all linked to downstream ERK components. Key pharmacological inhibitors for potential therapeutic repurposing are noted, including Vemurafenib/Dabrafenib (RAF), Trametinib/Cobimetinib (MEK), and ONC201/Ulixertinib (ERK), alongside RAS inhibitors like ARS-853.
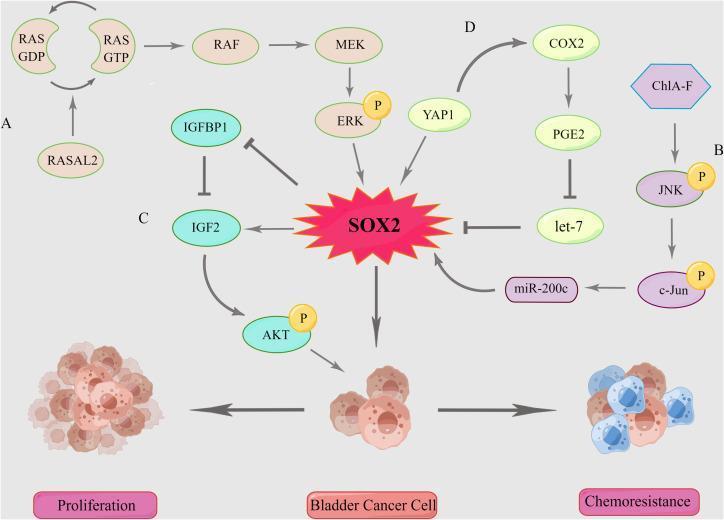
This pathophysiology diagram illustrates the complex signaling network involving SOX2 in bladder cancer cells, highlighting its role in tumor proliferation and chemoresistance. The diagram is divided into four main regulatory pathways: (A) The MAPK/ERK pathway, showing the RAS-RAF-MEK-ERK cascade where active RAS-GTP leads to ERK phosphorylation (pERK) and subsequent SOX2 activation, regulated by RASAL2. (B) The MAPK/JNK pathway, where ChlA-F triggers JNK and c-Jun phosphorylation, modulating SOX2 via miR-200c. (C) The SOX2-IGF2-AKT axis, demonstrating a positive feedback loop where SOX2 promotes IGF2 expression (inhibiting IGFBP1), which then activates AKT via phosphorylation (pAKT). (D) The COX2/PGE2 and YAP1 pathways, showing YAP1 directly activating SOX2 and COX2, while the COX2-PGE2 axis inhibits let-7, a microRNA that typically represses SOX2. Centrally, SOX2 acts as a master transcription factor that drives the transformation of bladder cancer cells into phenotypes characterized by rapid proliferation and enhanced chemoresistance.
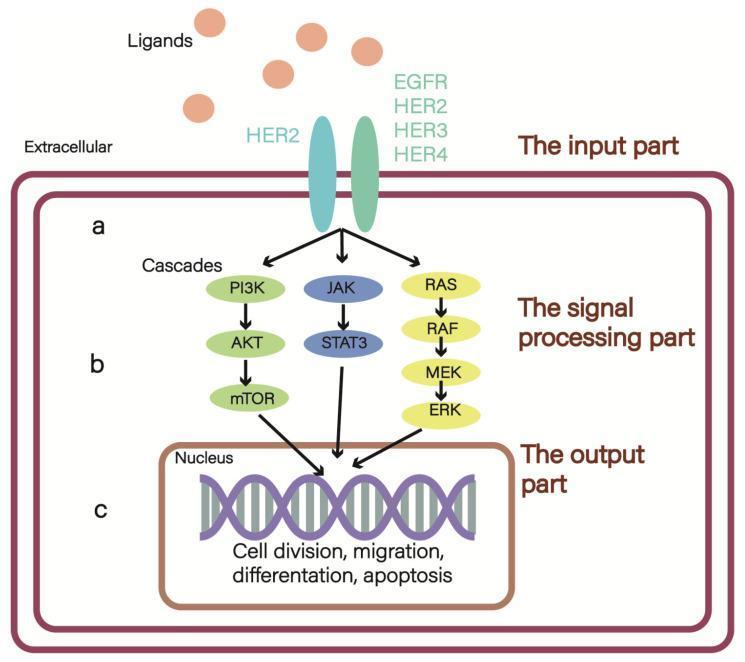
A pathophysiology diagram illustrating the ErbB/HER2 signaling network, organized into three functional sections: input, signal processing, and output. (a) The input part shows extracellular ligands binding to transmembrane ErbB receptors (EGFR, HER2, HER3, and HER4), highlighting the role of HER2 heterodimers. (b) The signal processing part depicts three vertical intracellular signaling cascades: the PI3K/AKT/mTOR pathway (green), the JAK/STAT3 pathway (blue), and the RAS/RAF/MEK/ERK (MAPK) pathway (yellow). Each cascade follows a downward flow of activation. (c) The output part shows these pathways converging on the cell nucleus, represented by a DNA double helix. This section indicates downstream cellular effects including cell division, migration, differentiation, and apoptosis. This schematic provides a clinical overview of how HER2 overexpression drives tumorigenic processes and drug resistance mechanisms in cancers such as invasive breast cancer.
protein synthesis translation ribosome mRNA diagram initiation elongation termination
ion channel signal transduction ligand gated voltage gated diagram
gene therapy vector viral delivery diagram
![This medical schematic illustrates a non-viral transposon-mediated gene therapy system, detailing the mechanisms of delivery, excision, and chromosomal integration. The diagram identifies two primary vector configurations: 'trans' delivery, involving two separate plasmids (one for the therapeutic gene of interest [GOI] and another for the transposase enzyme), and 'cis' delivery, where both components are housed on a single plasmid. Key molecular components include the GOI (green arrow), an upstream promoter (orange box), and flanking Inverted Terminal Repeats (ITRs, red circles). The educational focus highlights the three-step 'cut and paste' mechanism: (1) Nonviral delivery of the DNA vector into the target cell nucleus; (2) Excision of the transposon cassette by the transposase enzyme (blue) at the ITR recognition sites; and (3) Site-specific chromosomal integration into the host's genomic DNA, specifically targeting TTAA-rich sites. This process demonstrates a method for stable transgene insertion in human regenerative medicine and oncology applications, emphasizing a bi-component DNA vector system as an alternative to viral-mediated delivery.](https://cdn.orris.care/cdss_images/pmc_clinical_VQA_4fe1b4ac5b86941a71c26ada6e54290a1cb05f89b524d5e00b55589513b11f27.jpg)
This medical schematic illustrates a non-viral transposon-mediated gene therapy system, detailing the mechanisms of delivery, excision, and chromosomal integration. The diagram identifies two primary vector configurations: 'trans' delivery, involving two separate plasmids (one for the therapeutic gene of interest [GOI] and another for the transposase enzyme), and 'cis' delivery, where both components are housed on a single plasmid. Key molecular components include the GOI (green arrow), an upstream promoter (orange box), and flanking Inverted Terminal Repeats (ITRs, red circles). The educational focus highlights the three-step 'cut and paste' mechanism: (1) Nonviral delivery of the DNA vector into the target cell nucleus; (2) Excision of the transposon cassette by the transposase enzyme (blue) at the ITR recognition sites; and (3) Site-specific chromosomal integration into the host's genomic DNA, specifically targeting TTAA-rich sites. This process demonstrates a method for stable transgene insertion in human regenerative medicine and oncology applications, emphasizing a bi-component DNA vector system as an alternative to viral-mediated delivery.
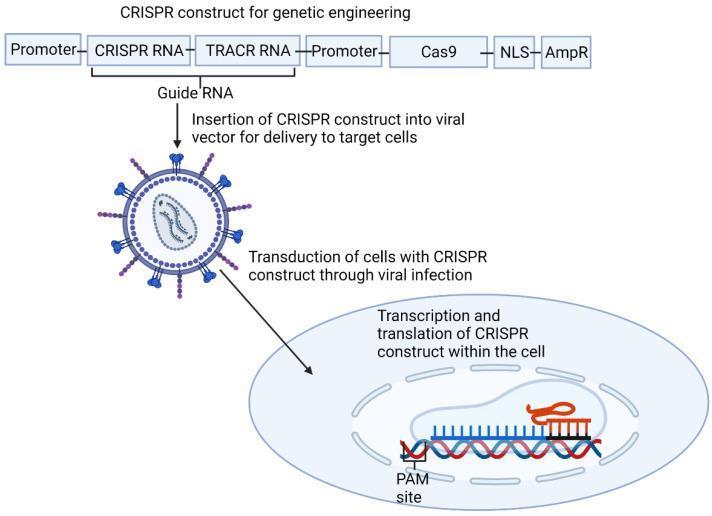
This pathophysiology diagram illustrates the process of genetic engineering using the Type II CRISPR-Cas9 system. The top section displays a linear CRISPR construct containing, from left to right: a Promoter, CRISPR RNA and TRACR RNA (collectively labeled as Guide RNA), a second Promoter, the Cas9 nuclease gene, a Nuclear Localization Signal (NLS), and an Ampicillin Resistance (AmpR) marker. The diagram follows the workflow of inserting this construct into a viral vector, which is depicted as a spherical particle with surface proteins. The central section shows the transduction phase, where the viral vector infects a target cell to deliver the genetic material. The final section demonstrates the intracellular outcome: transcription and translation of the construct followed by the localized action of the CRISPR-Cas9 complex on the host genome. A specific interaction is highlighted where the complex identifies a Protospacer Adjacent Motif (PAM) site to facilitate precise DNA cleavage. This educational resource is designed to teach mechanisms of gene therapy, viral delivery systems, and precision molecular biology.
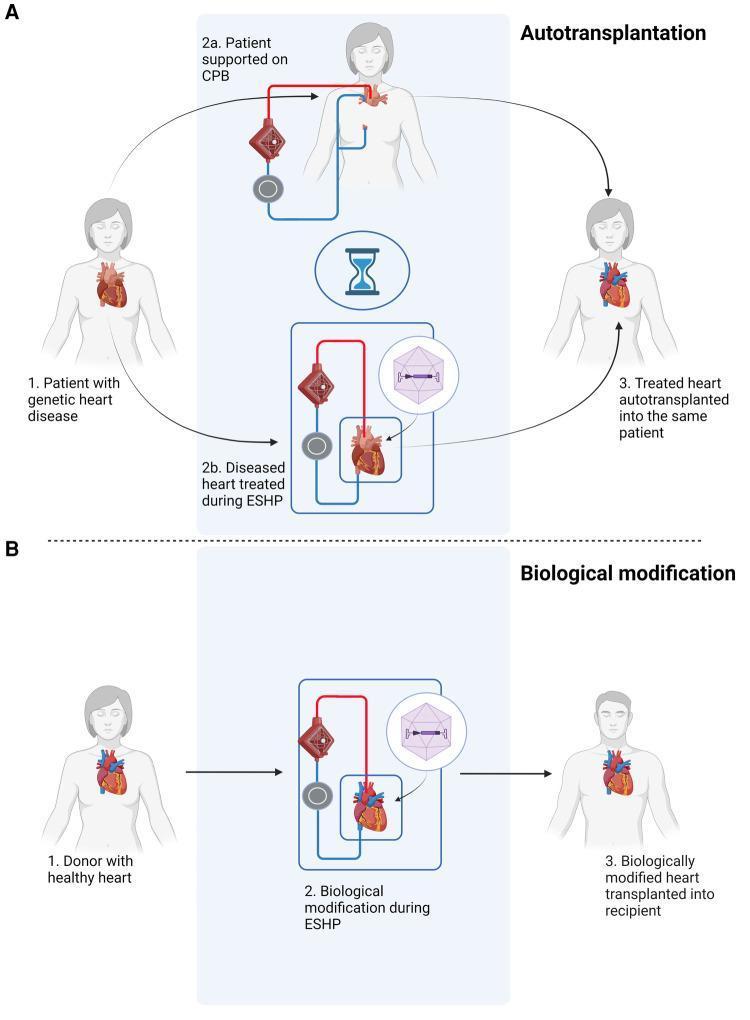
This medical schematic illustrates two clinical pathways for gene therapy application during ex situ heart perfusion (ESHP). Pathway A depicts autotransplantation for genetic heart disease. It shows a sequence where a diseased heart is removed for ESHP treatment, during which the patient is supported by a cardiopulmonary bypass (CPB) circuit. The ESHP phase highlights the use of viral vectors (represented by icosahedral icons) for targeted gene editing before the treated organ is autotransplanted back into the same patient. Pathway B illustrates biological modification for orthotopic heart transplantation. A healthy donor heart undergoes ESHP for immunomodulation or physiological enhancement—again using viral vector delivery—prior to transplantation into a recipient. Both pathways utilize a perfusion circuit consisting of a pump and an oxygenator to maintain organ viability ex situ. This diagram emphasizes the clinical potential of ESHP as a controlled environment for localized cardiovascular gene therapy and organ optimization in transplant medicine.
DNA replication transcription translation central dogma diagram
restriction enzyme plasmid cloning vector bacteria
ribosome mRNA tRNA translation elongation cycle
A labeled scientific diagram showing types of gene mutations: silent, missense, nonsense, and frameshift mutations, comparing normal DNA/mRNA/protein sequence to mutated sequences
A labeled diagram showing steps of recombinant DNA technology: isolation of gene of interest, cutting with restriction enzyme, insertion into plasmid vector with ligase, transformation into host bacterial cell, and cloning
A labeled diagram of eukaryotic RNA processing showing pre-mRNA with introns and exons, 5' capping, splicing by spliceosome removing introns, and 3' polyadenylation to form mature mRNA
A labeled diagram of protein synthesis translation showing ribosome moving along mRNA with tRNA bringing amino acids, initiation, elongation with growing polypeptide chain, and termination at stop codon
A labeled diagram of signal transduction through ion channels in a cell membrane, showing a ligand-gated ion channel opening upon neurotransmitter binding and a voltage-gated ion channel opening upon membrane depolarization, with ion flow across the membrane
Topic Breakdown
- Gene Expression and Gene Mutations — regulation of gene expression (prokaryotic/eukaryotic), types of mutations (point, frameshift, silent, missense, nonsense), causes and consequences, DNA repair
- Recombinant DNA Technology and Applications — restriction enzymes, vectors, cloning steps, PCR, applications in medicine/agriculture/industry
- Gene Therapy and RNA Processing — types of gene therapy (ex vivo/in vivo), vectors, examples (SCID, ADA deficiency); RNA processing (capping, splicing, polyadenylation, editing)
- MAPK Signalling Pathway in Eukaryotic Cells — ERK/JNK/p38 cascades, upstream activators, biological roles
- Protein Synthesis — transcription, translation (initiation, elongation, termination), post-translational modification
- Ras-MAP Kinase Pathway and Signal Transduction through Ion Channels — Ras activation cascade, ligand-gated/voltage-gated channels, second messengers
Brief Overview
1. Gene Expression and Gene Mutations
A. Gene Expression
- Transcription — DNA → mRNA (in nucleus, by RNA polymerase)
- RNA processing — capping, splicing, polyadenylation (eukaryotes)
- Translation — mRNA → protein (on ribosomes)
- Post-translational modification — folding, glycosylation, phosphorylation
- Structural genes (lacZ, lacY, lacA) under control of a single promoter/operator
- Negative control: Repressor protein (lacI) binds operator, blocks RNA polymerase, in absence of lactose
- Induction: Allolactose binds repressor → repressor releases operator → transcription proceeds
- Positive control: CAP-cAMP complex enhances promoter binding when glucose is low (catabolite repression)
| Level | Mechanism |
|---|---|
| Chromatin level | Histone acetylation/methylation, DNA methylation (epigenetics) |
| Transcriptional | Promoters, enhancers, silencers, transcription factors |
| Post-transcriptional | Alternative splicing, RNA editing, miRNA/siRNA silencing |
| Translational | mRNA stability, initiation factor regulation |
| Post-translational | Protein modification, degradation (ubiquitin-proteasome) |
B. Gene Mutations
- Point mutation — single base pair change
- Substitution: one base replaced by another
- Silent mutation (no change in amino acid, due to codon degeneracy)
- Missense mutation (changes amino acid) — e.g., Sickle cell anemia (GAG→GTG, Glu→Val at position 6 of β-globin)
- Nonsense mutation (creates premature stop codon) — e.g., some β-thalassemias
- Frameshift mutation: insertion/deletion of bases not in multiples of 3, shifts reading frame downstream
- Substitution: one base replaced by another
- Spontaneous (replication errors, tautomeric shifts, depurination)
- Induced (chemical mutagens, radiation, UV light)
- Loss of function
- Gain of function
- Dominant negative
- Neutral/silent
- Physical: UV rays, X-rays, gamma rays
- Chemical: Nitrous acid, alkylating agents, base analogs (5-bromouracil), intercalating agents (ethidium bromide)
- Biological: Transposons, viruses
| Repair type | Mechanism | Defect disease |
|---|---|---|
| Base excision repair (BER) | Removes single damaged base | — |
| Nucleotide excision repair (NER) | Removes damaged nucleotide stretch (UV damage) | Xeroderma pigmentosum |
| Mismatch repair (MMR) | Corrects replication errors | Lynch syndrome (HNPCC) |
| Non-homologous end joining/Homologous recombination | Double strand break repair | BRCA1/2 mutations (breast/ovarian cancer) |
2. Recombinant DNA Technology and Its Applications
Steps involved (write as a flowchart for exam marks):
- Restriction endonucleases (e.g., EcoRI, BamHI, HindIII) cut DNA at specific palindromic sequences, producing "sticky ends"
- Plasmids (pBR322, pUC), bacteriophages (lambda), cosmids, Ti plasmid (in plants), viral vectors (adenovirus, retrovirus, AAV — for eukaryotic/gene therapy use)
- Vector must have: origin of replication, selectable marker (antibiotic resistance), multiple cloning site
- DNA ligase joins the foreign DNA fragment (insert) with the cut vector, forming recombinant DNA
- Recombinant DNA introduced into host cell (bacteria — E. coli; or eukaryotic cells) via:
- Heat shock/CaCl₂ method
- Electroporation
- Microinjection
- Gene gun (biolistic method)
- Viral vector-mediated transfer
- Using antibiotic resistance markers or blue-white screening (lacZ system)
- Colony hybridization, PCR-based screening
- Amplification of the gene, or expression of protein product
Polymerase Chain Reaction (PCR) — important allied technique
- In vitro amplification of DNA using:
- Template DNA
- Primers (forward/reverse)
- Taq DNA polymerase (thermostable)
- dNTPs
- Steps: Denaturation (94-96°C) → Annealing (50-65°C) → Extension (72°C) — repeated cycles (exponential amplification)
Applications of Recombinant DNA Technology
- Recombinant insulin (Humulin) — first rDNA product, produced in E. coli
- Human growth hormone (Somatotropin) for dwarfism
- Hepatitis B vaccine — recombinant surface antigen
- Factor VIII/IX for hemophilia
- Erythropoietin for anemia
- Monoclonal antibodies (trastuzumab, rituximab)
- Gene therapy vectors
- Diagnostic tools: DNA probes, PCR-based diagnosis (e.g., HIV, TB, COVID-19 RT-PCR)
- Bt cotton/Bt brinjal (pest resistance via Cry genes from Bacillus thuringiensis)
- Golden rice (Vitamin A enriched, beta-carotene pathway genes)
- Herbicide-resistant crops (Roundup Ready soybean)
- Flavr Savr tomato (delayed ripening)
- Enzyme production (proteases, amylases for detergents)
- Biofuel production
- DNA fingerprinting (RFLP, STR analysis) for paternity testing, criminal identification
- Gene knockout/knock-in studies
- Transgenic animal models (e.g., transgenic mice)
- CRISPR-Cas9 genome editing (modern extension of rDNA technology)
3. Gene Therapy and RNA Processing
A. Gene Therapy
- Germline gene therapy — modifies germ cells (sperm/egg); changes heritable; ethically controversial, not used clinically in humans
- Somatic gene therapy — modifies somatic cells; not heritable; clinically approved approach
- Ex vivo gene therapy: Cells removed from patient → gene inserted in vitro → modified cells reintroduced
- Example: ADA-SCID (Adenosine Deaminase deficiency - Severe Combined Immunodeficiency) — first successful gene therapy (1990, by W. French Anderson): lymphocytes withdrawn, functional ADA gene introduced via retroviral vector, reinfused
- In vivo gene therapy: Vector carrying therapeutic gene directly administered into patient's body
- Example: Luxturna (RPE65 gene, for inherited retinal dystrophy), Zolgensma (SMN1 gene for spinal muscular atrophy)
| Vector | Feature |
|---|---|
| Retrovirus | Integrates into host genome; used for dividing cells |
| Adenovirus | Non-integrating, strong immune response |
| Adeno-associated virus (AAV) | Low immunogenicity, widely used now |
| Lentivirus | Can infect non-dividing cells |
| Liposomes/Naked DNA | Non-viral, safer but less efficient |
- Gene augmentation (adding a normal copy of gene)
- Gene silencing (using antisense/siRNA to block defective gene)
- Gene editing (CRISPR-Cas9, to correct the mutation directly)
- Oncolytic virus therapy (for cancers)
B. RNA Processing (Post-transcriptional modification of pre-mRNA)
- Addition of 7-methylguanosine cap to the 5' end
- Function: Protects mRNA from degradation (5'→3' exonucleases), assists ribosome binding for translation initiation
- Removal of introns (non-coding intervening sequences) and joining of exons (coding sequences)
- Carried out by the spliceosome — a complex of snRNPs (U1, U2, U4, U5, U6 small nuclear RNAs + proteins)
- Mechanism: recognizes GU (5' splice site) and AG (3' splice site) consensus sequences, forms a lariat structure, cuts and ligates exons
- Alternative splicing: different combinations of exons joined → multiple protein isoforms from a single gene (major source of proteome diversity)
- Cleavage downstream of AAUAAA signal sequence
- Addition of ~200 adenine residues (poly-A tail) by poly-A polymerase
- Function: mRNA stability, export from nucleus, translation efficiency
- RNA editing — post-transcriptional alteration of RNA sequence (e.g., ApoB mRNA editing, ADAR enzymes converting A→I)
- RNA interference (RNAi) — siRNA/miRNA-mediated silencing of gene expression
4. MAPK Signalling Pathway in Eukaryotic Cells
General Architecture (three-tier kinase cascade):
Extracellular signal (growth factor)
        ↓
Receptor (RTK) activation
        ↓
MAPKKK (MAP kinase kinase kinase) — e.g., Raf
        ↓ (phosphorylates)
MAPKK (MAP kinase kinase) — e.g., MEK
        ↓ (phosphorylates on Thr and Tyr)
MAPK (MAP kinase) — e.g., ERK
        ↓
Nuclear translocation → Transcription factor activation → Gene expression
Major MAPK sub-families:
| Pathway | Activated by | Key kinases | Main outcome |
|---|---|---|---|
| ERK1/2 (classical) | Growth factors (EGF, PDGF) via RTK-Ras | Raf → MEK1/2 → ERK1/2 | Cell proliferation, differentiation |
| JNK (SAPK) | Stress, UV, cytokines (TNF, IL-1) | MEKK → MKK4/7 → JNK | Apoptosis, inflammation |
| p38 MAPK | Osmotic stress, inflammatory cytokines | MEKK → MKK3/6 → p38 | Inflammation, apoptosis, stress response |
Mechanism of activation (ERK pathway as prototype):
- Growth factor binds Receptor Tyrosine Kinase (RTK) → receptor dimerization and autophosphorylation
- Adaptor protein Grb2 binds phosphotyrosine residues
- Grb2 recruits SOS (guanine nucleotide exchange factor)
- SOS activates Ras (GDP → GTP exchange)
- Ras-GTP activates Raf (MAPKKK)
- Raf phosphorylates and activates MEK (MAPKK)
- MEK phosphorylates ERK (MAPK) on both threonine and tyrosine residues
- Activated ERK translocates to nucleus, phosphorylates transcription factors (Elk-1, c-Fos, c-Myc)
- Gene transcription → cell cycle progression, proliferation
- Mutated Ras (oncogene, e.g., KRAS in pancreatic/colorectal cancer) or BRAF (V600E mutation in melanoma) causes constitutive MAPK activation → uncontrolled proliferation → cancer
- Targeted drugs: Vemurafenib (BRAF inhibitor), Trametinib (MEK inhibitor)
5. Protein Synthesis (Translation) — Detailed
Requirements:
- mRNA (template)
- Ribosomes (70S in prokaryotes: 30S+50S; 80S in eukaryotes: 40S+60S)
- tRNA (adaptor molecules, charged with amino acids)
- Aminoacyl-tRNA synthetases (charge tRNA with correct amino acid — ATP dependent)
- Initiation, elongation, release factors
- GTP, Mg²⁺
Steps of Translation:
- Amino acid + ATP + tRNA → aminoacyl-tRNA (charged tRNA) + AMP + PPi (catalyzed by aminoacyl-tRNA synthetase — high specificity/proofreading step)
- Small ribosomal subunit binds mRNA at 5' cap (eukaryotes) or Shine-Dalgarno sequence (prokaryotes)
- Initiator tRNA (Met-tRNA in eukaryotes, fMet-tRNA in prokaryotes) pairs with start codon (AUG)
- Initiation factors (eIFs in eukaryotes, IFs in prokaryotes) mediate assembly
- Large ribosomal subunit joins → forms complete initiation complex with initiator tRNA in P site
- Codon recognition: Aminoacyl-tRNA (matching next codon) enters A site, assisted by elongation factor (EF-Tu/eEF1, GTP-dependent)
- Peptide bond formation: Peptidyl transferase (a ribozyme activity of large rRNA) catalyzes bond between amino acid in A site and growing peptide chain in P site
- Translocation: Ribosome moves one codon (3 nucleotides) along mRNA (5'→3'), catalyzed by EF-G/eEF2 (GTP-dependent); tRNA shifts from A→P→E sites, empty tRNA exits from E site
- Stop codon (UAA, UAG, UGA) enters A site — no corresponding tRNA
- Release factors (RF1/RF2/RF3 in prokaryotes; eRF1/eRF3 in eukaryotes) bind
- Peptidyl transferase hydrolyzes bond between polypeptide and tRNA → releases polypeptide
- Ribosomal subunits dissociate
- Folding (chaperones — Hsp70, chaperonins)
- Cleavage of signal peptides
- Glycosylation, phosphorylation, disulfide bond formation, ubiquitination
- Targeting to organelles (via signal sequences, e.g., ER, mitochondria, nucleus)
Key features to mention for marks:
- Genetic code is triplet, degenerate, non-overlapping, nearly universal, unambiguous
- Polysome/Polyribosome: multiple ribosomes translating same mRNA simultaneously — increases efficiency
- Wobble hypothesis: explains degeneracy — third codon base pairing is flexible
6. Ras-MAP Kinase Pathway and Signal Transduction through Ion Channels
A. Ras-MAP Kinase Pathway (detailed mechanism — expands on Topic 4)
- Ligand binding: Growth factor (e.g., EGF) binds extracellular domain of Receptor Tyrosine Kinase (RTK)
- Receptor dimerization and trans-autophosphorylation of intracellular tyrosine residues
- Adaptor recruitment: Grb2 (via SH2 domain) binds phosphotyrosines
- GEF recruitment: Grb2 (via SH3 domain) recruits SOS (Son of Sevenless — a Guanine nucleotide Exchange Factor)
- Ras activation: SOS catalyzes exchange of GDP for GTP on Ras → Ras-GTP (active form)
- Ras-GTP activates Raf (serine/threonine kinase, MAPKKK) by recruiting it to the membrane
- Raf phosphorylates MEK (MAPKK)
- MEK phosphorylates ERK (MAPK) on Thr and Tyr residues (dual phosphorylation)
- ERK dimerizes, translocates to nucleus
- Phosphorylates transcription factors (Elk-1, c-Fos, c-Jun, c-Myc) → activates immediate early genes → cell proliferation, differentiation, survival
- Oncogenic RAS mutations (point mutations at codons 12, 13, 61) impair GAP-mediated GTP hydrolysis → Ras locked in active GTP-bound state → constitutive proliferative signaling → found in ~30% of human cancers (pancreatic, colorectal, lung)
- This pathway is a major target for anticancer drug development
B. Signal Transduction through Ion Channels
- Channel opens directly upon neurotransmitter binding (no second messenger needed)
- Examples:
- Nicotinic acetylcholine receptor — cation channel (Na⁺/K⁺), opens on ACh binding → depolarization → muscle contraction
- GABA-A receptor — Cl⁻ channel, opens on GABA binding → hyperpolarization → inhibitory neurotransmission
- Glutamate receptors (NMDA, AMPA) — cation channels, excitatory transmission
- Open/close in response to changes in membrane potential
- Examples: Voltage-gated Na⁺ channels (action potential generation/upstroke), voltage-gated K⁺ channels (repolarization), voltage-gated Ca²⁺ channels (neurotransmitter release, muscle contraction, second messenger generation)
- Indirect gating: GPCR activation → G-protein → second messenger (cAMP, IP3, DAG) → modulates channel
- Example: cGMP-gated channels in retinal rod cells (phototransduction); cardiac muscarinic K⁺ channels via Gβγ subunits
- Action potential reaches presynaptic terminal
- Voltage-gated Ca²⁺ channels open → Ca²⁺ influx
- Ca²⁺ triggers synaptic vesicle fusion → ACh release into synaptic cleft
- ACh binds nicotinic receptor (ligand-gated Na⁺/K⁺ channel) on postsynaptic membrane
- Conformational change opens channel → Na⁺ influx (net) → depolarization (End Plate Potential)
- If threshold reached → voltage-gated Na⁺ channels open → action potential propagates → muscle contraction
- Extremely rapid response (milliseconds vs seconds-minutes for GPCR/RTK pathways)
- Directly converts chemical signal into electrical signal
- No amplification via enzymatic cascade (unlike GPCR/second messenger systems) — a direct structural change
Exam tip summary
?
Lac operon gene regulation diagram repressor operator
types of gene mutations point mutation frameshift missense nonsense diagram
recombinant DNA technology cloning flowchart restriction enzyme vector plasmid
gene therapy ex vivo in vivo viral vector diagram
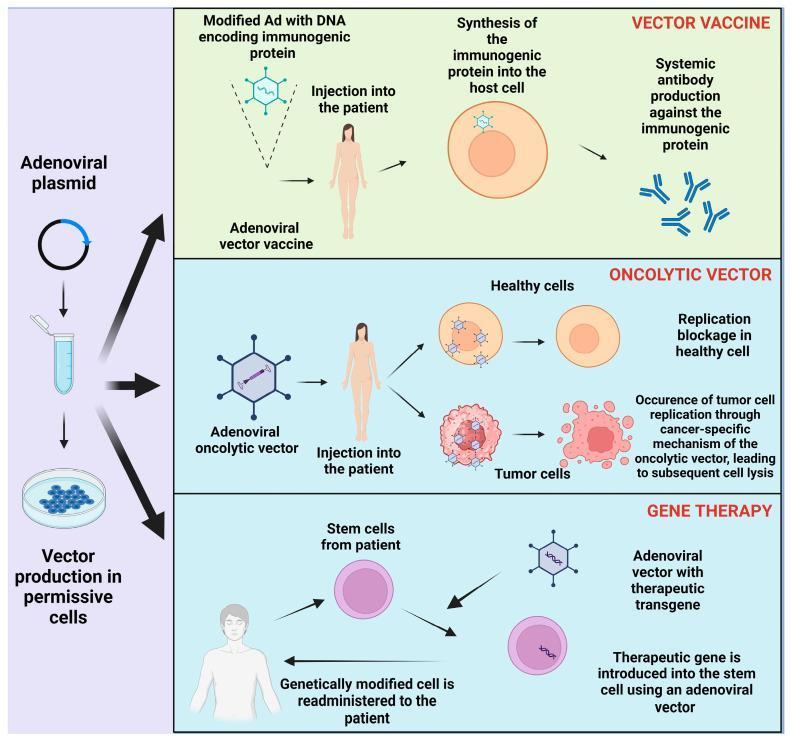
A medical infographic illustrating three clinical applications of adenoviral (Ad) vectors: vaccine development, oncolytic therapy, and gene therapy. The diagram starts on the left with the upstream process of 'Vector production in permissive cells' using an 'Adenoviral plasmid'. The top panel, 'VECTOR VACCINE', shows a modified Ad carrying DNA for an immunogenic protein being injected into a patient, leading to intracellular synthesis of the protein and subsequent systemic antibody production. The middle panel, 'ONCOLYTIC VECTOR', demonstrates a targeted approach: in healthy cells, viral replication is blocked, while in tumor cells, the vector triggers cancer-specific replication leading to cell lysis. The bottom panel, 'GENE THERAPY', illustrates an ex vivo process where stem cells are harvested from a patient, modified with a therapeutic transgene using an adenoviral vector, and then readministered. The diagram uses standard symbols for DNA plasmids, viral capsids, and cellular structures to explain molecular biotechnology and immunotherapy concepts.
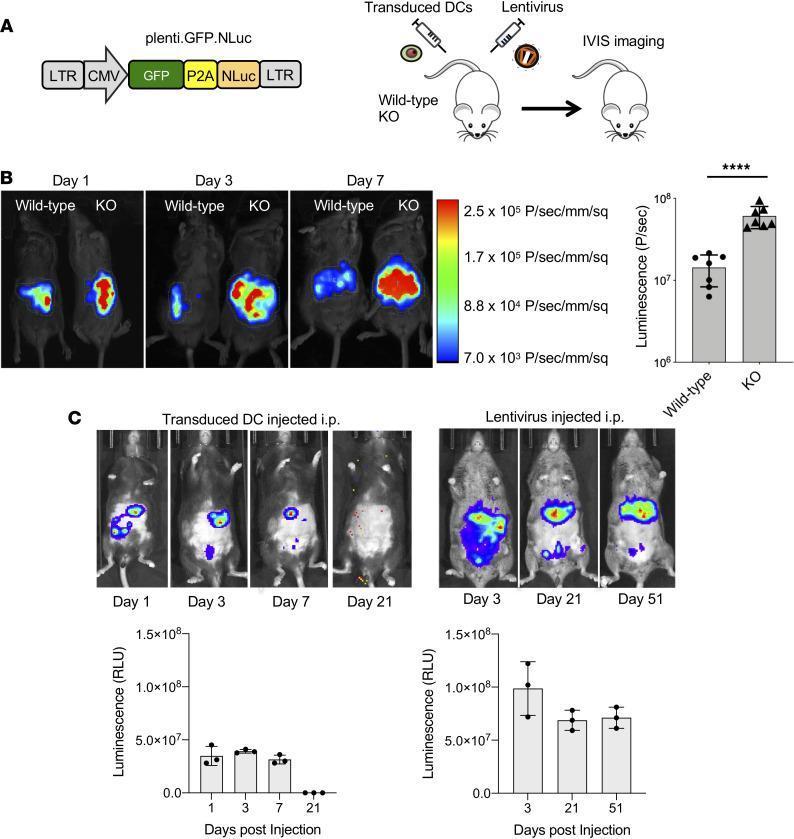
This composite educational image illustrates the use of in vivo bioluminescence imaging (IVIS) to study lentiviral vector transduction efficiency in mice. Section A shows a genetic diagram of the plenti.GFP-NLuc lentiviral vector and the experimental workflow involving intraperitoneal (i.p.) injection into wild-type and SAMHD1-knockout (KO) mice. Section B presents pseudocolored luciferase signal maps comparing wild-type and KO mice at days 1, 3, and 7. The KO mice demonstrate significantly higher luminescence intensity (p≤0.0001), particularly in the abdominal region, indicating that SAMHD1 restricts lentiviral transduction in vivo. Section C compares the durability of luciferase expression between ex vivo transduced dendritic cells (BMDCs) and direct lentivirus injection. Sequential images and bar graphs show that direct lentiviral injection leads to more sustained, high-level expression (extending to day 51) localized primarily to the spleen, whereas transduced BMDCs show diminishing signal by day 21. This material demonstrates concepts in gene therapy, virology, and the role of host restriction factors in viral transduction.
mRNA splicing spliceosome pre-mRNA processing diagram exon intron
MAPK signaling pathway ERK cascade diagram Ras Raf MEK
A pathophysiology diagram illustrating the canonical MAPK/ERK signaling pathway and its exploitation by viral pathogens. The diagram shows the cell membrane with various receptors, including Receptor Tyrosine Kinases (RTK) and G-protein coupled receptors (GPCR), responding to growth factors, cytokines, chemokines, and viruses. The intracellular signaling cascade initiates with Grb2 and SOS facilitating the transition of RAS-GDP to RAS-GTP. The signal proceeds through a sequential phosphorylation relay of RAF, MEK, and ERK. Activated ERK translocates from the cytoplasm to the nucleus, where it activates transcription factors Fos and ELK to influence gene expression. The diagram highlights points of viral interference: SARS-CoV-2 entry via ACE2, influenza replication utilizing RSK1, and HIV replication involving Gag MA, all linked to downstream ERK components. Key pharmacological inhibitors for potential therapeutic repurposing are noted, including Vemurafenib/Dabrafenib (RAF), Trametinib/Cobimetinib (MEK), and ONC201/Ulixertinib (ERK), alongside RAS inhibitors like ARS-853.
This pathophysiology diagram illustrates the complex signaling network involving SOX2 in bladder cancer cells, highlighting its role in tumor proliferation and chemoresistance. The diagram is divided into four main regulatory pathways: (A) The MAPK/ERK pathway, showing the RAS-RAF-MEK-ERK cascade where active RAS-GTP leads to ERK phosphorylation (pERK) and subsequent SOX2 activation, regulated by RASAL2. (B) The MAPK/JNK pathway, where ChlA-F triggers JNK and c-Jun phosphorylation, modulating SOX2 via miR-200c. (C) The SOX2-IGF2-AKT axis, demonstrating a positive feedback loop where SOX2 promotes IGF2 expression (inhibiting IGFBP1), which then activates AKT via phosphorylation (pAKT). (D) The COX2/PGE2 and YAP1 pathways, showing YAP1 directly activating SOX2 and COX2, while the COX2-PGE2 axis inhibits let-7, a microRNA that typically represses SOX2. Centrally, SOX2 acts as a master transcription factor that drives the transformation of bladder cancer cells into phenotypes characterized by rapid proliferation and enhanced chemoresistance.
A pathophysiology diagram illustrating the ErbB/HER2 signaling network, organized into three functional sections: input, signal processing, and output. (a) The input part shows extracellular ligands binding to transmembrane ErbB receptors (EGFR, HER2, HER3, and HER4), highlighting the role of HER2 heterodimers. (b) The signal processing part depicts three vertical intracellular signaling cascades: the PI3K/AKT/mTOR pathway (green), the JAK/STAT3 pathway (blue), and the RAS/RAF/MEK/ERK (MAPK) pathway (yellow). Each cascade follows a downward flow of activation. (c) The output part shows these pathways converging on the cell nucleus, represented by a DNA double helix. This section indicates downstream cellular effects including cell division, migration, differentiation, and apoptosis. This schematic provides a clinical overview of how HER2 overexpression drives tumorigenic processes and drug resistance mechanisms in cancers such as invasive breast cancer.
ion channel signal transduction neuromuscular junction acetylcholine receptor diagram
DNA cloning vector plasmid bacteria genetic engineering
sickle cell anemia hemoglobin mutation diagram
Diagrams Retrieved
Diagrams not found in the image library — draw these by hand as described
- Lac operon on/off switch — repressor bound to operator (off) vs allolactose-repressor complex releasing operator with RNA polymerase transcribing (on)
- Types of point mutations — a normal DNA/mRNA/protein strand compared side-by-side with silent, missense, nonsense, and frameshift versions
- Recombinant DNA technology flowchart — gene isolation → restriction digestion → ligation into vector → transformation into host → selection → cloning/expression
- Pre-mRNA splicing — exons/introns → spliceosome (snRNPs) forming lariat → mature spliced mRNA with cap and poly-A tail
- Neuromuscular junction ion channel signalling — voltage-gated Ca²⁺ channel at presynaptic terminal → ACh vesicle release → nicotinic ligand-gated Na⁺/K⁺ channel opening on postsynaptic membrane → depolarization