
LIVER │ (Lesser omentum) / \ Hepatogastric Hepatoduodenal │ │ STOMACH ---- DUODENUM Greater curvature │ (Greater omentum) │ ┌────────┴────────┐ │ │ Gastrosplenic Gastrocolic │ │ SPLEEN Transverse colon Splenorenal SPLEEN → Left kidney
Can you make this thing 3D so I can understand all the ligaments and the structures?
peritoneal ligaments lesser omentum greater omentum hepatogastric hepatoduodenal gastrosplenic anatomy diagram 3D
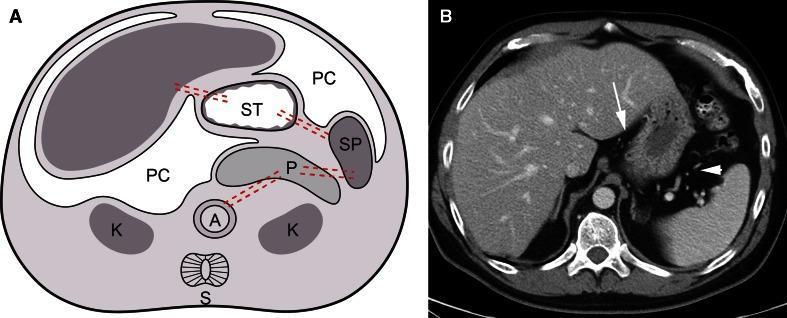
This educational image pairs an anatomical diagram with a corresponding axial contrast-enhanced CT scan of the upper abdomen to illustrate peritoneal anatomy and abdominal ligaments. Part A is a developmental schematic showing the relationships between the liver (L), stomach (ST), spleen (SP), and pancreas (P) within the peritoneal cavity (PC) and subperitoneal space. It identifies the ventral and dorsal mesenteries, including the gastrohepatic and gastrosplenic ligaments. Part B is an axial CT scan that correlates these findings in a clinical setting. The gastrohepatic ligament is indicated by a white arrow, appearing as a soft-tissue density band between the left lobe of the liver and the lesser curvature of the stomach, containing the left gastric artery. A white arrowhead identifies the gastrosplenic ligament, which connects the greater curvature of the stomach to the splenic hilum and contains the short gastric vessels. Visible organs include the liver, stomach, spleen, and spine, providing a clear demonstration of how subperitoneal ligaments serve as conduits for neurovascular structures and potential pathways for disease spread.
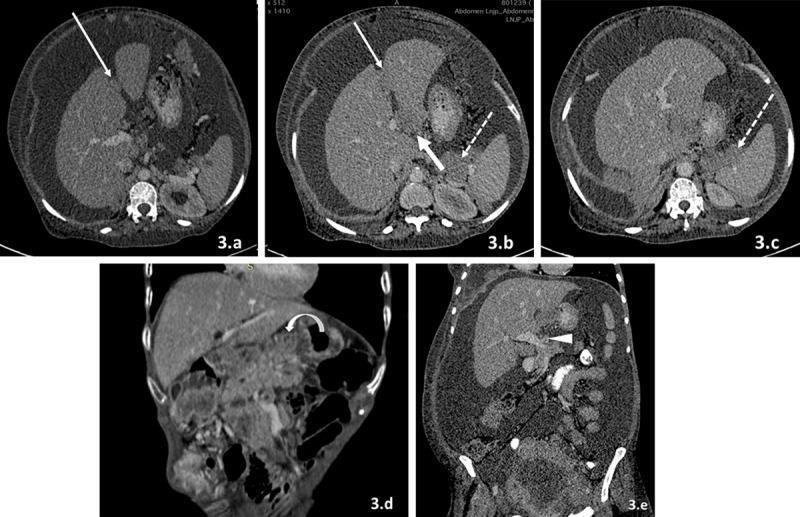
This series of axial and coronal contrast-enhanced computed tomography (CECT) images demonstrates various patterns of peritoneal carcinomatosis involving abdominal ligaments and fissures. The imaging highlights metastatic soft tissue deposits in several key anatomical sites: 1. Perihepatic ligaments: Axial scans (3.a, 3.b) show heterogeneously enhancing soft tissue nodules along the falciform ligament/ligamentum teres (thin white arrows) and the ligamentum venosum (thick white arrow in 3.b). 2. Lesser Omentum: Coronal images (3.d) reveal enhancing deposits in the gastrohepatic ligament (curved arrow) situated between the left hepatic lobe and the lesser curvature of the stomach. 3. Hepatoduodenal Ligament: A coronal section (3.e) displays an ill-defined soft tissue mass extending along the portal vein toward the porta hepatis (white arrowhead). 4. Gastrosplenic Ligament: Axial views (3.b, 3.c) identify deposits between the greater curvature of the stomach and the spleen (dotted arrows). The images collectively illustrate how peritoneal fluid stasis and anatomical conduits facilitate the spread of malignancies like ovarian and breast carcinoma to the ligamentous recesses of the abdominal cavity.
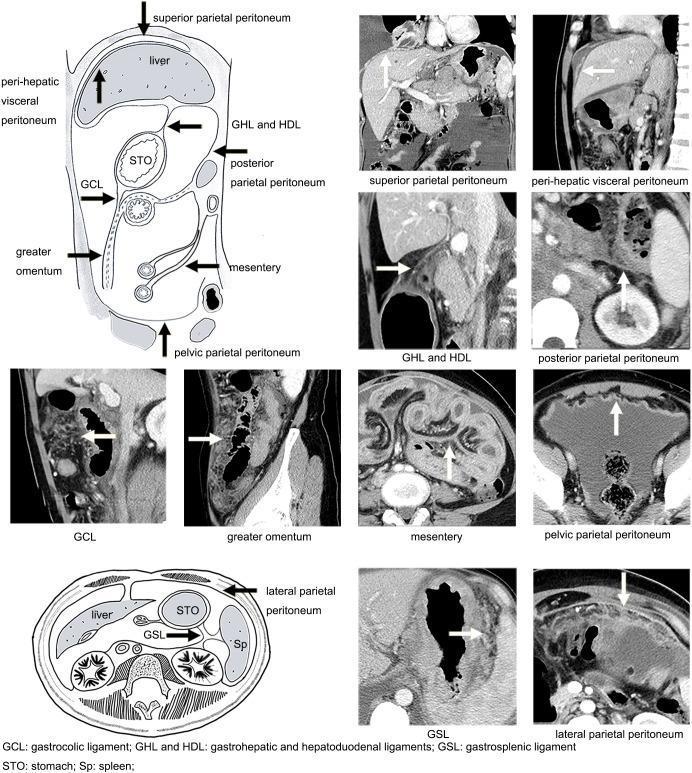
This composite educational resource consists of anatomical diagrams and corresponding computerized tomography (CT) scans illustrating the distribution and manifestation of peritoneal metastasis (PM). The anatomical diagrams (sagittal and axial views) label ten key peritoneal regions: superior, posterior, lateral, and pelvic parietal peritoneum; perihepatic visceral peritoneum; gastrohepatic and hepatoduodenal ligaments (GHL and HDL); gastrosplenic ligament (GSL); gastrocolic ligament (GCL); greater omentum; and the mesentery. The accompanying CT images demonstrate radiological signs of metastasis (indicated by white arrows) across these specific regions. Key diagnostic features highlighted include nodular thickening of the parietal peritoneum, increased soft tissue density in the GHL/HDL and GSL, and characteristic 'omental caking' within the greater omentum. Other findings show diffuse fibrosis strands and irregular thickening along the visceral peritoneum of the liver and mesentery. This content is designed for oncological imaging education, focusing on the systematic evaluation of tumor seeding within the abdominal cavity and the distinction between smooth normal linings and pathological nodularity.
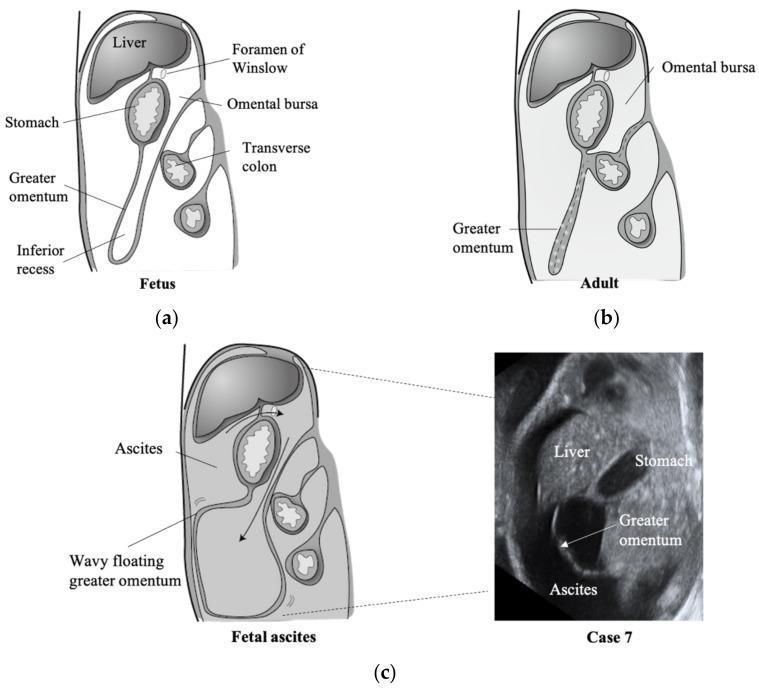
This educational resource features three sagittal schematic diagrams and one corresponding ultrasound image illustrating the embryological development and clinical presentation of the greater omentum and omental bursa. Diagram (a) shows the fetal configuration, where the greater omentum consists of a four-layered peritoneal fold with an open inferior recess extending deeply into the abdominal cavity, posterior to the stomach and anterior to the transverse colon. Diagram (b) demonstrates the adult configuration, where the anterior and posterior layers have fused (indicated by dashed lines), obliterating the inferior recess and limiting the vertical extent of the omental bursa. Diagram (c) and the accompanying grayscale ultrasound image (Case 7) depict fetal ascites. In the presence of free intraperitoneal fluid, ascites enters the omental bursa through the foramen of Winslow. This fluid separates the peritoneal layers, causing the greater omentum to appear as a 'wavy floating' structure within the fluid collection. Key labeled landmarks include the liver, stomach, transverse colon, and foramen of Winslow, highlighting the spatial relationship between the lesser sac and the greater peritoneal cavity.
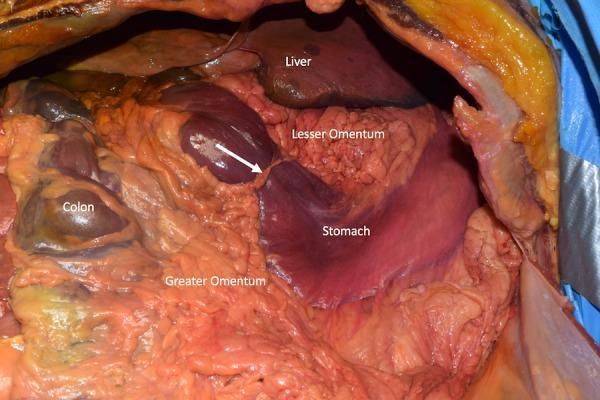
Anterior clinical photograph of a cadaveric abdominal dissection displaying a rare anatomical variation. The image shows the superiorly positioned liver, with the stomach located inferiorly and to the anatomical left. A textured lesser omentum (hepatogastric ligament) connects the liver and stomach, while the fat-laden greater omentum hangs from the stomach's greater curvature. A distinct, anomalous band (indicated by a white arrow) is visible, extending from the lesser omentum to the greater omentum. This band crosses the anterior surface of the distal stomach, creating a mechanical constriction or hourglass deformity. To the left of the image, portions of the colon are visible. The primary educational focus is the identification of anomalous peritoneal bands and their potential to cause gastric compression or obstruction in clinical scenarios.
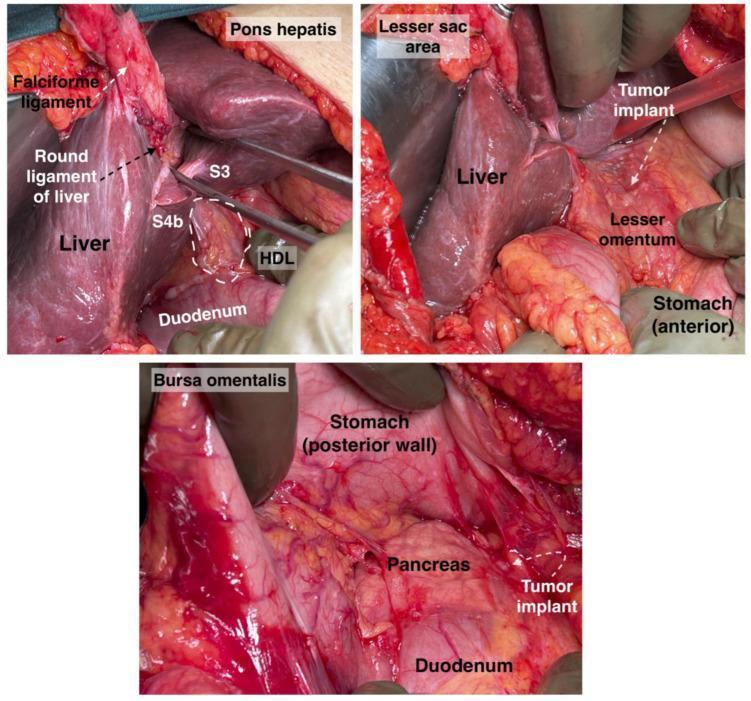
A series of three annotated clinical photographs showing surgical views of the upper abdomen during a cytoreductive procedure, specifically focusing on the anatomy of the liver, lesser sac, and bursa omentalis. Image 1 (Top Left): Demonstrates the liver with segments S3 and S4b clearly visible. Key landmarks include the 'pons hepatis' (an anatomical liver bridge), the falciform ligament, and the round ligament of the liver. The hepatoduodenal ligament (HDL) is highlighted adjacent to the duodenum. Image 2 (Top Right): Focuses on the lesser sac area, showing the relationship between the liver and the lesser omentum. A metastatic tumor implant is indicated on the lesser omentum near the anterior wall of the stomach. Image 3 (Bottom): Provides a view of the bursa omentalis after retraction. Anatomical structures shown include the posterior wall of the stomach, the pancreas, and the duodenum. A tumor implant is highlighted in the vicinity of the pancreas and duodenum, demonstrating typical peritoneal dissemination patterns. These images serve as educational material for identifying potential sites of neglected tumor implants in advanced epithelial ovarian cancer (AEOC) surgery.
abdominal peritoneal folds ligaments liver stomach spleen duodenum anatomy
This educational image pairs an anatomical diagram with a corresponding axial contrast-enhanced CT scan of the upper abdomen to illustrate peritoneal anatomy and abdominal ligaments. Part A is a developmental schematic showing the relationships between the liver (L), stomach (ST), spleen (SP), and pancreas (P) within the peritoneal cavity (PC) and subperitoneal space. It identifies the ventral and dorsal mesenteries, including the gastrohepatic and gastrosplenic ligaments. Part B is an axial CT scan that correlates these findings in a clinical setting. The gastrohepatic ligament is indicated by a white arrow, appearing as a soft-tissue density band between the left lobe of the liver and the lesser curvature of the stomach, containing the left gastric artery. A white arrowhead identifies the gastrosplenic ligament, which connects the greater curvature of the stomach to the splenic hilum and contains the short gastric vessels. Visible organs include the liver, stomach, spleen, and spine, providing a clear demonstration of how subperitoneal ligaments serve as conduits for neurovascular structures and potential pathways for disease spread.
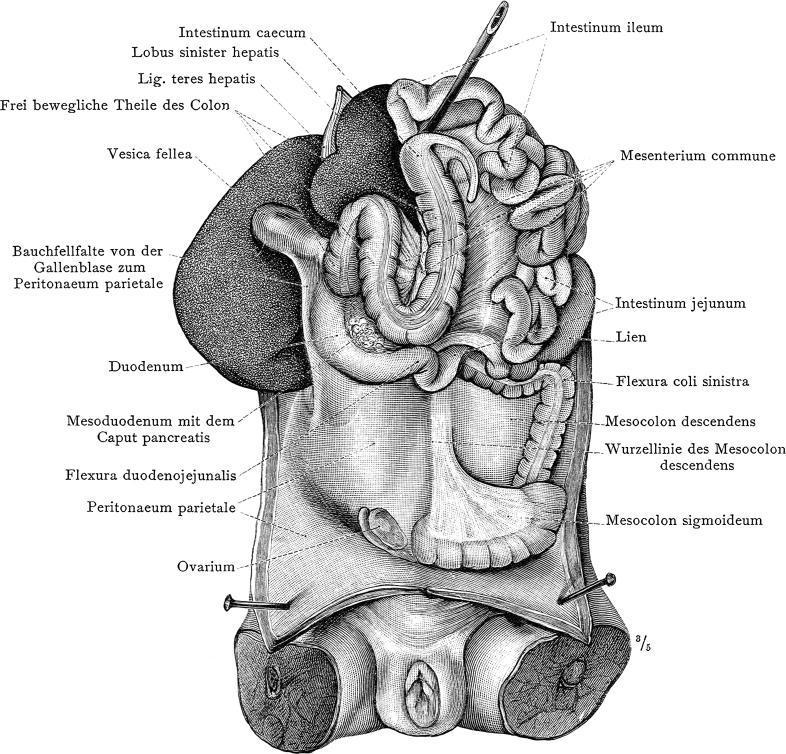
Historical anatomical diagram from Carl Toldt's 'Anatomischer Atlas' depicting a dissection of the human abdominal and pelvic cavity. The illustration focuses on the spatial relationships of the visceral organs and their peritoneal attachments. Key labeled structures include the spleen (Lien), shown as an oblong organ situated superior to the left colic flexure (Flexura coli sinistra) and adjacent to the jejunum. In the upper right quadrant (anatomical left), the left lobe of the liver (Lobus sinister hepatis), ligamentum teres, and gallbladder (Vesica fellea) are prominent. The gastrointestinal tract is shown with the duodenum, ileum, and cecum (Intestinum caecum). Extensive detail is provided on the mesentery and folds, including the Mesenterium commune, Mesocolon descendens, and Mesocolon sigmoideum. In the inferior pelvic region, the ovary (Ovarium) is visible. This diagram illustrates the complex organization of the peritoneum and the fixation of various abdominal organs, which is of historical and educational significance for understanding surgical anatomy and conditions such as 'wandering spleen' (splenoptosis).
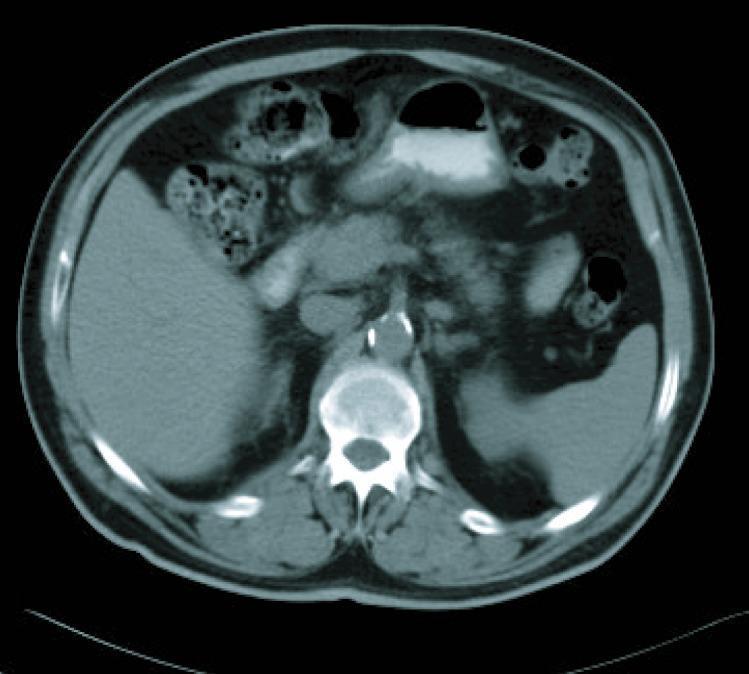
This diagnostic image is an axial contrast-enhanced computed tomography (CT) scan of the upper abdomen. Anatomical landmarks include the liver in the right upper quadrant, the spleen in the left upper quadrant, the stomach containing air and fluid in the midline/left, and the vertebral body of the spine located posteriorly. The liver and spleen appear relatively homogeneous in density. Of clinical significance, the scan demonstrates multiple soft tissue densities in the mesenteric and retroperitoneal regions, consistent with lymphadenopathy. A small, high-density calcification is visible anterior to the spinal column, likely associated with the abdominal aorta or surrounding nodal structures. There is no evidence of gross ascites in the peritoneal spaces. This image serves as a radiological reassessment for gastric adenocarcinoma staging and treatment response, illustrating the monitoring of lymphadenopathy and gastric wall thickening following chemotherapy cycles. It is suitable for medical education regarding abdominal cross-sectional anatomy and oncological imaging evaluation.
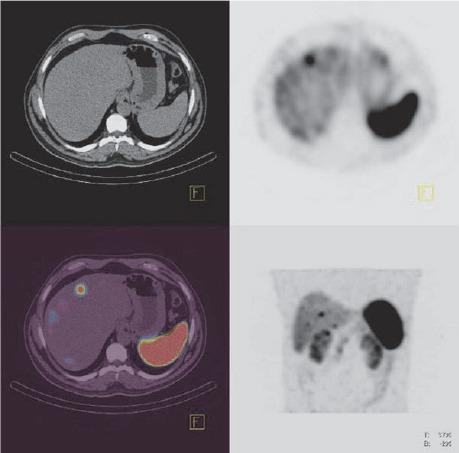
This composite diagnostic image displays a multi-modal radiological assessment of the abdomen using SPECT, CT, and fused SPECT/CT imaging. The top-left panel is a transaxial CT scan showing abdominal anatomy, including the liver, spleen, and stomach; a subtle hypoattenuating lesion is visible in the liver parenchyma. The top-right and bottom-right panels show transaxial and coronal SPECT images, respectively, utilizing 99mTc-Hynic TOC to detect somatostatin receptor-positive tissues. These functional images reveal intense radiotracer uptake (hot spots) in the spleen (physiological) and localized pathological uptake in the duodenum and multiple liver lesions. The bottom-left panel demonstrates a fused transaxial SPECT/CT, precisely localizing the radiopharmaceutical activity to the anatomical lesions identified on CT. This imaging series is characteristic of a gastroenteropancreatic neuroendocrine tumor (NET) evaluation, highlighting both the primary tumor in the duodenum and secondary metastatic spread to the liver. The study illustrates the superior sensitivity of functional molecular imaging over conventional CT for staging metastatic disease in NET patients.
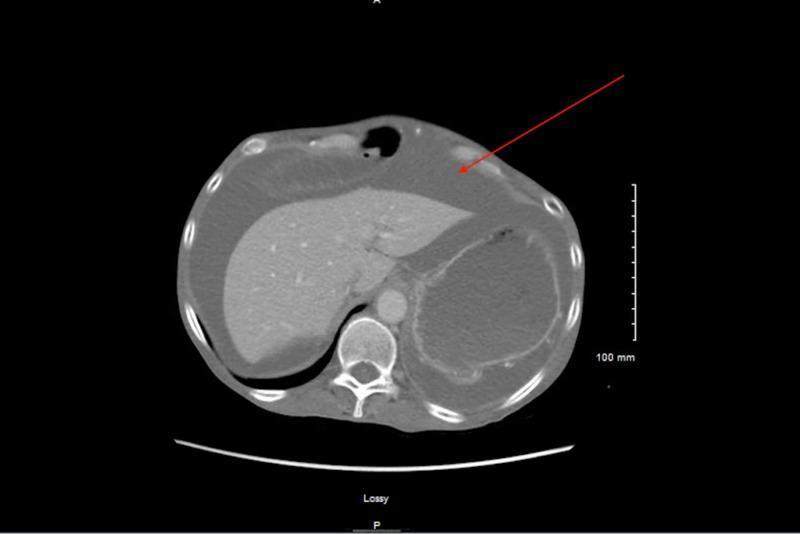
This diagnostic image is an axial computed tomography (CT) scan of the upper abdomen. The primary finding is a large-volume peritoneal effusion, or ascites, which appears as low-attenuation fluid (dark gray) surrounding the solid organs. A red arrow points specifically to the layering fluid between the liver and the anterior abdominal wall. The liver is visible in the right upper quadrant and exhibits a smooth contour with a relatively homogeneous parenchymal density, showing no overt signs of cirrhosis or focal masses. The spleen and a gas-distended stomach are visible on the left side of the frame, also surrounded by ascitic fluid. The fluid tracks into the paracolic gutters and the perisplenic space. Vertebral anatomy and a portion of the aorta are visible posteriorly. This image serves as a clinical example of high-protein or high-SAAG ascites, often associated with portal hypertension or cardiac etiology, demonstrated by the significant abdominal distension and fluid accumulation.
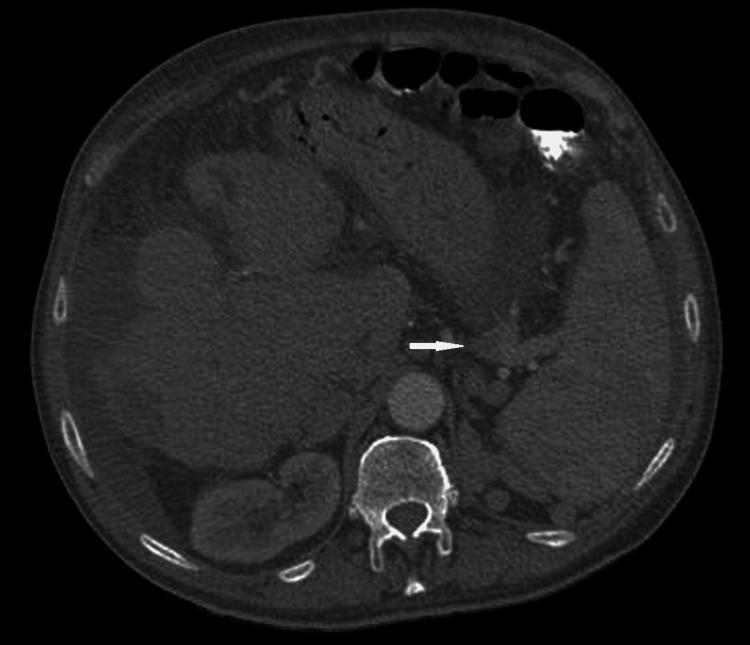
This diagnostic image is an axial cross-section of an abdominal CT scan showing the upper abdominal anatomy. In the posterior midline, the vertebral body and neural canal are clearly visible. Immediately anterior to the spine is the hyperdense abdominal aorta. To the left of the midline (patient's right), the liver appears enlarged with a somewhat heterogeneous texture. On the patient's left side, the spleen is visible. A white arrow points to the splenic hilum, highlighting multiple dilated, tortuous vascular structures characteristic of varices. These collateral vessels suggest portal hypertension or splenic vein pathology. Within the peritoneal cavity, low-density fluid is visible surrounding the liver and spleen, consistent with ascites. The stomach is visible anteriorly, containing mixed density material and gas. The image serves as an educational example of secondary signs of portal hypertension and the identification of perisplenic varicosities using contrast-enhanced computerized tomography.
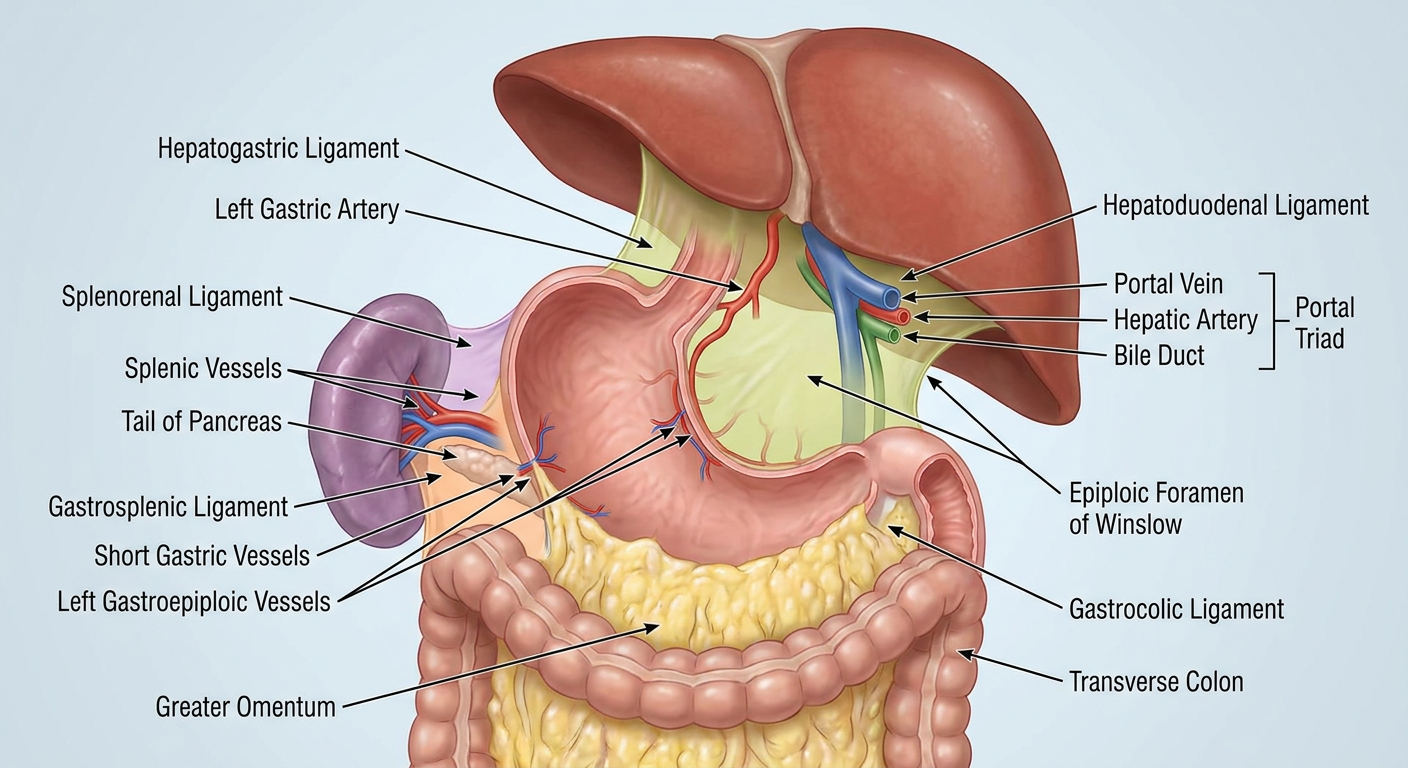
A clear 3D anatomical diagram showing the peritoneal ligaments of the upper abdomen. Show the liver at the top center. From the liver's lower border, the lesser omentum stretches downward, splitting into two parts: the hepatogastric ligament (connecting liver to the lesser curvature of the stomach, labeled, containing left gastric artery) and the hepatoduodenal ligament (connecting liver to the duodenum, labeled, containing portal triad: portal vein, hepatic artery, bile duct). The stomach is shown in the center with its greater curvature on the left side. From the greater curvature hang the greater omentum (labeled, apron-like fat pad hanging down). The greater omentum connects as the gastrocolic ligament to the transverse colon (shown below). On the left, the gastrosplenic ligament connects the greater curvature of the stomach to the spleen (containing short gastric vessels and left gastroepiploic vessels, labeled). Behind the spleen, the splenorenal ligament connects the spleen to the left kidney (containing splenic vessels and tail of pancreas, labeled). All structures labeled with arrows. The lesser sac (omental bursa) is shown as a space behind the stomach, accessible through the epiploic foramen of Winslow. 3D perspective view, medical illustration style, clean background, color-coded ligaments.
Peritoneal Ligaments of the Upper Abdomen - 3D Visual Guide
Generated 3D Diagram
Axial Cross-Section (how it looks on CT)
- White arrow = Gastrohepatic ligament (part of lesser omentum)
- White arrowhead = Gastrosplenic ligament
Sagittal + Axial Overview (All Ligaments Labeled)
Cadaveric View (Real Anatomy)
Structure-by-Structure Breakdown
THE LESSER OMENTUM (2 parts)
| Ligament | Connects | Contains |
|---|---|---|
| Hepatogastric | Liver → lesser curvature of stomach | Left gastric vessels, lymphatics, vagal branches |
| Hepatoduodenal | Liver → first part of duodenum | Portal triad: portal vein (posterior), hepatic artery proper (left), common bile duct (right) |
The hepatoduodenal ligament forms the anterior boundary of the epiploic foramen (of Winslow) - the only opening into the lesser sac. This is why you compress it between finger and thumb (Pringle's manoeuvre) to control liver bleeding.
THE GREATER OMENTUM (3 named ligaments)
| Ligament | Connects | Contains |
|---|---|---|
| Gastrosplenic (gastrolienal) | Greater curvature of stomach → splenic hilum | Short gastric vessels, left gastroepiploic vessels |
| Gastrocolic | Greater curvature of stomach → transverse colon | Right and left gastroepiploic vessels |
| Gastrophrenic | Greater curvature of stomach → diaphragm | (usually avascular) |
SPLENORENAL LIGAMENT
| Ligament | Connects | Contains |
|---|---|---|
| Splenorenal (lienorenal) | Splenic hilum → anterior surface of left kidney | Splenic vessels, tail of the pancreas |
THE LESSER SAC (Omental Bursa) - The Hidden Space
| Wall | Structure Forming It |
|---|---|
| Anterior | Lesser omentum + posterior wall of stomach + gastrocolic ligament |
| Posterior | Peritoneum over pancreas, left kidney, left adrenal |
| Right | Epiploic foramen of Winslow (entrance) |
| Left | Gastrosplenic + splenorenal ligaments |
| Superior | Caudate lobe of liver + diaphragm |
| Inferior | Transverse mesocolon |
Clinical Memory Points
- Pringle's manoeuvre = compress the hepatoduodenal ligament to stop liver hemorrhage
- Pancreatitis spreading to the lesser sac = fluid trapped behind stomach (explains epigastric "wall" on CT)
- Gastric cancer spreads along gastrosplenic and gastrohepatic ligaments to reach lymph nodes and spleen
- Splenectomy requires dividing both gastrosplenic (short gastric vessels) and splenorenal (splenic artery/vein) ligaments
- Stomach mobilization for oesophagectomy requires dividing the gastrosplenic ligament (sacrificing short gastric vessels)