
Japanese encephalitis lab diagnosis
"Japanese encephalitis" AND "laboratory diagnosis"
Japanese encephalitis MRI thalamus T2 hyperintensity
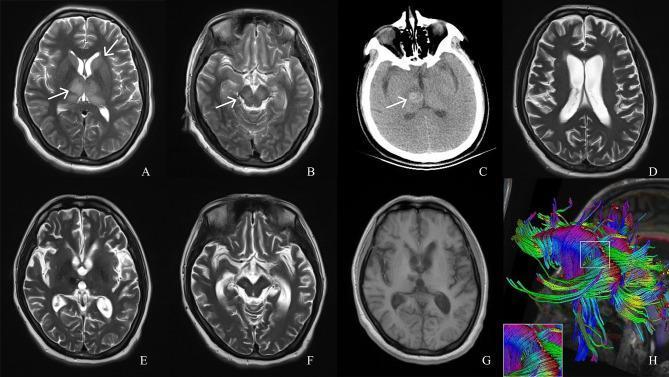
This longitudinal neuroimaging series tracks the progression of a brain injury, likely Japanese encephalitis, using T2-weighted MRI (A-B, D-F), non-contrast CT (C), T1-weighted MRI (G), and Diffusion Tensor Imaging (DTI) (H). Initial T2 MRI at day 6 (A, B) demonstrates symmetrical hyperintense signals in the bilateral thalamus, caudate nucleus, and cerebral peduncles (white arrows). By day 19, a CT scan (C) reveals a hyperdense region in the right thalamus consistent with an acute hemorrhage (arrow). Follow-up imaging at month 6 (D-F) and month 14 (G) shows the evolution into chronic sequelae: the primary lesions have reduced in size, but there is marked global brain atrophy characterized by prominent ventricles (ventriculomegaly), widened cortical sulci, and thinned gyri. The T1-weighted image (G) reinforces the presentation of diffuse atrophic changes. Finally, a DTI reconstruction (H) illustrates the integrity of white matter tracts, specifically highlighting a disruption or breakage in the corpus callosum fibers. This series serves as a pedagogical tool for understanding the natural history of viral encephalitis, from acute inflammatory edema and secondary hemorrhage to long-term neuroanatomical degeneration.
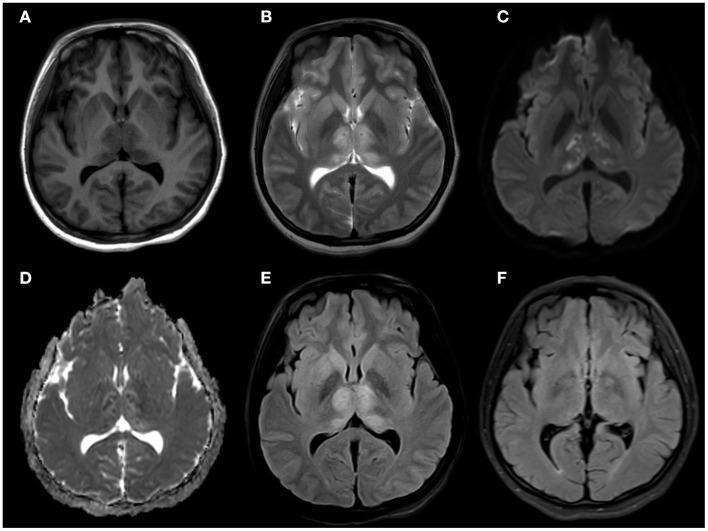
This composite diagnostic image displays six axial brain MRI sequences (A-F) documenting a case of viral encephalitis, specifically Japanese Encephalitis. Panels A-E represent the acute phase, showing symmetric involvement of the deep gray matter structures. (A) T1-weighted image reveals subtle hypointensity in the bilateral thalami, head of the caudate nuclei, and right lenticular nucleus. (B) T2-weighted imaging demonstrates corresponding hyperintensity in these regions, including the hippocampi. (C) Diffusion-weighted imaging (DWI) and (D) Apparent Diffusion Coefficient (ADC) map show bilateral punctate hyperintensity on DWI with corresponding hypointensity on ADC, indicating restricted diffusion and cytotoxic edema. (E) T2-FLAIR imaging confirms hyperintensity in the bilateral thalami and caudate heads without mass effect. (F) A follow-up T2-FLAIR image from two months later shows complete resolution of the previously seen signal abnormalities. The symmetrical involvement of the thalami and basal ganglia is a hallmark radiological finding for Flavivirus infections. This sequence serves as an educational example of deep gray matter restricted diffusion and its longitudinal progression in neuro-infectious diseases.
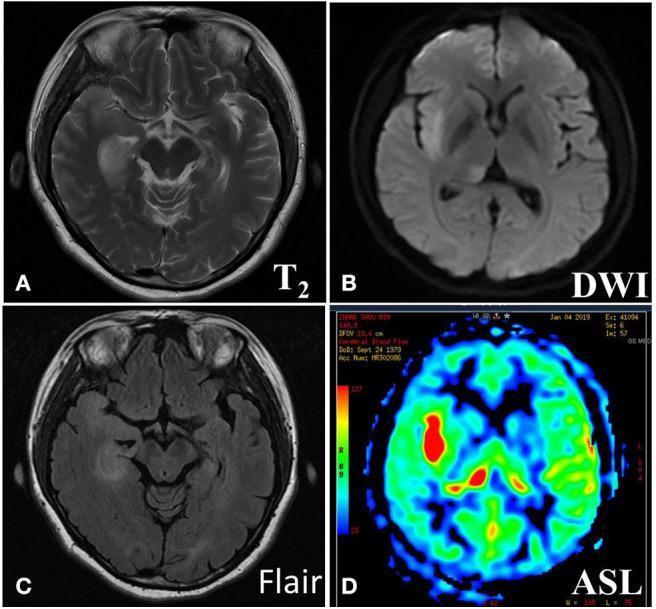
This set of four axial brain MRI images demonstrates diagnostic findings in a patient with anti-LGI1 encephalitis. (A) T2-weighted imaging (T2WI) and (C) T2-FLAIR sequences show hyperintense signals and mild cortical swelling within the right temporal lobe, right insular lobe, and right hippocampus. The left hippocampus appears normal on these sequences. (B) Diffusion-weighted imaging (DWI) reveals slightly elevated signal intensity in the corresponding right-sided regions. (D) Arterial Spin Labeling (ASL) perfusion imaging highlights significant focal hyperperfusion (indicated by the red/warm colors on the perfusion map) in the right temporal lobe, insula, and thalamus compared to the contralateral hemisphere. These combined radiological features—medial temporal lobe hyperintensity, hippocampus involvement, and regional hyperperfusion—are characteristic imaging markers for autoimmune encephalitis affecting the limbic system.
Japanese Encephalitis - Laboratory Diagnosis
1. Specimen Collection
| Specimen | Purpose |
|---|---|
| CSF | IgM ELISA (first-line), RT-PCR, virus isolation |
| Serum (acute + convalescent) | IgM ELISA; 4-fold IgG rise |
| Blood | RT-PCR in early/acute phase only |
2. CSF Findings (Lumbar Puncture)
- WBC: 10-500 cells/μL (rarely up to 1,000); early PMN predominance, shifting to lymphocytic predominance later
- Protein: Elevated, 50-100 mg/dL
- Glucose: Normal
- CSF findings are non-specific but consistent with viral/aseptic meningoencephalitis
3. Serological Tests (PRIMARY DIAGNOSIS)
A. IgM Antibody Capture ELISA (MAC-ELISA) - First-Line Test
- Recommended by WHO as the first-line rapid diagnostic assay
- Detects JEV-specific IgM in CSF or serum
- IgM appears in CSF by ~4 days after symptom onset; in serum by ~7 days after onset; some sources state as early as 3 days post-symptom onset
- Sensitivity in CSF: 65-70% (commercial assays)
- Specificity: 89-100% in CSF
- Available at commercial reference laboratories; confirmatory testing at CDC
- Limitation: Cross-reacts with other flaviviruses (dengue, West Nile, Zika, yellow fever) - confirmatory testing required
B. Plaque Reduction Neutralization Test (PRNT) - Gold Standard for Confirmation
- Gold standard for flavivirus diagnosis
- Distinguishes JEV-specific antibodies from cross-reacting flaviviral antibodies
- Used when MAC-ELISA is positive or equivocal, or where dengue co-circulation is a concern
- Not widely available; typically performed at reference/CDC laboratories
C. IgG Antibody (Convalescent Serology)
- A 4-fold rise in IgG titer between acute and convalescent serum samples is confirmatory
- Used when PRNT is unavailable
- Requires paired samples (acute + 2-4 weeks later), limiting early diagnosis
4. Molecular Tests
RT-PCR
- Detects JEV RNA in blood or CSF during early/acute phase (first few days of illness)
- Virus is replaced by antibody response rapidly, making PCR insensitive once neurological symptoms are established
- Low viral load means NAAT/RT-PCR should NOT be used to rule out infection in immune-competent patients
- Virus isolation from blood is infrequent; however, JEV can be isolated from CSF in up to 1/3 of patients with severe disease
5. Summary of Diagnostic Methods
| Method | Specimen | Sensitivity | Specificity | Timing | Notes |
|---|---|---|---|---|---|
| MAC-ELISA (IgM) | CSF/Serum | 65-70% (CSF) | 89-100% | From day 3-7 of symptoms | First-line; WHO recommended |
| PRNT | Serum | High | Very high | Convalescent | Gold standard; confirmatory |
| 4-fold IgG rise | Paired serum | Moderate | Moderate | Acute + convalescent | Alternative when PRNT unavailable |
| RT-PCR | Blood/CSF | Low (late disease) | High | First 1-5 days | Useful only in viremic phase |
| Virus isolation | CSF | ~30% (severe cases) | High | Acute | Reference labs only |
6. Neuroimaging (Supportive Diagnosis)
- T2/FLAIR hyperintense signal bilaterally in thalamus (most characteristic)
- Also: midbrain, basal ganglia, cerebellum
- Represents subcortical encephalitis
7. Differential Diagnosis Considerations
- Dengue virus
- West Nile virus
- Zika virus
- Yellow fever virus
- St. Louis encephalitis virus
Key Points
- Viremia resolves early - do not rely on culture or PCR in established disease
- IgM ELISA of CSF/serum is the standard first-line test (WHO recommendation)
- PRNT is the gold standard for confirmation and flavivirus differentiation
- CSF typically shows lymphocytic pleocytosis with normal glucose
- MRI thalamic T2 hyperintensity is the characteristic imaging finding
- JEV can occasionally be isolated from CSF in up to 1/3 of severe cases
Pathogenesis of tetanus
tetanus toxin tetanospasmin mechanism inhibitory neuron spinal cord pathogenesis
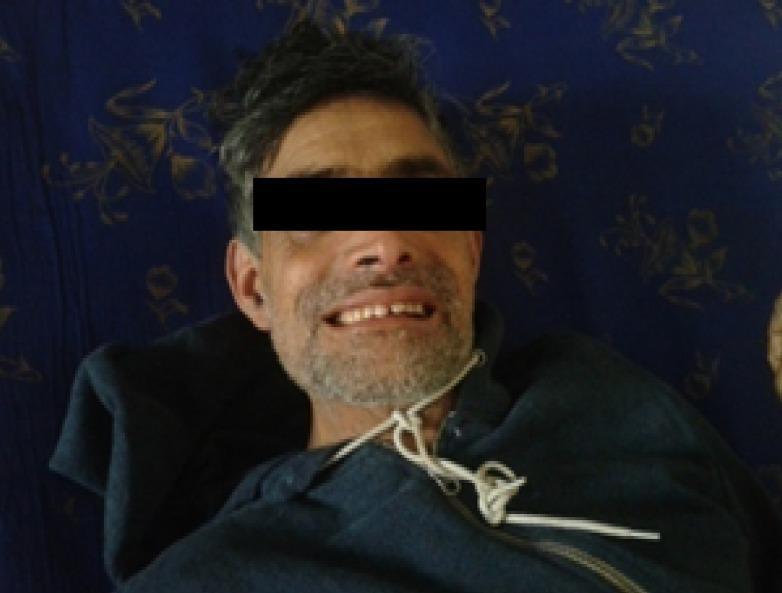
Clinical photograph of an adult male patient demonstrating risus sardonicus, a hallmark sign of generalized tetanus. The image shows a frontal view of the face where sustained contraction of the facial musculature, specifically the zygomatic and buccinator muscles, results in a characteristic abnormal, grimacing smile. The corners of the mouth are pulled laterally and upwards, and the teeth are partially bared due to involuntary spasm. This fixed facial expression, also known as 'sardonic grin,' is a pathological indicator of the tetanospasmin toxin's effect on the nervous system, leading to hypertonia and muscle spasms. The patient is depicted in a supine position, showing fair skin and dark hair. This visual serves as a primary diagnostic reference for clinical neurology and infectious disease, illustrating the involuntary muscle hyperactivity associated with Clostridium tetani infection.
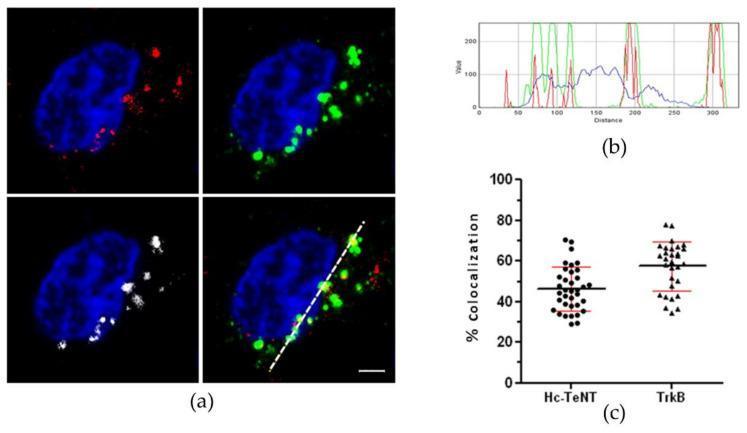
Educational figure illustrating the colocalization of Hc-TeNT and TrkB receptor in cerebellar granule neurons (CGNs). Panel (a) contains immunofluorescence microscopy images (scale bar = 2 μm) showing a neuron with nuclei stained blue (DAPI). Red punctate signals indicate endocytosed Hc-A555 (a fragment of tetanus toxin), while green signals represent TrkB receptor staining. White punctate regions in the merged image highlight specific areas of colocalization between the toxin and the receptor within the cytoplasm. Panel (b) is a fluorescence intensity profile plot tracking the relative intensities of the red, green, and blue channels along the white dotted line shown in panel (a); overlapping red and green peaks demonstrate physical proximity of Hc-A555 and TrkB. Panel (c) is a scatter plot with error bars showing the percentage of colocalization: approximately 47% for Hc-TeNT with TrkB and 60% for TrkB with Hc-TeNT. This visual evidence supports the mechanism of shared endocytic transport of tetanus toxin fragments and neurotrophin receptors in neuronal cells.
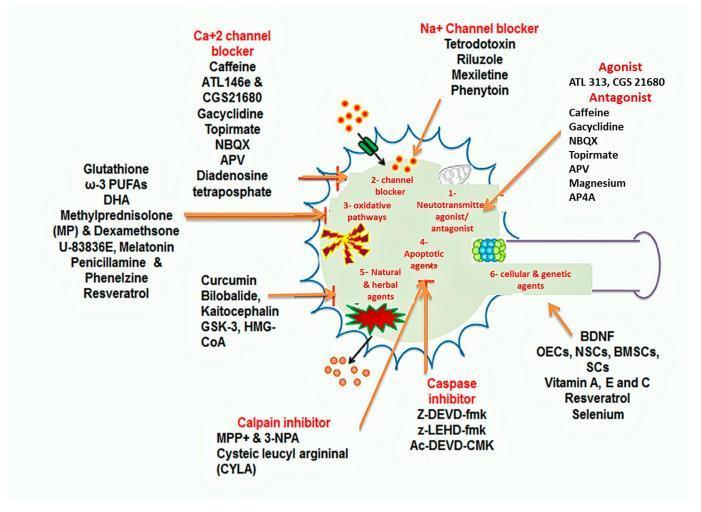
This medical pathophysiology diagram illustrates pharmacological and non-pharmacological neuroprotective approaches following spinal cord injury (SCI). The central figure depicts a stylized neuron with six primary numbered neuroprotective pathways: (1) Neurotransmitter agonist/antagonist, (2) Channel blockers (including Ca2+ and Na+ channels), (3) Anti-oxidative pathways, (4) Apoptotic agents (focusing on caspase and calpain inhibition), (5) Natural and herbal agents, and (6) Cellular and genetic agents. Surrounding the cell, specific therapeutic agents are categorized by their mechanism of action. Key pharmacological interventions include Na+ channel blockers (Tetrodotoxin, Riluzole), Ca2+ channel blockers (Caffeine, APV), and anti-apoptotic agents (Z-DEVD-fmk, Ac-DEVD-CMK). Non-pharmacological and natural approaches highlighted include antioxidants (Glutathione, Vitamin E, Resveratrol), herbal compounds (Curcumin, Bilobalide), and advanced cellular therapies such as BDNF, NSCs, and BMSCs. The diagram serves as an educational summary of multi-target strategies designed to mitigate secondary injury cascades like excitotoxicity, oxidative stress, and programmed cell death in neurology and neurosurgery contexts.
Pathogenesis of Tetanus
1. The Organism
2. Entry and Germination
- Spores are introduced into a wound contaminated with soil, foreign bodies, or feces (puncture wounds, lacerations, contaminated heroin, umbilical stump in neonates, surgical instruments, etc.)
- Germination occurs when local tissue conditions reduce oxygen tension - devitalized/crushed tissue, foreign bodies, or co-infection create the anaerobic microenvironment needed
- Vegetative cells proliferate locally. Importantly, C. tetani is non-invasive - it does not spread beyond the wound. There may be minimal or no visible wound inflammation
- Toxin production occurs during the stationary phase of growth; the toxin is released when the cell lyses
3. The Two Toxins
| Toxin | Nature | Role |
|---|---|---|
| Tetanolysin | Oxygen-labile hemolysin (related to streptolysin O) | Facilitates bacterial growth; inhibited by oxygen and serum cholesterol; clinical significance unknown |
| Tetanospasmin | Plasmid-encoded, heat-labile neurotoxin | Solely responsible for ALL clinical manifestations |
4. Tetanospasmin - Structure
- Synthesized as a single 150-kDa polypeptide
- Cleaved by an endogenous bacterial protease into:
- Light chain (A chain, ~50 kDa): toxic subunit - zinc endopeptidase activity
- Heavy chain (B chain, ~100 kDa): binding and translocation subunit
- The two chains are held together by a disulfide bond + non-covalent forces
5. Step-by-Step Mechanism of Action
Step 1 - Binding at the Neuromuscular Junction
- The carboxyl-terminal domain of the heavy chain (B chain) binds with high affinity to polysialoganglioside receptors (sialic acid receptors) and adjacent glycoproteins on the presynaptic membranes of peripheral motor neurons
Step 2 - Internalization and Retrograde Axonal Transport
- The toxin-receptor complex is internalized into endosomal vesicles
- These vesicles undergo retrograde axonal transport along motor neuron axons - travelling from the peripheral nerve terminal back to the motor neuron soma in the anterior horn of the spinal cord (and brainstem for cranial nerves)
- The toxin can also spread hematogenously to peripheral nerves throughout the body
Step 3 - Transcytosis into Inhibitory Interneurons
- At the spinal cord, the toxin undergoes trans-synaptic spread - it crosses the synapse and enters inhibitory interneurons (glycinergic and GABAergic neurons)
- The endosome becomes acidified, causing a conformational change in the N-terminal domain of the heavy chain
- This causes the heavy chain to insert into the endosomal membrane, allowing the light chain to translocate into the cytosol
Step 4 - Cleavage of SNARE Protein (Synaptobrevin/VAMP)
- The light chain zinc endopeptidase cleaves synaptobrevin (also called VAMP - vesicle-associated membrane protein)
- Synaptobrevin is a SNARE protein required for docking of neurotransmitter vesicles onto the presynaptic membrane
- Without synaptobrevin, inhibitory neurotransmitter vesicles cannot fuse and release their contents
Step 5 - Block of Inhibitory Neurotransmission
- Release of glycine (from spinal inhibitory interneurons) and GABA (from brainstem interneurons) is blocked
- These inhibitory neurotransmitters normally suppress alpha-motor neuron firing between voluntary movements
Step 6 - Unopposed Motor Neuron Excitation → Spastic Paralysis
- Without inhibitory control, alpha-motor neurons undergo sustained, unregulated excitatory discharge
- Agonist and antagonist muscle groups contract simultaneously and continuously → spastic paralysis and tetanic muscle spasms
- This is the opposite of botulinum toxin (which blocks acetylcholine release at the NMJ → flaccid paralysis)
6. Sympathetic Involvement
- Tetanospasmin also affects preganglionic sympathetic neurons and parasympathetic centers
- Loss of inhibitory control of the autonomic nervous system leads to sympathetic overactivity:
- Markedly elevated circulating catecholamines
- Tachycardia, hypertension, hyperpyrexia
- Cardiac dysrhythmias, diaphoresis
- Autonomic dysfunction is the major cause of death in patients who survive the initial acute phase
7. Why Toxin Binding is Irreversible
- Tetanospasmin binds irreversibly at the synapse
- Recovery depends entirely on the growth of new axonal terminals - this is why clinical tetanus can persist for weeks to months
- Antitoxin (TIG/HTIG) can only neutralize unbound, circulating toxin - it cannot reverse already-bound toxin
8. Summary Diagram of Pathogenesis
Wound contamination with C. tetani spores
        ↓
Germination in anaerobic devitalized tissue
        ↓
Vegetative cells produce Tetanospasmin (A-B toxin, MW 150 kDa)
        ↓
Toxin released on cell lysis
        ↓
Heavy chain binds polysialoganglioside receptors on motor nerve endings
        ↓
Retrograde axonal transport to spinal cord / brainstem
        ↓
Trans-synaptic spread to inhibitory interneurons (Glycinergic / GABAergic)
        ↓
Light chain cleaves Synaptobrevin (SNARE protein)
        ↓
Block of Glycine + GABA release
        ↓
Unopposed motor neuron discharge
        ↓
Spastic paralysis + Tetanic spasms
  +
Autonomic dysfunction (sympathetic storm)
9. Clinical Correlation to Pathogenesis
| Pathogenic Event | Clinical Manifestation |
|---|---|
| Toxin affects short axon (facial) nerves first | Trismus (lockjaw) first - masseter spasm |
| Facial muscle hypertonia | Risus sardonicus (sardonic smile) |
| Descending spread to neck/trunk/limbs | Dysphagia, opisthotonos |
| Laryngeal/respiratory muscle spasm | Apnea, asphyxia - main cause of early death |
| Sympathetic neuron involvement | Tachycardia, hypertension, dysrhythmias |
| Sensory arc intact, inhibitory block | Spasms triggered by minor stimuli (touch, sound) |
| Mental status unaffected | Patient is fully conscious (key diagnostic feature) |