
DESCRIBE THE CONNECTIONS, FUNCTIONS AND EFFECTS OF LESIONS ON CORTICOCEREBELLUM (15) 2.
corticocerebellum neocerebellum connections diagram cerebellum functional divisions
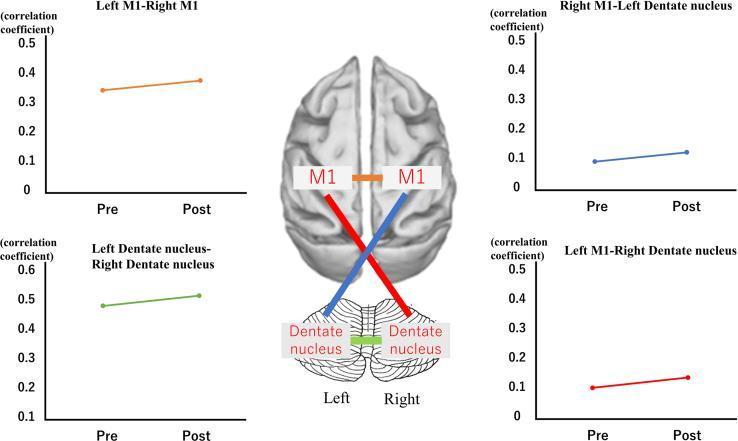
Educational medical graphic illustrating functional connectivity (FC) between the cerebral cortex and cerebellum, specifically the primary motor cortex (M1) and the dentate nuclei. A central anatomical diagram depicts a superior view of the brain and cerebellum with colored lines representing specific neural connections: orange for bilateral M1, green for bilateral dentate nuclei, blue for right M1 to left dentate nucleus, and red for left M1 to right dentate nucleus. Surrounding the diagram are four line graphs plotting the Fisher-transformed correlation coefficients during 'Pre' and 'Post' experimental phases. 1) Left M1-Right M1 shows an orange line increasing from ~0.34 to ~0.38. 2) Left Dentate-Right Dentate shows a green line rising from ~0.48 to ~0.51. 3) Right M1-Left Dentate shows a blue line rising from ~0.09 to ~0.12. 4) Left M1-Right Dentate shows a red line increasing from ~0.1 to ~0.14. This visualization characterizes the relationship between cortical motor areas and cerebellar nuclei, likely in the context of prism adaptation or motor learning research.
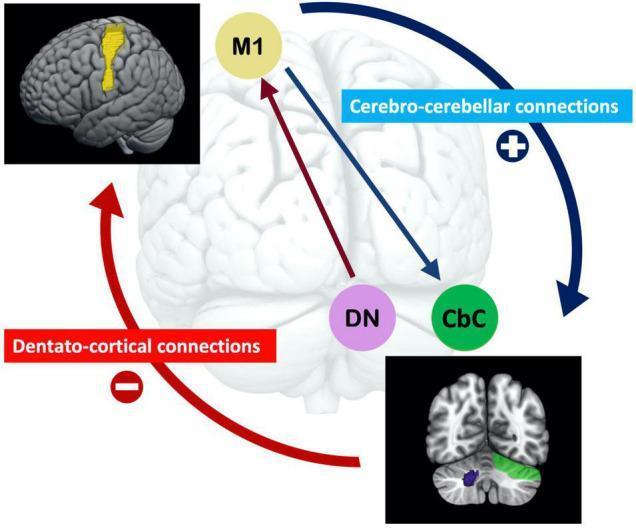
This medical illustration combines functional neuroanatomy diagrams with neuroimaging data to represent the pathways of cerebellar-cerebral functional connectivity. The central diagram outlines two primary circuits: the 'Cerebro-cerebellar connections' and 'Dentato-cortical connections.' The Cerebro-cerebellar pathway is depicted as an excitatory (marked with a '+') afferent circuit originating from the primary motor cortex (M1, highlighted in yellow) and projecting to the cerebellar cortex (CbC, highlighted in green). Conversely, the Dentato-cortical pathway is shown as an inhibitory (marked with a '-') efferent circuit originating from the dentate nucleus (DN, highlighted in purple) and projecting back toward the motor cortex. Two inset images provide anatomical context using MRI data: the top-left inset shows a lateral view of the cerebral cortex with the motor region highlighted in yellow; the bottom-right inset shows a coronal section of the cerebellum with the CbC and DN regions localized. The graphic demonstrates the neurological framework for visuomotor learning, where higher afferent connectivity correlates with accuracy and lower efferent inhibitory signals facilitate learning stability through disinhibition.
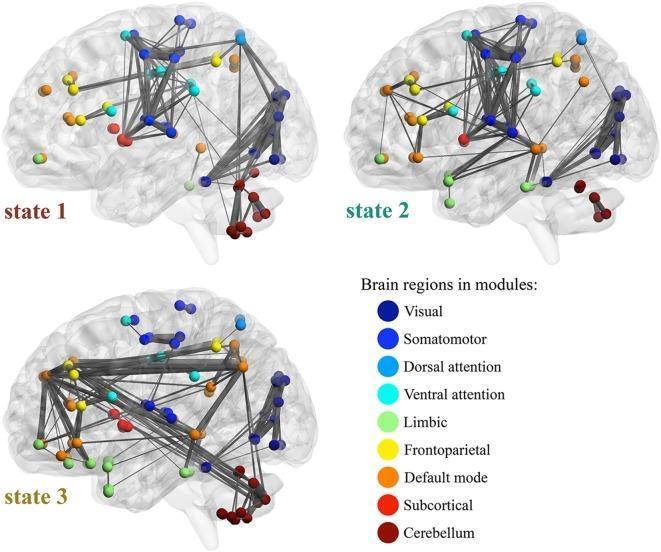
This diagnostic diagram illustrates three distinct Whole-Brain Functional Connectivity (WFC) states derived from resting-state functional MRI (fMRI) data. The visual presents three sagittal views of the human brain (labeled state 1, state 2, and state 3), displaying the top 200 functional connections as gray lines with varying widths indicating connectivity strength. Nodes are color-coded based on Yeo’s functional modules: visual (dark blue), somatomotor (blue), dorsal attention (light blue), ventral attention (cyan), limbic (light green), frontoparietal (yellow), default mode (orange), subcortical (red), and cerebellum (dark red). State 1 is characterized by high connectivity within and across visual, somatomotor, attention, and cerebellar modules. State 2 displays a shift toward increased connectivity within the limbic, default mode, and frontoparietal networks, with a relative decrease in cerebellar and sensory-attention links. State 3 shows a more segregated pattern, with prominent connectivity concentrated in the default mode network and across the limbic and cerebellar modules, while sensory and attention module interactions are markedly reduced. This visualization highlights the dynamic nature of large-scale brain networks and their varying architectural states.
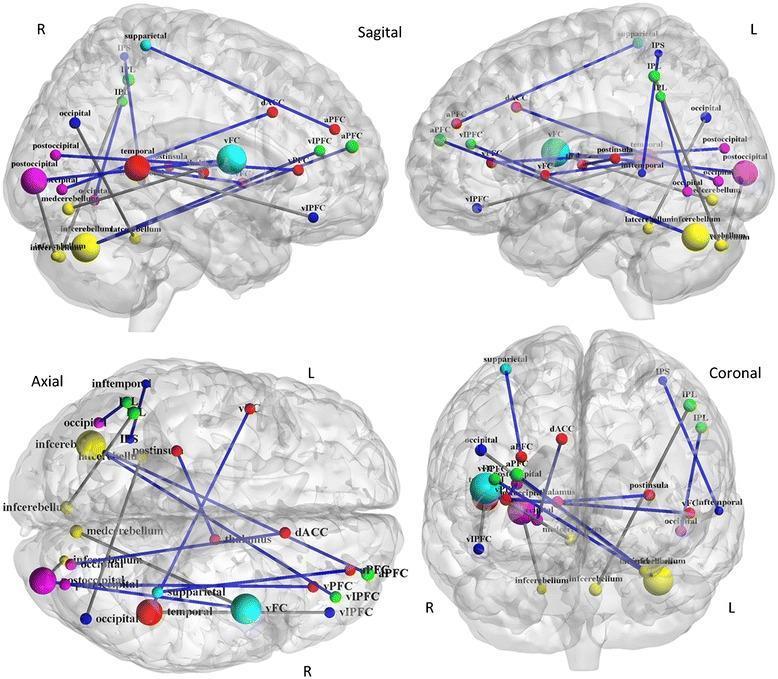
This functional connectivity diagram illustrates deception-modulated neural networks within a semi-transparent 3D brain model, shown in Sagittal (Right and Left), Axial, and Coronal views. Brain regions are represented as color-coded spheres (nodes) indicating six functional communities: Red (Cingulo-opercular network, including aPFC and dACC), Green (Fronto-parietal network), Dark Blue (Default mode network), Light Blue (Sensorimotor network), Purple (Occipital network), and Yellow (Cerebellum). Lines (edges) represent functional connectivities between these nodes. Blue lines indicate stronger functional connections, specifically showing positive modulation (increased connectivity) during lie-telling, while gray lines represent weaker or negatively modulated connections. Notable long-range connections are visible between the anterior prefrontal cortex (aPFC) and the cerebellum and occipital regions. This visualization highlights the distributed, multi-network nature of executive control and cognitive processes associated with deception, emphasizing the interplay between frontal control regions and posterior sensory/cerebellar networks.
Corticocerebellum (Neocerebellum / Cerebrocerebellum) - Connections, Functions, and Effects of Lesions
1. ANATOMICAL LOCATION
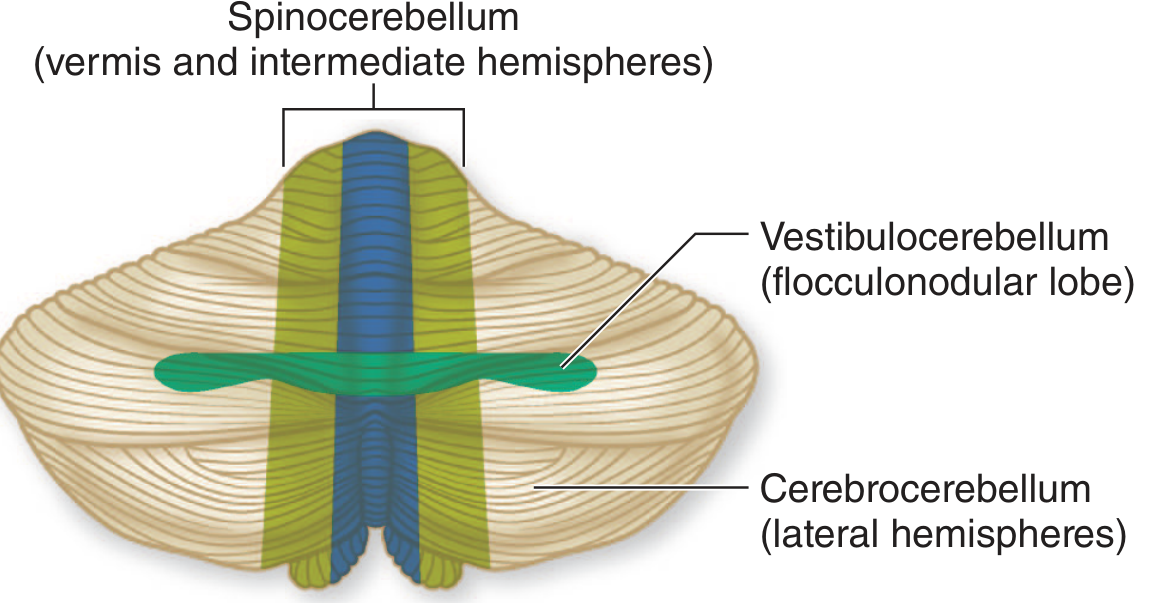
2. CONNECTIONS
A. Afferent (Input) Connections
| Source | Pathway | Peduncle |
|---|---|---|
| Cerebral cortex (motor, premotor, supplementary motor - Areas 4, 6) | Corticopontine fibers → Pontine nuclei → Pontocerebellar fibers | Middle cerebellar peduncle (brachium pontis) |
| Inferior olivary nucleus (contralateral) | Olivocerebellar fibers (climbing fibers) | Inferior cerebellar peduncle |
- The corticopontine projection is the dominant afferent. Fibers from the motor and premotor cortex descend through the internal capsule and cerebral peduncle to synapse in the ipsilateral pontine nuclei. From there, axons cross the midline and travel via the middle cerebellar peduncle to the contralateral cerebellar hemisphere.
- Input from the prefrontal, parietal, and temporal cortices also reaches the lateral hemisphere via this corticopontine-pontocerebellar relay, making the corticocerebellum a recipient of higher cognitive motor planning signals.
B. Efferent (Output) Connections
- Purkinje cells of the lateral hemisphere project (inhibitory, GABAergic) to the dentate nucleus
- Dentate nucleus neurons send excitatory fibers through the superior cerebellar peduncle (brachium conjunctivum)
- These fibers decussate at the level of the inferior colliculus (ventral tegmental decussation) in the midbrain
- Fibers ascend to the ventrolateral (VL) and ventral anterior (VA) nuclei of the contralateral thalamus; some synapse en route in the red nucleus (contralateral)
- Thalamic neurons project via thalamocortical radiations to the ipsilateral motor cortex (Areas 4 and 6) and supplementary motor cortex
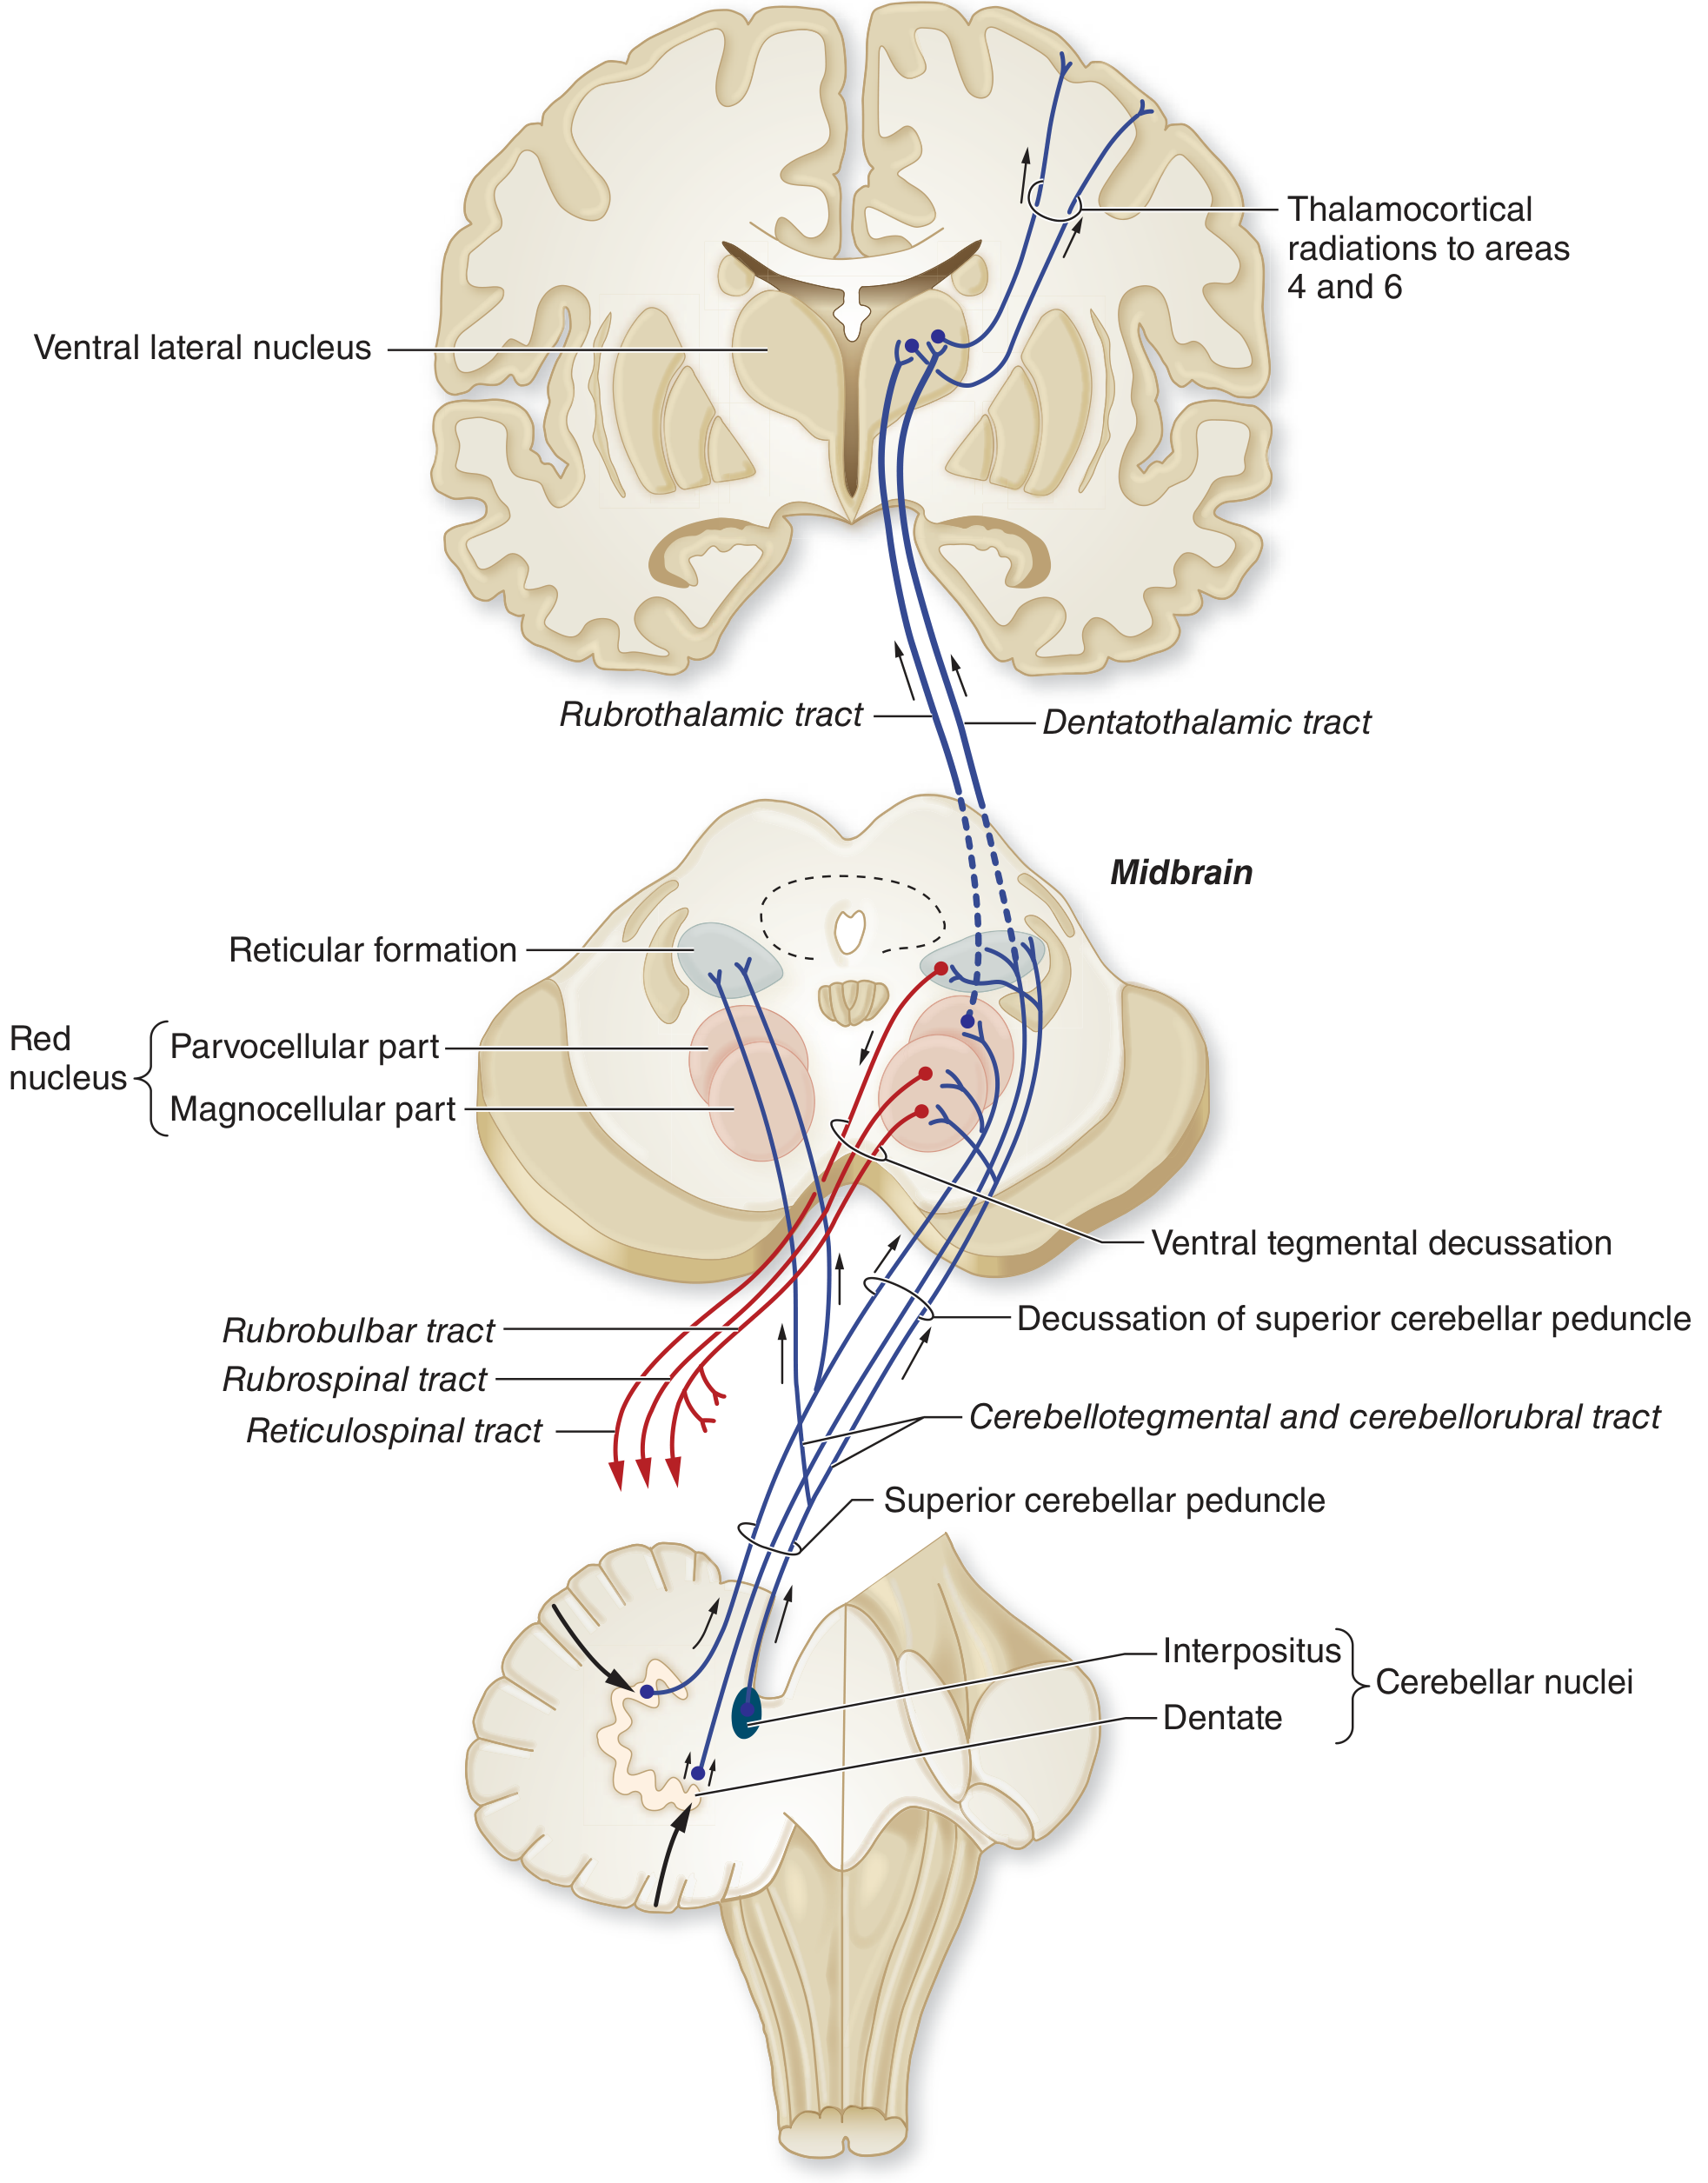
- Dentate nucleus → (decussates) → Red nucleus → Central tegmental fasciculus → Inferior olivary nucleus → (via inferior cerebellar peduncle) → back to cerebellar cortex
- Lesions in the central tegmental fasciculus component produce oculopalatal tremor and hypertrophy of the contralateral inferior olive
| Connection Type | Pathway | Structure |
|---|---|---|
| Afferent | Cortex → Corticopontine → Pontine nuclei → Middle cerebellar peduncle | Lateral hemisphere |
| Afferent | Inferior olive → Inferior cerebellar peduncle (climbing fibers) | Lateral hemisphere |
| Intrinsic | Lateral hemisphere Purkinje cells → Dentate nucleus | Dentate nucleus |
| Efferent | Dentate → Superior cerebellar peduncle → Decussation → VL/VA thalamus → Motor cortex | Thalamocortical to Areas 4 & 6 |
| Efferent | Dentate → Red nucleus → Rubrospinal tract | Red nucleus |
3. FUNCTIONS
-
Motor planning and initiation - The dentate nucleus neurons fire just before the onset of a voluntary movement, indicating a role in planning and initiating volitional movements rather than executing them in real time. It works in concert with the premotor and supplementary motor cortices.
-
Coordination of skilled (fine) voluntary movements - Especially of the distal limbs (hands, fingers). It coordinates the timing, force, and direction of movements initiated at the cortical level.
-
Procedural memory - Storage and retrieval of learned motor skills (e.g., learning to play piano, typing).
-
Speech articulation - Coordinates the complex, rapid sequential muscle movements needed for fluent speech.
-
Timing of movements - The cerebellum acts as a "timing device," ensuring that multi-joint movements are properly sequenced and timed.
-
Error correction - Compares the intended motor command (efference copy) with sensory feedback; detects and corrects errors in ongoing movements.
4. EFFECTS OF LESIONS
A. Decomposition of Movement (Ataxia)
- Smooth, coordinated multi-joint movements break down into their component parts - movements are performed sequentially rather than simultaneously.
B. Intention Tremor (Action Tremor)
- A coarse, low-frequency tremor (~3-5 Hz) that appears or worsens as the limb approaches its target (increases at end of voluntary movement). Absent at rest. Caused by inability to dampen oscillations during voluntary movement.
- More pronounced when the dentate nucleus is included in the lesion.
C. Dysmetria
- Hypermetria - overshooting the target (most common)
- Hypometria - undershooting the target
- Tested by finger-nose-finger test and heel-shin test.
D. Dysdiadochokinesia
- Inability to perform rapid alternating movements (e.g., pronation-supination of the forearm). Movements are irregular in rate and amplitude.
E. Rebound Phenomenon (Holmes' Rebound)
- When a resisted flexion of the forearm is suddenly released, the patient cannot check the movement promptly, resulting in the limb hitting the face or chest.
F. Dysarthria (Cerebellar / Scanning Speech)
- Speech is slow, slurred, with irregular volume and rhythm - words are broken into syllables with equal stress ("scanning dysarthria"). Caused by incoordination of the pharyngeal, laryngeal, and respiratory muscles.
G. Nystagmus
- Horizontal nystagmus, particularly with gaze toward the side of the lesion.
H. Hypotonia
- Decreased muscle tone on the ipsilateral side - flaccid limbs, pendular reflexes.
I. Asthenia
- Weakness or easy fatigability of ipsilateral limbs due to loss of facilitation of motor neurons.
J. Cognitive/Behavioral Effects (Cerebellar Cognitive Affective Syndrome)
- With extensive lateral hemisphere damage, deficits in executive function, working memory, spatial processing, and affect can occur (reflecting disruption of cerebrocerebellar loops involved in cognition).
5. SUMMARY
| Feature | Corticocerebellum (Neocerebellum) |
|---|---|
| Location | Lateral hemispheres, posterior lobe |
| Deep nucleus | Dentate |
| Main afferent | Corticopontine → Pontine nuclei → Middle cerebellar peduncle |
| Main efferent | Superior cerebellar peduncle → Decussation → VL thalamus → Motor cortex (Areas 4 & 6) |
| Function | Motor planning, fine skilled movement, procedural memory, speech articulation |
| Lesion effects | Ipsilateral intention tremor, dysmetria, dysdiadochokinesia, decomposition of movement, scanning dysarthria, rebound phenomenon, hypotonia |
Key clinical principle: A lesion in one cerebellar hemisphere causes incoordination on the same (ipsilateral) side - because the pathway from the cerebellar nuclei to the thalamus is crossed, and the corticospinal tract is also crossed; the two crossings cancel each other out.
- Adams and Victor's Principles of Neurology, 12th Edition, pp. 121-124