Want to learn ECG frim basics
Reading File
Finding Sources
Finding Sources
Finding Sources
Finding Sources
Finding Sources
Reading File
Finding Sources
Finding Sources
Reading File
Finding Sources
Reading File
Reading File
Finding Sources
Finding Sources
Reading File
Reading File
Reading File
Loading Image
Loading Image
Reading File
Loading Image
Reading File
Reading File
Now I have enough material from authoritative textbooks (Harrison's 22e, Costanzo Physiology, Gray's Anatomy, Braunwald's) to deliver a thorough beginner's guide to ECG. Let me compose the full response.
ECG from the Basics - A Complete Beginner's Guide
1. What is an ECG?
The electrocardiogram (ECG or EKG) is a recording of the tiny voltage differences on the body surface that reflect the electrical activity of the heart. Because the atria and ventricles don't all depolarize at the same instant - each region fires in a specific sequence - voltage differences arise between areas, and these can be detected by electrodes placed on the skin.
Think of it as a "video" of the heart's electrical events, played out on a time axis.
2. The Cardiac Conduction System - Why the ECG looks the way it does
To understand every wave on the ECG, you first need to know the path electricity travels through the heart.
| Structure | Location | Function |
|---|---|---|
| SA node (pacemaker) | Junction of SVC and right atrium | Initiates each beat (~60-100/min) |
| AV node | Near coronary sinus opening, above tricuspid valve | Delays conduction to let atria finish contracting before ventricles fire |
| Bundle of His | Along membranous interventricular septum | Carries impulse toward apex |
| Right bundle branch | Right side of IVS → right ventricle | Activates RV |
| Left bundle branch | Left side of IVS → left ventricle | Activates LV |
| Purkinje fibers | Subendocardial network throughout both ventricles | Rapid, coordinated ventricular contraction from apex upward |
The result is a unidirectional wave of excitation flowing: SA node → atria → AV node → His bundle → bundle branches → Purkinje fibers → ventricular myocardium. Each of these steps leaves a footprint on the ECG.
(Source: Gray's Anatomy for Students, p. 6366-6410)
3. The ECG Waveforms - What Each Part Means
Here is the classic ECG waveform:
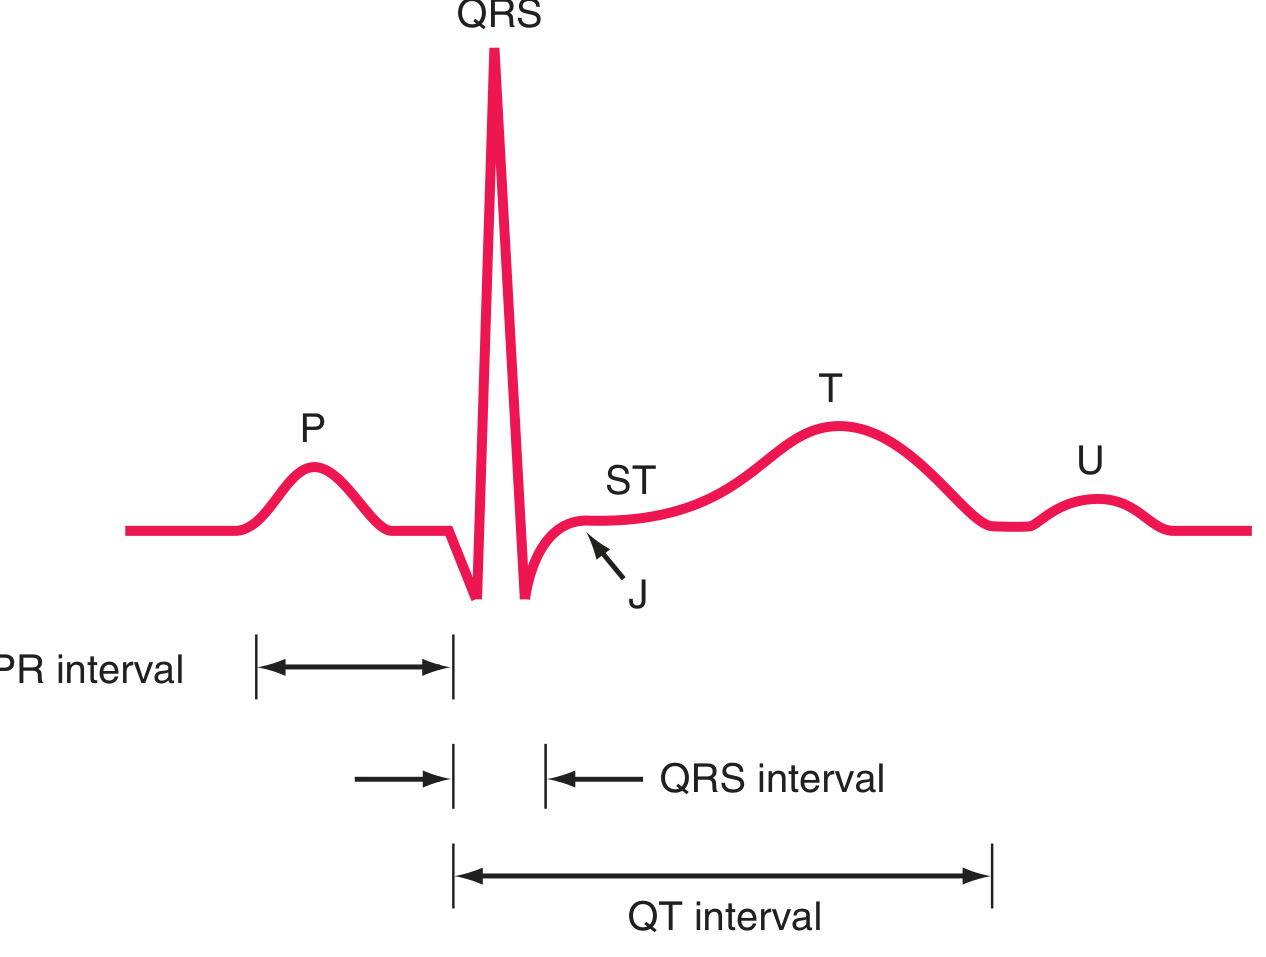
(Harrison's Principles of Internal Medicine 22e, Fig. 247-2)
And another excellent textbook diagram:

(Costanzo Physiology, Fig. 4.17)
The Waves
| Wave / Segment | What it represents |
|---|---|
| P wave | Atrial depolarization (SA node fires → both atria contract) |
| PR segment | Conduction delay through AV node (flat/isoelectric line) |
| QRS complex | Ventricular depolarization (all ventricular muscle activates). Atrial repolarization is "buried" inside QRS and not visible. |
| ST segment | Ventricular plateau phase - all cells are depolarized, no net current. Should be isoelectric (flat). |
| T wave | Ventricular repolarization (cells resetting for the next beat) |
| U wave | Small wave after T; possibly represents repolarization of Purkinje fibers or papillary muscles (≤1 mm, same polarity as T) |
Key Intervals and Normal Values
| Interval | What it measures | Normal |
|---|---|---|
| RR interval | Time between consecutive beats - used to calculate heart rate | Depends on rate |
| PR interval | Atria-to-ventricle conduction time | 120-200 ms (0.12-0.20 s) |
| QRS duration | Ventricular depolarization time | <100-110 ms (<0.10-0.11 s) |
| QT interval | Total ventricular electrical activity (depolarization + repolarization) | <450 ms (men), <460 ms (women); corrected for rate (QTc) |
| ST segment | Isoelectric; elevation or depression = pathology | Flat, at baseline |
Calculating heart rate from ECG:
- Count the large squares (each = 0.20 s) between two R waves
- Divide 300 by that number → heart rate in bpm
- Example: 4 large squares between R waves → 300/4 = 75 bpm
(Sources: Harrison's 22e, p. 1267; Costanzo Physiology, p. 4499-4519; Medical Physiology, p. 804-817)
4. ECG Paper - Reading the Grid
ECG paper is printed on graph paper with 1-mm squares:
| Measurement | Horizontal (time) | Vertical (voltage) |
|---|---|---|
| 1 small square | 40 ms (0.04 s) | 0.1 mV |
| 1 large square (5 small) | 200 ms (0.20 s) | 0.5 mV |
| Standard calibration | Recording speed 25 mm/s | 1 mV = 10 mm tall |
5. The 12-Lead ECG - The 12 "Camera Angles"
A standard ECG uses 12 leads, each viewing the heart's electrical activity from a different angle - like 12 cameras surrounding the heart. This is why the same QRS can look upright in one lead and inverted in another.
The Two Groups of Leads
6 Limb Leads - view the heart in the frontal (vertical) plane:
- Lead I - between left and right arm
- Lead II - between right arm and left leg (most commonly used for rhythm monitoring; P wave is normally positive here)
- Lead III - between left arm and left leg
- aVR - augmented, from right arm (P wave is normally negative here)
- aVL - augmented, from left arm
- aVF - augmented, from left leg (foot)
6 Precordial (Chest) Leads - view the heart in the horizontal plane:
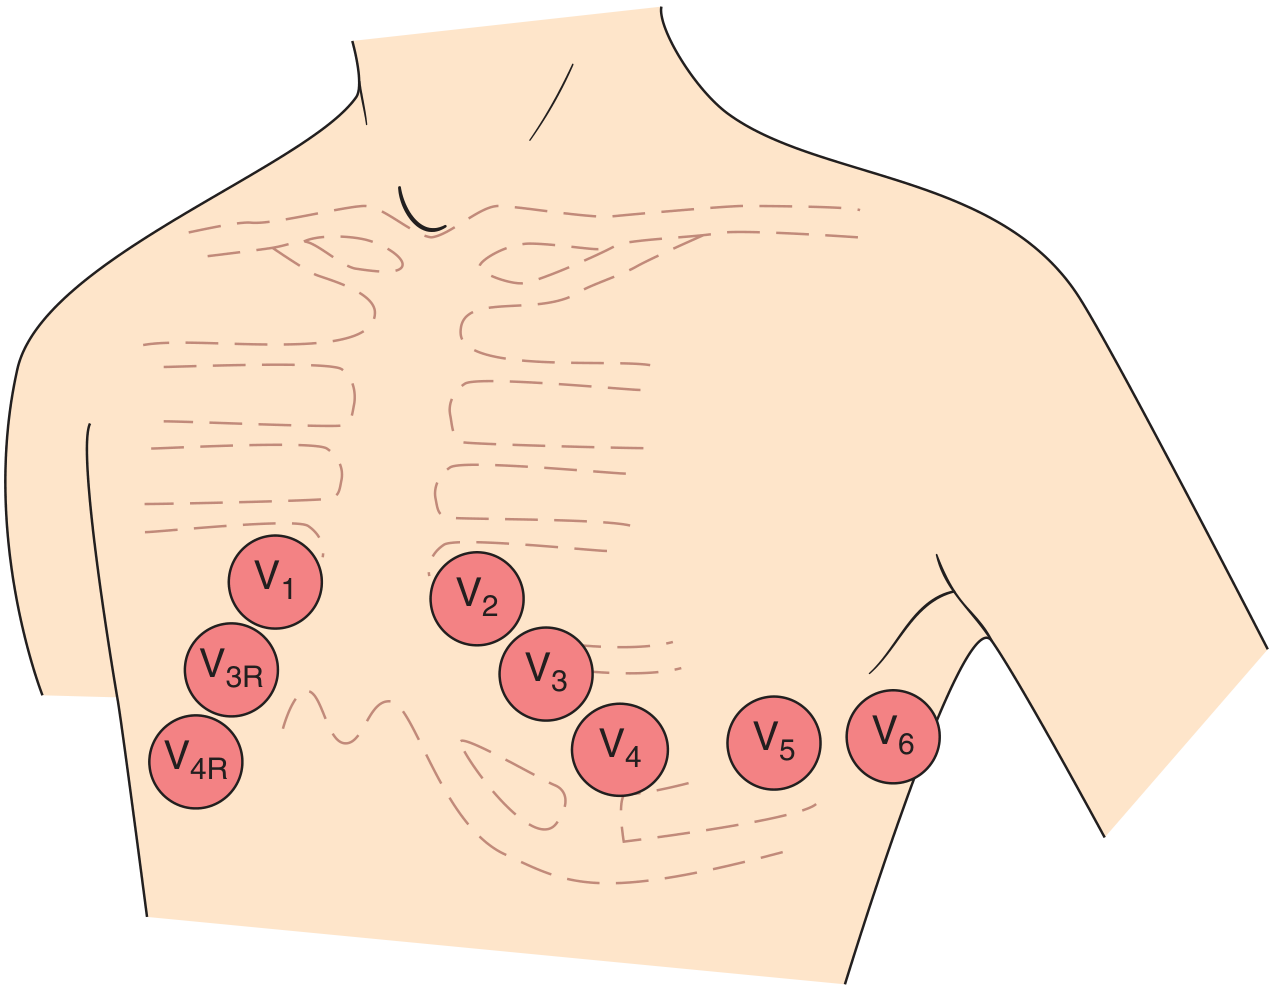
(Harrison's 22e, Fig. 247-5)
| Lead | Exact Placement |
|---|---|
| V1 | 4th intercostal space, right sternal border |
| V2 | 4th intercostal space, left sternal border |
| V3 | Between V2 and V4 |
| V4 | 5th intercostal space, midclavicular line |
| V5 | Anterior axillary line, same level as V4 |
| V6 | Midaxillary line, same level as V4 and V5 |
Which Leads "Look At" Which Part of the Heart?
| Leads | Area of heart | Coronary artery |
|---|---|---|
| II, III, aVF | Inferior wall | Right coronary artery (RCA) |
| I, aVL, V5, V6 | Lateral wall | Left circumflex (LCx) |
| V1-V4 | Anterior wall | Left anterior descending (LAD) |
| V1-V2 | Septal | LAD septal branches |
This "territory" concept is why ECG can localize a heart attack to a specific coronary artery.
6. How Waves Are Generated - The Polarity Rule
A fundamental rule: if a wave of depolarization moves TOWARD the positive pole of a lead, the deflection is UPRIGHT (positive). If it moves AWAY, the deflection is DOWNWARD (negative).
This explains:
- P wave is upright in Lead II - sinus node fires, atrial depolarization spreads down-left toward the positive pole of II
- P wave is negative in aVR - the same wave moves away from aVR's positive pole
- V1 shows a small r then deep S - initial septal depolarization moves right (toward V1) giving a small r wave, then main LV activation moves leftward (away from V1) giving a deep S wave
- V6 shows a small q then tall R - septal depolarization moves left-to-right (away from V6) giving a small q, then LV activation moves toward V6 giving a tall R wave
(Harrison's 22e, p. 1292-1323)
7. The Normal ECG - A Systematic Approach
Harrison's 22e recommends analyzing 14 parameters in every ECG in order:
- Calibration & technical quality - Is the 1 mV calibration mark present? Are leads correctly placed? Any artifacts?
- Rhythm - Regular or irregular? P waves present before each QRS?
- Heart rate - Normal: 60-100 bpm
- PR interval - Normal: 120-200 ms
- QRS duration - Normal: <110 ms
- QT/QTc interval - Correct for heart rate
- Mean QRS axis - Normal: -30° to +100°
- P waves - Morphology, amplitude, duration
- QRS voltages - Low or high voltage?
- Precordial R-wave progression - R wave should grow V1→V6 (transition zone at V3-V4)
- Abnormal Q waves - Pathologic Q waves suggest prior infarction
- ST segments - Elevation (injury) or depression (ischemia)?
- T waves - Inversion, peaked?
- U waves - Prominent U (hypokalemia)?
(Harrison's Principles of Internal Medicine 22e, p. 1592)
8. The QRS Axis
The mean QRS electrical axis describes the average direction ventricular depolarization travels in the frontal plane. It is plotted on the hexaxial reference system (leads I, II, III, aVR, aVL, aVF at defined angles).
| Axis | Degree range | Common causes |
|---|---|---|
| Normal | -30° to +100° | Healthy heart |
| Left axis deviation (LAD) | More negative than -30° | LVH, left anterior fascicular block, inferior MI |
| Right axis deviation (RAD) | More positive than +100° | RVH, lateral MI, left posterior fascicular block |
Quick trick: If QRS is upright in Lead I and upright in aVF → normal axis. If QRS is upright in I but negative in aVF → LAD. If QRS is negative in I → RAD.
9. Key ECG Abnormalities to Know (Overview)
| Finding | What it suggests |
|---|---|
| PR > 200 ms | 1st degree AV block |
| Wide QRS >120 ms | Bundle branch block or ventricular origin |
| ST elevation | Acute MI (STEMI), pericarditis |
| ST depression | Ischemia, posterior MI |
| Pathologic Q wave (>40 ms wide or >25% R height) | Prior myocardial infarction |
| Tall peaked P waves (≥2.5 mm) | Right atrial enlargement |
| Broad notched P waves | Left atrial enlargement |
| Prolonged QTc | Drug effect, electrolyte disturbance, inherited channelopathy |
| Prominent U waves | Hypokalemia |
| Tall R in V1 with RAD | Right ventricular hypertrophy |
10. Relationship Between Action Potential and ECG
Each wave corresponds to a phase of the ventricular action potential:
| Action Potential Phase | ECG Correlate |
|---|---|
| Phase 0 (rapid Na+ depolarization) | Start of QRS |
| Phase 2 (plateau, Ca2+ entry) | ST segment (isoelectric) |
| Phase 3 (K+ repolarization) | T wave |
Drugs or electrolytes that prolong phase 2 or 3 (e.g., amiodarone, hypocalcemia) lengthen the QT interval. Drugs that impair phase 0 (e.g., flecainide, hyperkalemia) widen the QRS.
(Harrison's 22e, p. 1256; Katzung Pharmacology, p. 1111-1119)
Summary: The ECG at a Glance
SA node fires
    ↓
P wave (atrial depolarization)
    ↓
PR segment (AV node delay)
    ↓
QRS complex (ventricular depolarization)
    ↓
ST segment (plateau - all cells depolarized)
    ↓
T wave (ventricular repolarization)
Normal values to memorize:
- HR: 60-100 bpm
- PR: 120-200 ms
- QRS: <110 ms
- QTc: <450 ms (men), <460 ms (women)
- Axis: -30° to +100°
This is the foundation. From here you can build toward reading arrhythmias (AF, VT, heart blocks), ischemia patterns (STEMI, NSTEMI), hypertrophy, and bundle branch blocks. Would you like to go deeper into any of these topics?
This is a shared conversation. Sign in to Orris to start your own chat.