
Augmentation in labor
labor augmentation oxytocin uterine contractions partogram
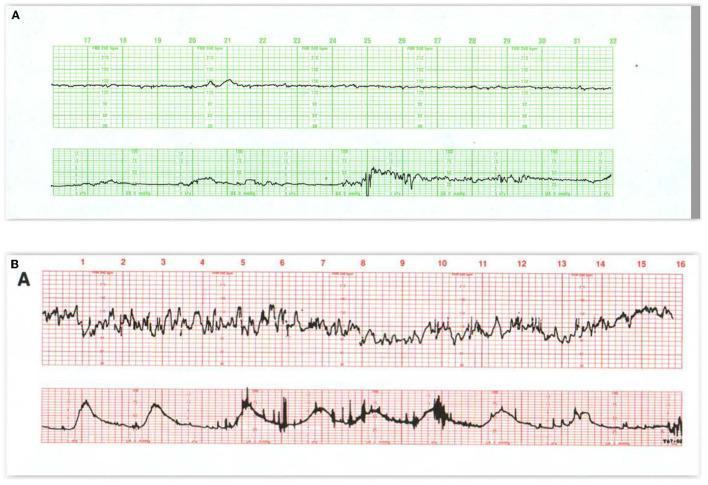
This diagnostic image displays two comparative cardiotocography (CTG) tracings monitoring fetal heart rate (FHR) and uterine contractions during labor. Panel A (top, green grid) illustrates a pattern of diminished baseline FHR variability, often associated with maternal narcotic administration. The FHR tracing shows minimal beat-to-beat fluctuations and small accelerations that occur primarily in synchronization with uterine contractions, which are depicted on the lower channel. Panel B (bottom, red grid) demonstrates a 'saltatory' pattern characterized by exaggerated, high-amplitude FHR variability (exceeding 25 bpm). The uterine contraction channel below it shows frequent activity. Between the 5-minute and 10-minute markers, a prolonged, erratic deceleration in the FHR is visible, representing a fetal response to excessive uterine activity or subacute hypoxia. Following this event, the FHR baseline briefly exceeds its previous level during recovery. These tracings serve as educational tools for distinguishing between pharmacologically induced FHR changes and autonomic stress responses to uterine hyperstimulation.
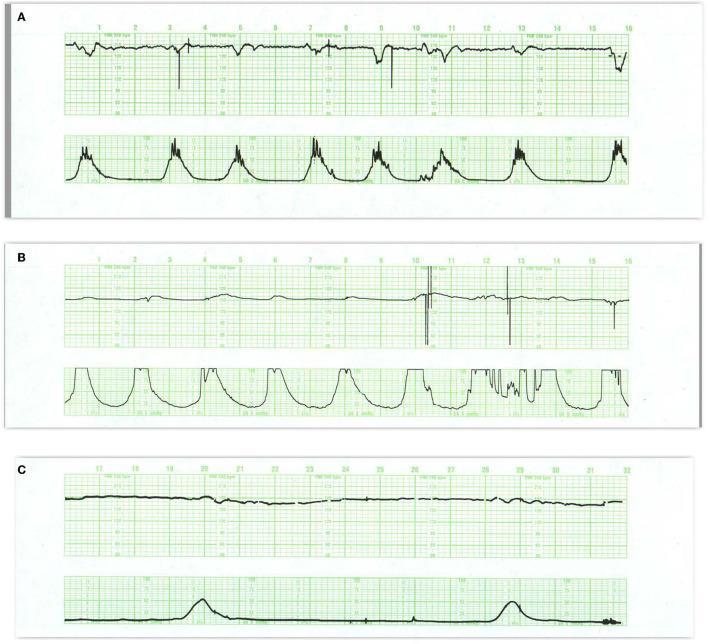
This diagnostic image displays a three-panel cardiotocogram (CTG) used for electronic fetal monitoring during labor. The panels (A, B, and C) demonstrate fetal heart rate (FHR) tracings (top rows) and uterine contraction activity (bottom rows). Panel A illustrates fetal tachycardia (baseline >160 bpm) with diminished short-term variability, showing small variable decelerations followed by 'overshoot' accelerations, typically seen in maternal febrile conditions. Panel B depicts a stable FHR baseline during the second stage of labor, characterized by frequent uterine contractions and maternal pushing without significant decelerations, indicating normal neurological control. Panel C reveals a pathological tracing featuring sustained baseline tachycardia, minimal variability, and small variable decelerations with compensatory overshoots and an unstable baseline following contractions. The horizontal scale represents time (16 minutes per panel), and the vertical scale for FHR is 30 bpm/cm. These tracings illustrate key obstetric concepts, including the differentiation between resilient fetal responses and ominous patterns suggestive of potential fetal infection or hypoxic-ischemic distress.
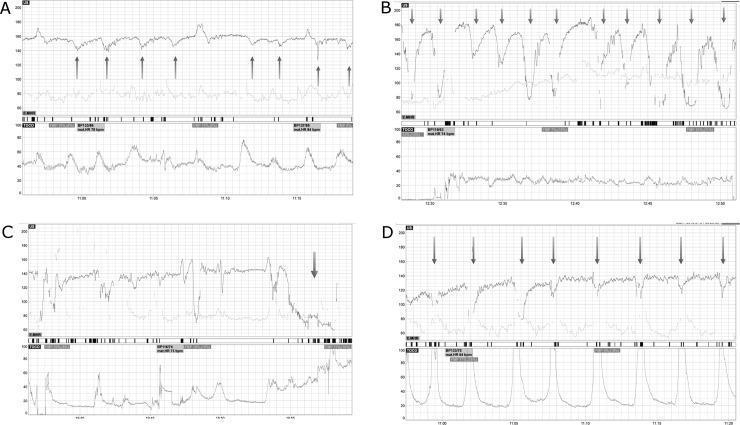
This diagnostic image displays four panels (A-D) of Cardiotocography (CTG) tracings, used in obstetrics to monitor fetal well-being during labor. Each panel consists of two primary waveforms: the upper tracing represents the Fetal Heart Rate (FHR) in beats per minute (bpm), and the lower tracing (TOCO) indicates uterine contraction activity. Panel A illustrates late decelerations, characterized by a gradual decrease in FHR that starts after the peak of a contraction and returns to baseline after the contraction ends. Panel B demonstrates variable decelerations, showing abrupt, irregular drops in FHR of varying shape and duration, often associated with umbilical cord compression. Panel C shows a prolonged deceleration, where the FHR drop lasts more than 2 minutes but less than 10 minutes. Panel D displays early decelerations, which are symmetrical, shallow decreases in FHR that mirror the timing of uterine contractions, typically representing benign fetal head compression. The tracings include annotation arrows and grid lines for temporal and heart rate quantification, serving as a critical tool for identifying fetal hypoxia or distress.
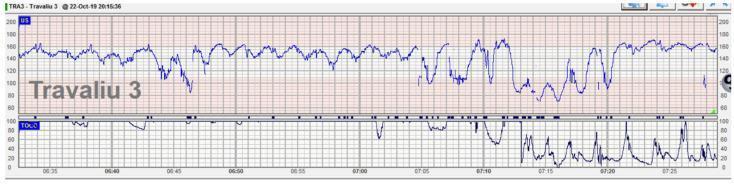
This diagnostic image is a Cardiotocograph (CTG) trace, representing electronic fetal monitoring during labor. The upper panel displays the Fetal Heart Rate (FHR) in beats per minute (bpm), and the lower panel represents uterine activity or contractions via tocodynamometry (TOCO). The FHR tracing initially shows a baseline rate between 140-160 bpm with moderate variability and intermittent variable decelerations. A clinically significant event occurs around time marker 07:05, characterized by a sudden, prolonged deceleration where the fetal heart rate drops below 100 bpm and remains depressed for several minutes, indicating potential fetal distress. Simultaneously, the lower TOCO trace shows an increase in uterine contraction frequency and intensity, reaching peaks of nearly 100 units. This specific pattern is classically associated with umbilical cord prolapse or severe cord compression. This visual material is used in obstetrics and gynecology to teach intrapartum fetal assessment, identification of non-reassuring heart rate patterns, and emergency obstetric management.
augmentation of labor oxytocin
Augmentation of Labor
Definition
Indications - When to Augment
- Hypotonic uterine dysfunction - inadequate contraction frequency/strength
- Protraction disorders - slower than normal rate of cervical dilation or descent
- Arrest disorders - complete cessation of cervical dilation or fetal descent
- Prolonged latent phase - >20 hours in nulliparas, >14 hours in multiparas
| Factor | Odds Ratio | 95% CI |
|---|---|---|
| Premature rupture of membranes | 3.8 | 3.2-4.5 |
| Nulliparity | 3.8 | 3.3-4.3 |
| Labor induction | 3.3 | 2.9-3.7 |
| Maternal age >35 yr | 3.0 | 2.6-3.6 |
| Fetal weight >4 kg | 2.2 | 1.8-2.7 |
| Hypertensive disorder | 2.1 | 1.8-2.6 |
| Hydramnios | 1.9 | 1.5-2.3 |
| Fertility treatment | 1.8 | 1.4-2.4 |
Labor Abnormalities Requiring Augmentation
1. Prolonged Latent Phase
- Defined as >20 hours (nullipara) or >14 hours (multipara)
- Causes: excessive sedation, premature epidural, unfavorable cervical status, myometrial dysfunction
- Management: therapeutic narcosis (Friedman's preference) or oxytocin augmentation - both result in resumption of normal cervical dilation
- Associated with increased risk of cesarean delivery, 3rd/4th degree lacerations, febrile morbidity, and intrapartum blood loss
2. Protraction Disorders
- Slower-than-normal rate of cervical dilation or descent
- Oxytocin augmentation is the standard approach; early research by Friedman showed limited benefit, but subsequent trials demonstrated value with adequate dosing
3. Arrest Disorders
- Complete cessation of active-phase dilation or descent
- Frequently associated with cephalopelvic disproportion (CPD)
- Rouse protocol: achieve >200 Montevideo units sustained; minimum 4 hours of augmented labor with adequate contractions before proceeding to cesarean delivery; if 200 MVU cannot be achieved, minimum 6 hours before cesarean - this yielded a 92% vaginal delivery rate with no serious adverse outcomes
Pharmacological Augmentation: Oxytocin
Mechanism
- Acts via G protein-coupled receptors and the phosphoinositide-calcium second-messenger system
- Contracts uterine smooth muscle
- Stimulates release of prostaglandins and leukotrienes, which further augment contractions
- In small doses: increases frequency and force of contractions
- At higher doses: produces sustained tetanic contraction
Pharmacokinetics
- Administered intravenously (infusion pump) for augmentation/induction
- Half-life: 5 minutes (Katzung) / 12-15 minutes (Goodman & Gilman)
- Steady-state uterine response achieved at ~30 minutes
- Not bound to plasma proteins; rapidly eliminated by kidneys and liver
Dosing for Augmentation
- Standard infusion rate: 10 mU/min to augment hypotonic contractions
- Doses >40 mU/min rarely effective when lower doses fail
- Both low-dose (starting 0.5-2 mU/min, advanced every 30-60 min) and high-dose protocols (starting 6 mU/min) are used
- Goal: physiologic contraction pattern (3-5 contractions per 10 min), ideally >200 Montevideo units
- Weight/BMI does not affect dosing - given at the same rate regardless of maternal weight
Oxytocin Challenge Test
- Used antepartum to assess placental reserve
- Standardized oxytocin infusion is given and fetal heart rate response monitored
- Abnormal response (late decelerations) may indicate fetal hypoxia and warrant cesarean delivery
Adjuncts to Oxytocin
- Often performed alongside oxytocin augmentation
- Accelerates labor progression by releasing prostaglandins and improving contraction efficiency
- Synthetic PGE1 analogue used for cervical ripening before augmentation
- Oral (100 mcg) or vaginal (25 mcg) routes
- Must be discontinued at least 3 hours before initiating oxytocin (risk of hyperstimulation)
Monitoring During Augmentation
- Continuous electronic fetal monitoring (EFM) is mandatory
- Watch for uterine hyperstimulation: >5 contractions in 10 minutes (tachysystole)
- Partogram: graphic display of cervical dilation vs. time is an essential adjunct - WHO trials show it reduces prolonged labors and unnecessary cesarean rates
- Intrauterine pressure catheter (IUPC): can measure Montevideo units directly; however, partograms have a stronger evidence basis; randomized trials show no difference in outcomes vs. external monitoring
CTG Patterns to Monitor:
Complications of Oxytocin Augmentation
| Complication | Mechanism |
|---|---|
| Uterine hyperstimulation / tachysystole | Over-stimulation of myometrium |
| Fetal distress / hypoxia | Decreased uterine-placental perfusion during hyperstimulation |
| Uterine rupture | Forced passage through incompletely dilated cervix; especially with prior uterine surgery |
| Placental abruption | Excessive uterine contractility |
| Water intoxication / hyponatremia | Antidiuretic effect via vasopressin V2 receptor activation (especially with hypotonic IV fluids) |
| Hypotension + reflex tachycardia | Vasodilatory action; worsened by deep anesthesia |
| Postpartum hemorrhage | Paradoxically, a 2024 meta-analysis (PMID 38910114) found an association between oxytocin augmentation and PPH |
Management of Hyperstimulation
- Discontinue oxytocin immediately - given the short half-life (5-12 min), effects dissipate rapidly
- Restart at half the dose at which hyperstimulation occurred once resolved
- Maintain left lateral decubitus position; administer IV fluids; consider tocolysis if needed
Contraindications
- Fetal distress
- Fetal malpresentation
- Placental abruption
- Predispositions for uterine rupture (previous extensive uterine surgery, classical cesarean)
- Confirmed cephalopelvic disproportion (CPD)
Key Evidence Update (2025)
Summary - Key Points
- Augmentation = stimulating insufficient contractions after spontaneous labor onset
- Oxytocin is the drug of choice; 10 mU/min for hypotonic dysfunction
- Goal: contraction pattern of >200 Montevideo units; minimum 4-6 hours of adequate augmentation before cesarean
- Continuous EFM and partogram are essential monitoring tools
- Main risks: hyperstimulation, fetal distress, water intoxication, uterine rupture
- Oxytocin has a short half-life - if hyperstimulation occurs, stop the infusion and effects resolve quickly