
Difference in ecg in svt and sinus tachy
12 lead ECG comparison sinus tachycardia and paroxysmal supraventricular tachycardia regular narrow complex P waves
"supraventricular tachycardia" AND electrocardiography
sinus tachycardia versus supraventricular tachycardia ECG features guideline
ECG: sinus tachycardia vs paroxysmal SVT
| Feature | Sinus tachycardia | SVT - usually AVNRT/AVRT |
|---|---|---|
| Rate | Usually 100-150/min, but can be higher | Commonly 150-250/min |
| Onset and offset | Gradual acceleration and slowing | Abrupt start and abrupt termination |
| Rhythm | Regular, with slight beat-to-beat variability, often varies with activity, pain, fever, breathing | Very regular and relatively fixed rate |
| P waves | Normal sinus P before every QRS: upright in II, III, aVF; negative in aVR | Often not visible because buried in QRS/T. In typical AVNRT, may see pseudo-R′ in V1 or pseudo-S waves in II, III, aVF. In AVRT, retrograde P may follow QRS |
| PR interval | Usually normal or slightly shorter as rate increases | May be difficult to identify; often a short RP tachycardia in typical AVNRT |
| QRS | Usually narrow, unless baseline bundle-branch block | Usually narrow, though may be wide with aberrancy or pre-excitation |
| Underlying trigger | Physiologic response: fever, hypovolemia, pain, anxiety, sepsis, anemia, hypoxia, exercise, etc. | Re-entry arrhythmia, often occurs without an ongoing physiologic driver |
| Response to vagal maneuvers/adenosine | Usually slows gradually but does not terminate | AVNRT/AVRT often terminates abruptly or transient AV block reveals the rhythm. This must be done under clinical supervision |
- Visible normal P wave before each QRS + gradual rate changes suggests sinus tachycardia.
- Sudden, very regular narrow-complex tachycardia with hidden or retrograde P waves suggests SVT.
Show ECG examples of sinus tachycardia versus SVT
ECG strip sinus tachycardia 12 lead normal P waves
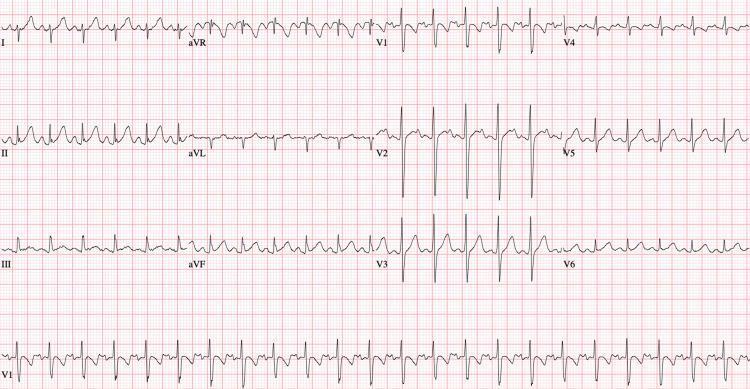
This diagnostic image is a 12-lead electrocardiogram (ECG) demonstrating a normal sinus rhythm in a pediatric patient following pharmacological conversion from idiopathic ventricular tachycardia. The tracing shows a regular heart rate of approximately 110 beats per minute. Key features include identifiable P waves preceding every QRS complex with a consistent PR interval, indicating successful restoration of sinus rhythm. The QRS complexes are narrow (<100 ms), suggesting normal ventricular conduction without bundle branch block or accessory pathway evidence. T waves are prominent and upright across most leads, particularly in the precordial leads V2-V4. The rhythm strip (lead V1) at the bottom confirms rhythmic consistency and the presence of P-QRS-T sequences. This ECG serves as an educational reference for normal cardiac electrical activity after the resolution of a wide complex tachycardia (WCT) using antiarrhythmic therapy such as procainamide.
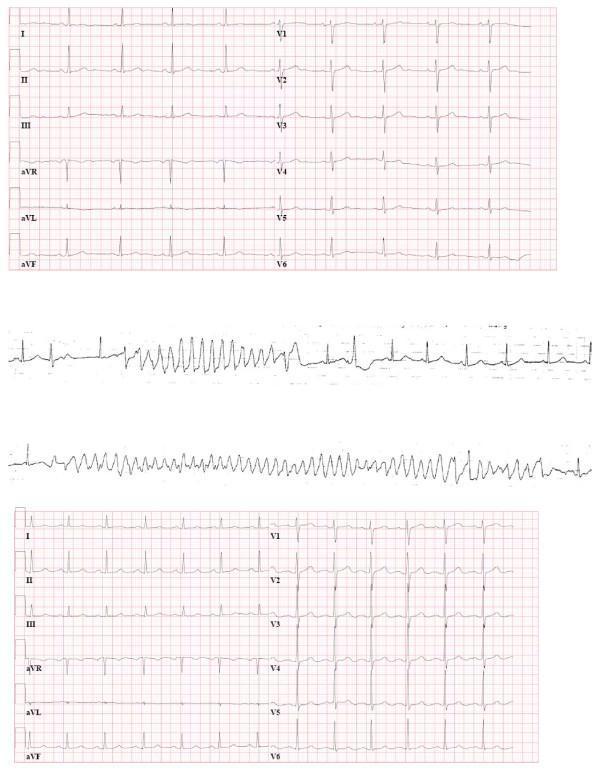
This composite educational graphic presents three sets of electrocardiogram (ECG) recordings demonstrating the progression of cardiac rhythm disturbances in a perioperative clinical context. Panel A (top) shows a standard 12-lead preoperative ECG displaying normal sinus rhythm (58 bpm) with a normal corrected QT interval (QTc 440 ms). Panel B (middle) provides rhythm strips exhibiting Torsades de Pointes (TdP), a polymorphic ventricular tachycardia. The upper strip in this panel clearly illustrates the 'short-long-short' sequence of R-R intervals preceding the initiation of the arrhythmia. The tachycardia itself shows the classic 'twisting of the points' morphology where the QRS axis and amplitude continuously shift around the isoelectric line. Panel C (bottom) shows a postoperative 12-lead ECG demonstrating sinus rhythm (77 bpm) with significant pathological QT prolongation (QTc 505 ms), particularly prominent in lead aVF. This panel also shows newly developed U waves merging into the preceding P waves in precordial leads V1-V4. The image serves as a clinical teaching tool for recognizing high-risk ECG features for malignant arrhythmias and the characteristic morphology of drug-induced or catecholamine-induced Torsades de Pointes.
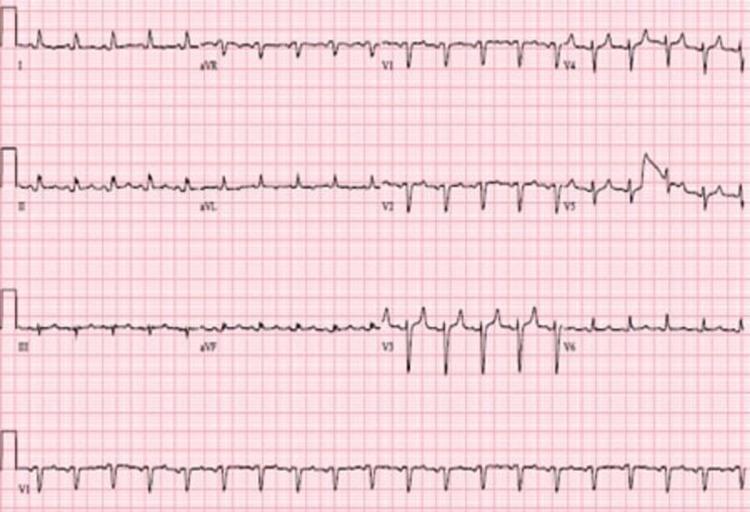
This diagnostic image is a 12-lead electrocardiogram (ECG) strip recorded at a standard paper speed and gain. The tracing demonstrates a regular narrow-complex tachycardia, consistent with sinus tachycardia, characterized by P waves with normal morphology and a consistent relationship with the QRS complexes. A critical finding is the presence of low-voltage QRS complexes, defined as a QRS amplitude of less than 5 mm in the limb leads (I, II, III, aVR, aVL, aVF) and less than 10 mm in the precordial leads (V1-V6). The P waves are upright in lead II and inverted in aVR, confirming a sinoatrial origin. This combination of sinus tachycardia and low voltage is a classic clinical indicator of a large pericardial effusion or cardiac tamponade, as the fluid surrounding the heart attenuates the electrical signal. The rhythm appears regular with a rate exceeding 100 beats per minute, which is common in compensatory states during hemodynamic compromise.
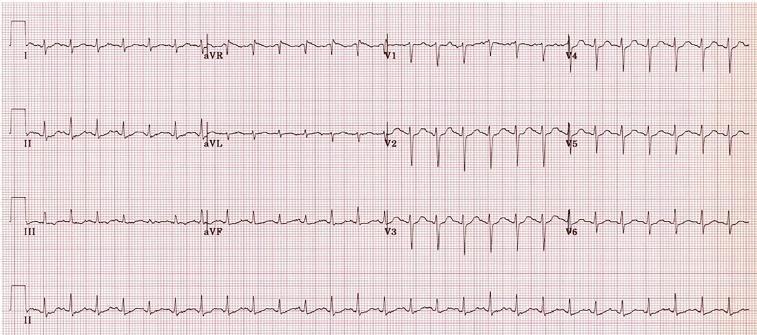
A 12-lead electrocardiogram (ECG) displayed in a standard 3x4 grid with a long Lead II rhythm strip at the bottom. The tracing exhibits a sinus tachycardia with a heart rate exceeding 100 beats per minute. P-waves are upright in leads I, II, and aVF, and inverted in aVR, indicating a normal sinus origin. The PR intervals and QRS durations appear within normal physiological limits. In the precordial leads (V1-V6), there is normal R-wave progression, characterized by small R-waves and deep S-waves in V1-V2, transitioning to dominant R-waves in V5-V6. The ST segments are largely isoelectric across all leads without evidence of acute ST-elevation myocardial infarction (STEMI) or significant depression. T-waves appear concordant and of normal morphology. This ECG serves as a diagnostic tool in the clinical context of systemic illness, such as metabolic disturbances or acute poisoning, to assess cardiac rhythm, rate, and potential toxicological effects on cardiac conduction.
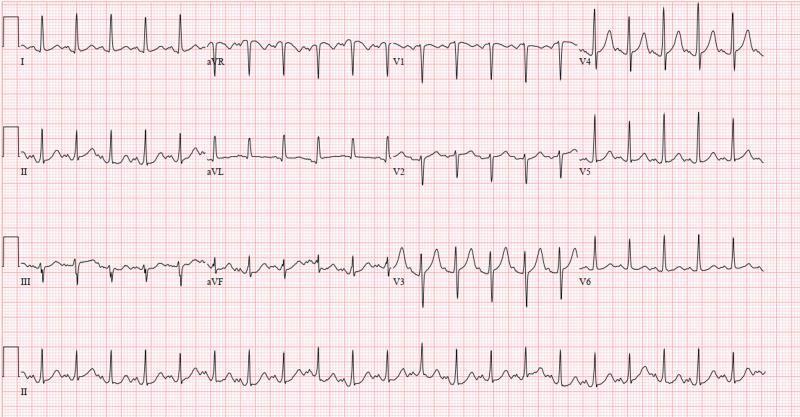
A 12-lead electrocardiogram (ECG) recorded on standard grid paper, demonstrating sinus tachycardia with a heart rate exceeding 100 bpm. The rhythm is regular with consistent R-R intervals and identifiable P waves preceding every QRS complex. The axis appears normal. In the precordial leads (V1-V6), there is a normal, albeit slightly rapid, R-wave progression from V1 to V4, with high-amplitude QRS complexes noted in V4 and V5, followed by a mild decrease in amplitude in V6. No significant ST-segment elevation, depression, or T-wave inversions are evident across the limb or precordial leads, suggesting the absence of acute ischemia. The rhythm strip at the bottom (Lead II) confirms a stable, tachycardic sinus rhythm. This ECG is clinically relevant for monitoring patients with acute systemic illnesses, such as COVID-19 or metabolic derangements, where sinus tachycardia is a common physiological response.
ECG strip typical AVNRT supraventricular tachycardia narrow complex pseudo r prime
"supraventricular tachycardia" AND electrocardiography
site:litfl.com ECG sinus tachycardia example ECG supraventricular tachycardia AVNRT example
Comparative ECG examples
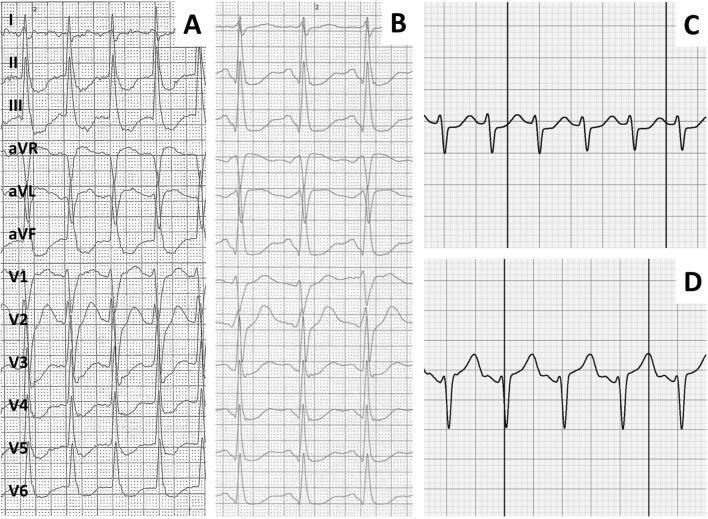
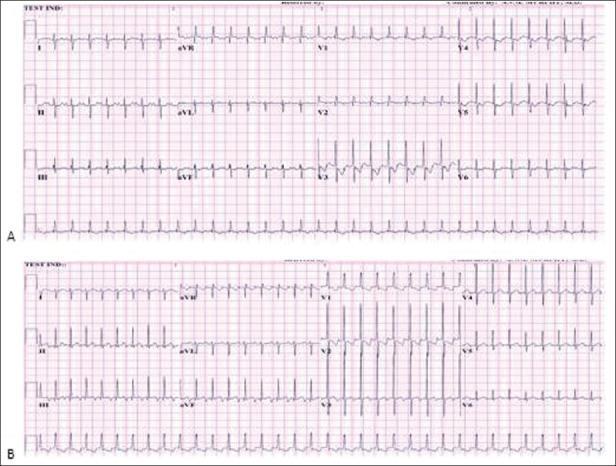
- Sinus tachycardia: upright P in lead II before every QRS, gradual rate variation.
- Typical AVNRT-SVT: very regular narrow-complex tachycardia, often no obvious P waves. A small pseudo-R′ in V1 or pseudo-S in inferior leads can represent retrograde P waves.
- Do not use rate alone. Both can be near 150/min, and atrial flutter with 2:1 conduction must also be excluded. The SVT ECG reference describes the short-RP and hidden retrograde P-wave pattern of typical AVNRT.