
Polyclonal antibodies biochemistry
polyclonal vs monoclonal antibody production diagram
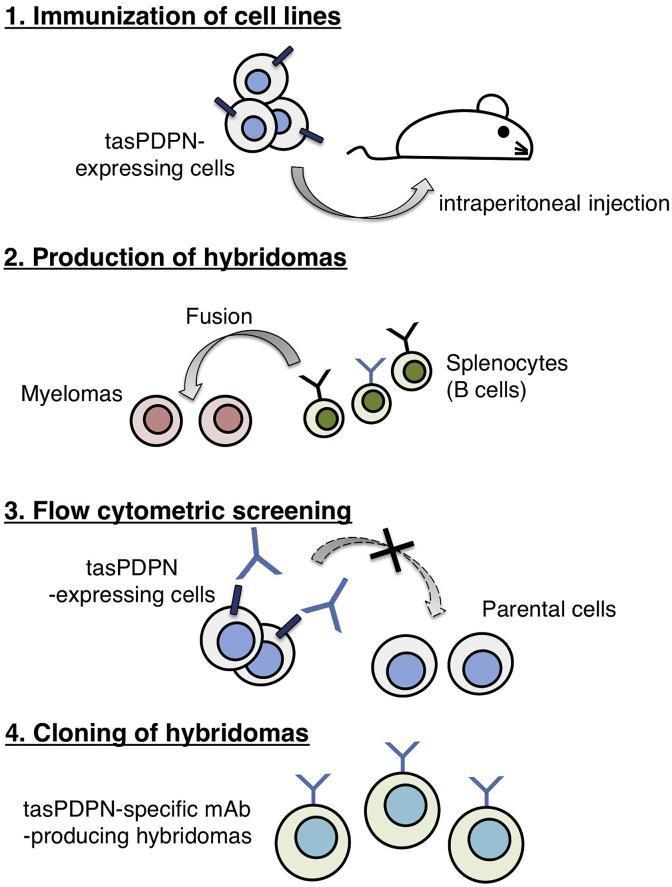
A four-step flow diagram illustrating the Cell-Based Immunization and Screening (CBIS) method for monoclonal antibody (mAb) production. Step 1: Immunization of cell lines involves the intraperitoneal injection of tasPDPN-expressing cells into a mouse model. Step 2: Production of hybridomas depicts the fusion of myelomas with splenocytes (B cells) harvested from the immunized mouse. Step 3: Flow cytometric screening shows the differentiation between target tasPDPN-expressing cells and parental cells. Specifically, antibodies (Y-shaped icons) bind to the tasPDPN-expressing cells, while no binding occurs on parental cells, indicated by a dashed arrow and an 'X'. Step 4: Cloning of hybridomas illustrates the isolation and cultivation of specific tasPDPN-specific mAb-producing hybridomas. This methodology highlights a strategy for developing highly specific antibodies against membrane proteins without the need for protein purification, utilizing stable transfectants as immunogens. The illustration is relevant for laboratory techniques in immunology, biotechnology, and diagnostic pathology.
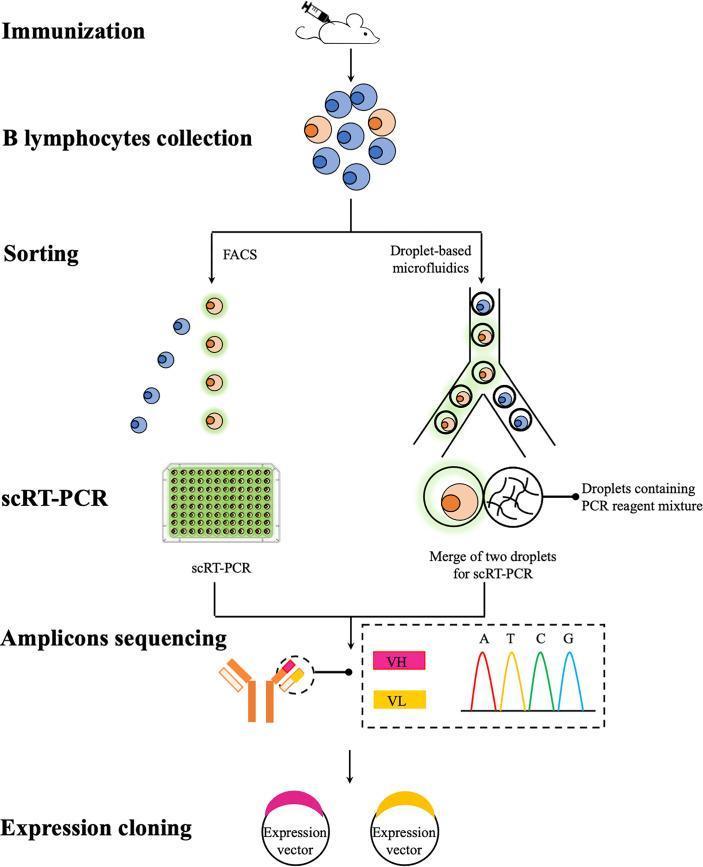
A flow diagram illustrating the experimental workflow for recombinant monoclonal antibody (mAb) production, comparing Fluorescence-Activated Cell Sorting (FACS) and droplet-based microfluidics. The process begins with 'Immunization' of a mouse model, followed by 'B lymphocytes collection' (splenocytes/plasmablasts). The 'Sorting' stage contrasts two high-throughput methods: FACS, which sorts individual cells into multi-well plates for single-cell RT-PCR (scRT-PCR), and droplet-based microfluidics, which encapsulates single cells in aqueous droplets for merger with PCR reagent droplets. The workflow converges at 'Amplicons sequencing,' highlighting the amplification of paired heavy (VH) and light (VL) chain variable regions, illustrated by an antibody diagram and a DNA sequencing chromatogram (A, T, C, G peaks). The final stage is 'Expression cloning,' depicting the integration of sequenced VH and VL genes into expression vectors for mAb production in various systems. This schematic serves as an educational resource for immunology and biotechnology, specifically focusing on single-cell technologies and antibody discovery campaigns.
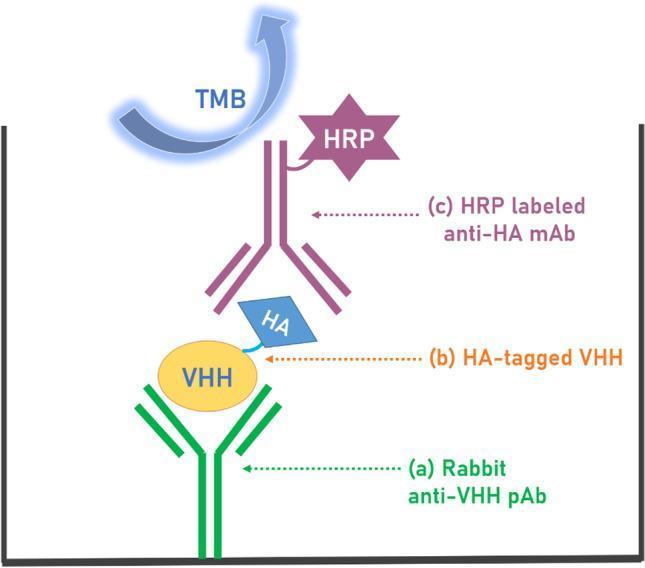
This medical laboratory diagram illustrates a sandwich Enzyme-Linked Immunosorbent Assay (ELISA) technique used for the detection of VHH (variable heavy-chain antibodies). The schematic depicts the spatial arrangement of the assay components within a microtiter plate well from bottom to top: (a) A capture layer consisting of Rabbit anti-VHH polyclonal antibodies (pAb), which are passively adsorbed to the bottom of the well. (b) The analyte, represented as an HA-tagged VHH molecule, where the VHH core binds to the capture antibody and an HA (hemagglutinin) tag is available for detection. (c) The detection layer featuring an HRP-labeled anti-HA monoclonal antibody (mAb). This antibody targets the HA tag of the analyte and is conjugated to Horseradish Peroxidase (HRP), shown as a purple star-shaped molecule. At the top, a blue curved arrow labeled TMB (3,3′,5,5′-Tetramethylbenzidine) represents the chromogenic substrate added to the well. The diagram demonstrates the biochemical principle of signal transduction where HRP catalyzes the oxidation of TMB to produce a measurable colorimetric signal, indicating the presence and concentration of the VHH analyte.
antibody structure immunoglobulin epitope binding sites
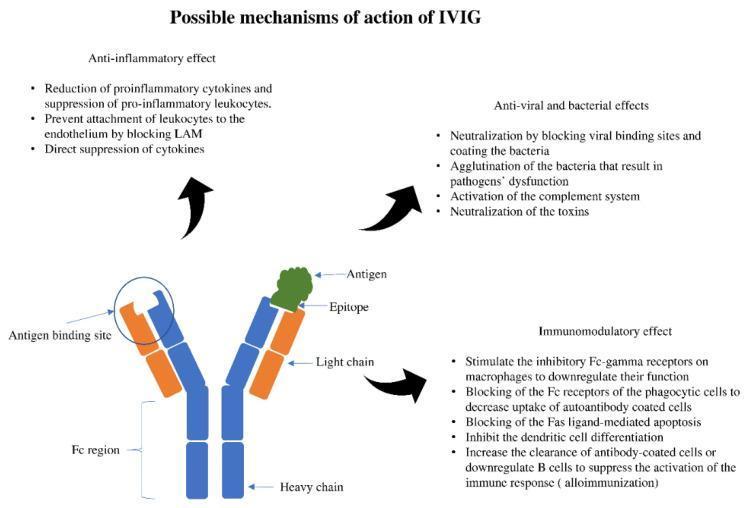
This pathophysiology diagram outlines the 'Possible mechanisms of action of IVIG' (Intravenous Immunoglobulin). A central Y-shaped antibody model illustrates standard structural components: two blue heavy chains and two orange light chains. The lower portion identifies the constant (Fc) region, while the tips of the Fab arms show the antigen-binding sites. One tip is shown binding to a green antigen at its specific epitope. Surrounding the antibody are three categorical descriptions of IVIG's therapeutic roles: 1) Anti-inflammatory effects, including the reduction of pro-inflammatory cytokines and blocking of leukocyte adhesion molecules (LAM). 2) Anti-viral and bacterial effects, highlighting neutralization of pathogens and toxins, agglutination, and complement system activation. 3) Immunomodulatory effects, emphasizing the stimulation of inhibitory Fc-gamma receptors on macrophages, suppression of B-cell activation to prevent alloimmunization, and blocking of phagocytic Fc receptors. This educational material serves as a conceptual summary for clinical immunology and pharmacology related to immunoglobulin therapy.
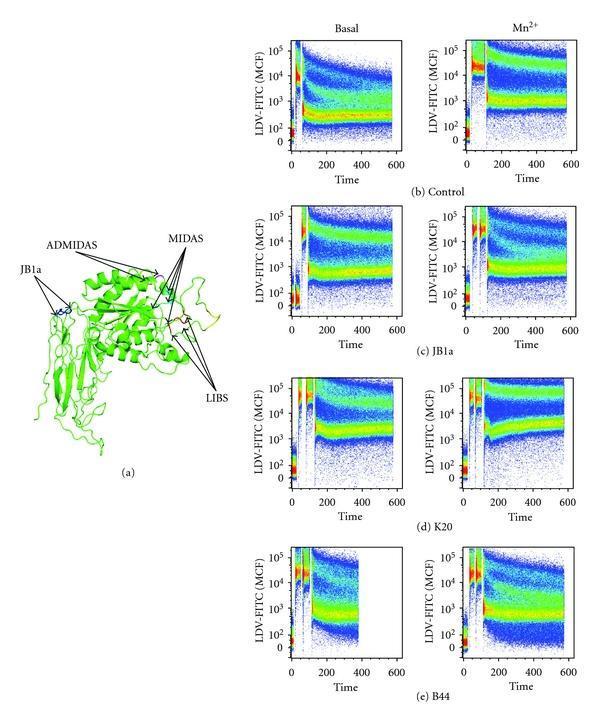
This composite educational graphic details the molecular mapping and conformational analysis of beta1 (β1) integrin in Jurkat cells. Panel (a) presents a 3D ribbon diagram of the β1 integrin protein structure, highlighting key functional domains and epitope locations including MIDAS (Metal Ion-Dependent Adhesion Site), ADMIDAS (Adjacent to MIDAS), LIBS (Ligand-Induced Binding Sites), and the binding site for the JB1a antibody. Panels (b) through (e) provide flow cytometry-based FRET (Fluorescence Resonance Energy Transfer) data plots illustrating integrin activation states. The y-axis measures LDV-FITC ligand binding (mean channel fluorescence, MCF) and the x-axis represents time. These plots compare basal activity versus Mn2+-induced activation across different experimental conditions: control (b), and the addition of specific antibodies JB1a (c), K20 (d), and B44 (e). The dense data distributions (heat-mapped from blue to red) visualize how these different clones modulate integrin conformation and ligand affinity, shifting from partially extended to fully active states.
Polyclonal Antibodies - Biochemistry
Definition
- Tietz Textbook of Laboratory Medicine, p. 793
Production
Basic Method (In Vivo - Animal Immunization)
- A purified antigen (immunogen) is injected into an animal (commonly rabbit, goat, horse, or sheep)
- The antigen stimulates multiple B-cell clones via normal adaptive immunity
- Each clone produces antibodies with different binding specificities against different epitopes of the antigen
- After a latent/induction period of 5-10 days, antibodies begin to appear in serum
- With continued stimulation, antibodies of different types and higher affinity are produced (affinity maturation)
- Antiserum (serum containing the antibodies) is collected from the immunized animal
"Polyclonal antiserum is raised in an animal host in response to immunogen administration."
- Tietz Textbook of Laboratory Medicine
Haptens and Carrier Proteins
- Small molecules (haptens, hormones) are too small to be immunogenic alone
- They are conjugated to a carrier protein to stimulate antibody production
- The resulting antibodies are directed against the hapten epitope
- A hapten can bind an antibody but cannot alone stimulate an immune response
Biochemical Structure
- 2 heavy chains and 2 light chains linked by disulfide bonds
- A variable (Fab) region containing the antigen-binding site (unique per clone)
- A constant (Fc) region
Key Biochemical Properties
Affinity and Avidity
| Term | Definition |
|---|---|
| Affinity | Thermodynamic strength of interaction between a single antibody-combining site and its corresponding single epitope. Influenced by pH and temperature. |
| Avidity | Overall strength of binding of an antibody and its antigen - the sum of all individual binding affinities of all combining sites on the antibody. Also depends on valency and structural arrangement. |
For polyclonal antibodies, affinity and avidity are difficult to determine primarily because of the diversity of the antibody population.
- Tietz Textbook of Laboratory Medicine, p. 793
Cross-Linking and Precipitation
- Cross-link antigen molecules to form large immunocomplexes
- Precipitate macromolecular antigens in precipitin reactions (unlike most monoclonal antibodies, which target only one epitope and fail to form precipitin networks)
Avidity to Complex Antigens
Polyclonal vs. Monoclonal Antibodies
| Feature | Polyclonal | Monoclonal |
|---|---|---|
| Source | Multiple B-cell clones | Single B-cell clone (hybridoma) |
| Epitope specificity | Multiple epitopes on antigen | Single epitope |
| Production | Animal immunization + serum collection | Hybridoma technology (B cell fusion with myeloma cell) |
| Consistency | Batch-to-batch variation | Highly uniform, reproducible |
| Cross-reactivity | High (may cross-react with related proteins) | Low but possible (shared epitopes) |
| Precipitin reactions | Yes (network formation) | Usually no (poor lattice formation) |
| Affinity/avidity determination | Difficult | Well-defined |
| Application | Western blot, immunoprecipitation, ELISA | Diagnostic assays, therapeutics, research |
| Supply | Limited by animal lifespan | Unlimited (immortal cell line) |
- Henry's Clinical Diagnosis and Management by Laboratory Methods, p. 3282-3295
Clinical and Laboratory Applications
1. Antithymocyte Globulin (ATG)
- T-lymphocyte depletion via complement-mediated lysis
- Clearance of antibody-coated cells by the reticuloendothelial system
- Induction therapy and treatment of acute rejection
- The Washington Manual of Medical Therapeutics, p. 652
2. Intravenous Immunoglobulin (IVIG)
- Direct binding to natural antibodies and pathogens
- Inhibition of complement fixation
- Blockade of phagocytic Fc receptors
- Stimulation of anti-inflammatory pathways
3. Western Blotting and Immunoassays
4. Anti-Human Globulin (AHG) Reagents
- Henry's Clinical Diagnosis and Management by Laboratory Methods
5. Polyclonal B-Cell Activation (Research)
- Cellular and Molecular Immunology
Summary of Biochemical Advantages
- Recognize the entire antigen molecule across multiple epitopes
- Strong avidity due to multi-site binding
- Effective in precipitation and agglutination reactions (good lattice formation)
- Tolerant of minor conformational changes in the antigen (since other epitopes remain available)
- Relatively fast and inexpensive to produce
Key Limitations
- Batch-to-batch variability (each immunization cycle may yield different antibody ratios)
- Higher non-specific background staining
- May cross-react with structurally related proteins
- Cannot be indefinitely replicated (unlike hybridoma-based monoclonals)
- Affinity and avidity difficult to characterize due to population heterogeneity