
Myocardial infraction for UC paper
What does 'UC paper' refer to? · What kind of content do you need on Myocardial Infarction?
myocardial infarction pathology ECG diagram
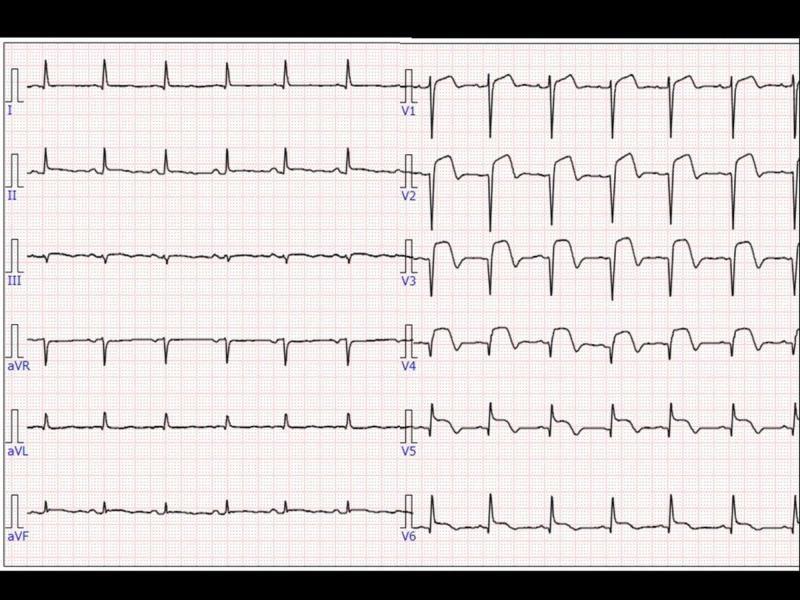
This diagnostic image is a 12-lead electrocardiogram (ECG) demonstrating significant findings of an acute myocardial infarction. The tracing is organized into standard limb leads (I, II, III, aVR, aVL, aVF) and precordial leads (V1-V6). The most prominent pathology is marked ST-segment elevation with a convex (tombstone) morphology visible across the precordial leads, specifically V1 through V6. These hyperacute T waves and significant ST elevations are most pronounced in leads V2-V4, suggesting an acute anteroseptal or extensive anterior wall myocardial infarction. The QRS complexes are narrow, and while P waves are visible, baseline drift is noted in the inferior limb leads (II, III, aVF). The ECG provides a classic clinical example of ST-elevation myocardial infarction (STEMI) pathology, serving as a critical educational tool for identifying life-threatening cardiac ischemia and interpreting precordial lead abnormalities in an emergency medicine or cardiology context.
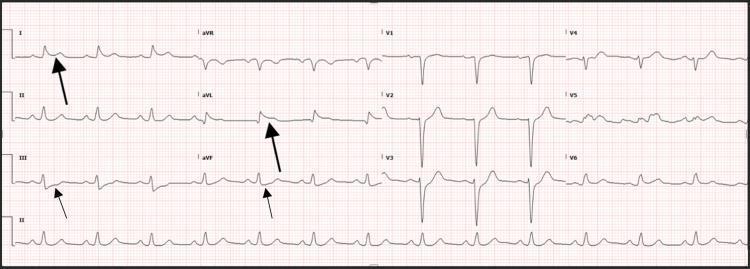
This diagnostic image is a 12-lead electrocardiogram (ECG) displayed on standard grid paper, illustrating findings characteristic of high lateral ST-segment elevation myocardial infarction (STEMI). The primary visual pathology includes significant ST-segment elevation (STE) in the high lateral leads, specifically lead I and lead aVL, marked by large black arrows. This is accompanied by prominent reciprocal ST-segment depression (STD) in the inferior leads, III and aVF, highlighted by small black arrows. The QRS complexes appear relatively narrow without evidence of pathological Q waves at this stage. The ECG serves as an educational tool for identifying early ischemic changes and reciprocal patterns in the setting of acute coronary syndrome (ACS). It is highly relevant for medical training in cardiology, emergency medicine, and critical care, demonstrating the visual cues used to diagnose arterial occlusion (such as the left anterior descending or diagonal branches) in a post-cardiac arrest clinical context.
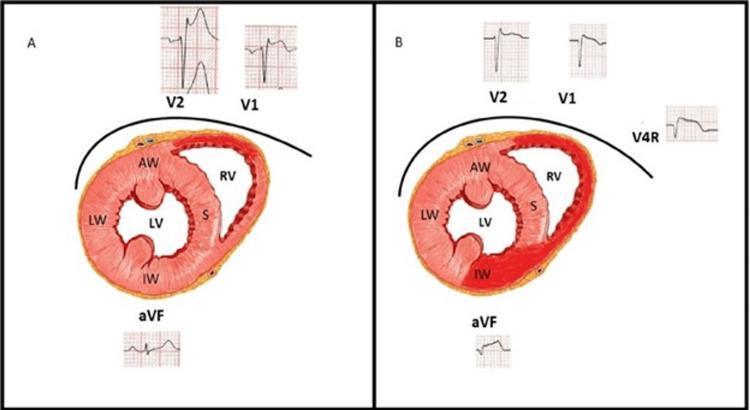
Educational comparison diagram illustrating the progression of myocardial ischemia and associated electrocardiographic (ECG) changes over time (30 vs. 90 minutes). Panel A shows a cross-sectional anatomical diagram of the heart with normal perfusion, labeled with structures including the Anterior Wall (AW), Lateral Wall (LW), Septum (S), Inferior Wall (IW), and Right Ventricle (RV). Corresponding ECG tracings for leads V1, V2, and aVF show baseline morphologies. Panel B demonstrates the progression of a transmural injury, visually indicated by dark red shading in the Inferior Wall (IW) and Right Ventricle (RV). This pathological change is correlated with dynamic ECG findings: leads V1 and V2 show a reduction in ST-elevation amplitude compared to Panel A, while lead aVF now exhibits new ST-segment elevation. Additionally, Panel B includes a right-sided lead V4R showing ST-elevation, diagnostic of right ventricular involvement. The diagram serves to teach the 'wandering' nature of ST-elevation during evolving myocardial infarction, specifically highlighting the shift from early anterior injury vectors to inferior and right ventricular manifestations.
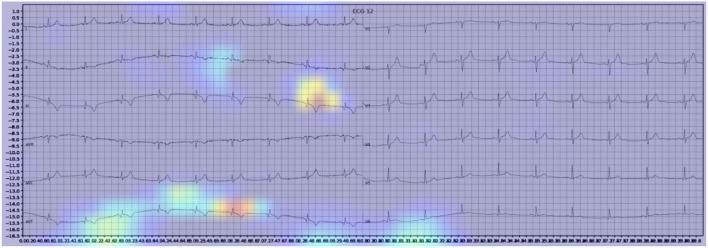
This diagnostic image displays a 12-lead electrocardiogram (ECG) showing signs of myocardial infarction (MI), overlaid with a Gradient-weighted Class Activation Mapping (Grad-CAM) heatmap. The underlying ECG traces are plotted on a standard grid, with vertical fluctuations representing cardiac electrical activity across multiple leads. Superimposed on these traces is a spectral heatmap ranging from blue (low importance) to red (high importance). The heatmap's highest intensity regions (red and yellow focal points) are localized over clinically significant ECG morphology changes, specifically the ST segments and T waves. This visualization illustrates the segments of the waveform that the machine learning model prioritized to identify the pathology. In this clinical scenario, the highlighted areas correspond to ST-segment elevation and T-wave abnormalities characteristic of acute myocardial ischemia or infarction. This comparison is used in medical education to validate artificial intelligence diagnostic reasoning against established human diagnostic criteria for cardiovascular emergencies.
Myocardial Infarction
Definition
Epidemiology and Risk Factors
- Non-modifiable: age, male sex, family history, genetics
- Modifiable: hypertension, hyperlipidaemia, diabetes mellitus, smoking, obesity, sedentary lifestyle, stress
Classification (Fourth Universal Definition)
| Type | Description |
|---|---|
| Type 1 | Spontaneous MI due to atherosclerotic plaque rupture/erosion with thrombosis |
| Type 2 | Ischaemic imbalance - supply/demand mismatch (e.g. tachycardia, anaemia, spasm) |
| Type 3 | MI causing sudden cardiac death before biomarkers can be obtained |
| Type 4a/b | Percutaneous coronary intervention (PCI)-related |
| Type 5 | Coronary artery bypass graft (CABG)-associated |
Pathogenesis
Coronary Artery Occlusion
- An atheromatous plaque is eroded or disrupted by endothelial injury, intraplaque haemorrhage, or mechanical forces - exposing subendothelial collagen and necrotic plaque contents to the blood.
- Platelets adhere, aggregate, and are activated, releasing thromboxane A2, ADP, and serotonin - causing further platelet aggregation and vasospasm.
- Activation of coagulation by exposure of tissue factor adds to the growing thrombus.
- Within minutes, the enlarging thrombus completely occludes the coronary artery lumen.
Myocardial Response to Ischaemia
- Within seconds: aerobic metabolism ceases, ATP drops, lactic acid accumulates
- Within minutes: loss of contractility (reversible at this stage)
- 20-40 minutes: irreversible damage and coagulative necrosis if ischaemia persists
- Earliest sign of necrosis: disruption of the sarcolemmal membrane, allowing intracellular macromolecules (troponin, CK-MB) to leak into the blood
Cardiac muscle requires approximately 1.3 mL O2/100 g/min just to survive. If even 15-30% of normal resting coronary blood flow is maintained, the muscle will not die. However, in the central portion of a large infarct, with almost no collateral flow, muscle death occurs. - Guyton & Hall Medical Physiology, p. 271
Anatomical Location of Infarcts
| Artery | % of MIs | Region Affected |
|---|---|---|
| Left Anterior Descending (LAD) | 40-50% | Anterior LV wall, anterior 2/3 of septum, apex |
| Right Coronary Artery (RCA) | 30-40% | Right ventricle, inferior/posterior LV (right dominant) |
| Left Circumflex (LCX) | 15-20% | Lateral LV wall |
Types of Infarction by Depth
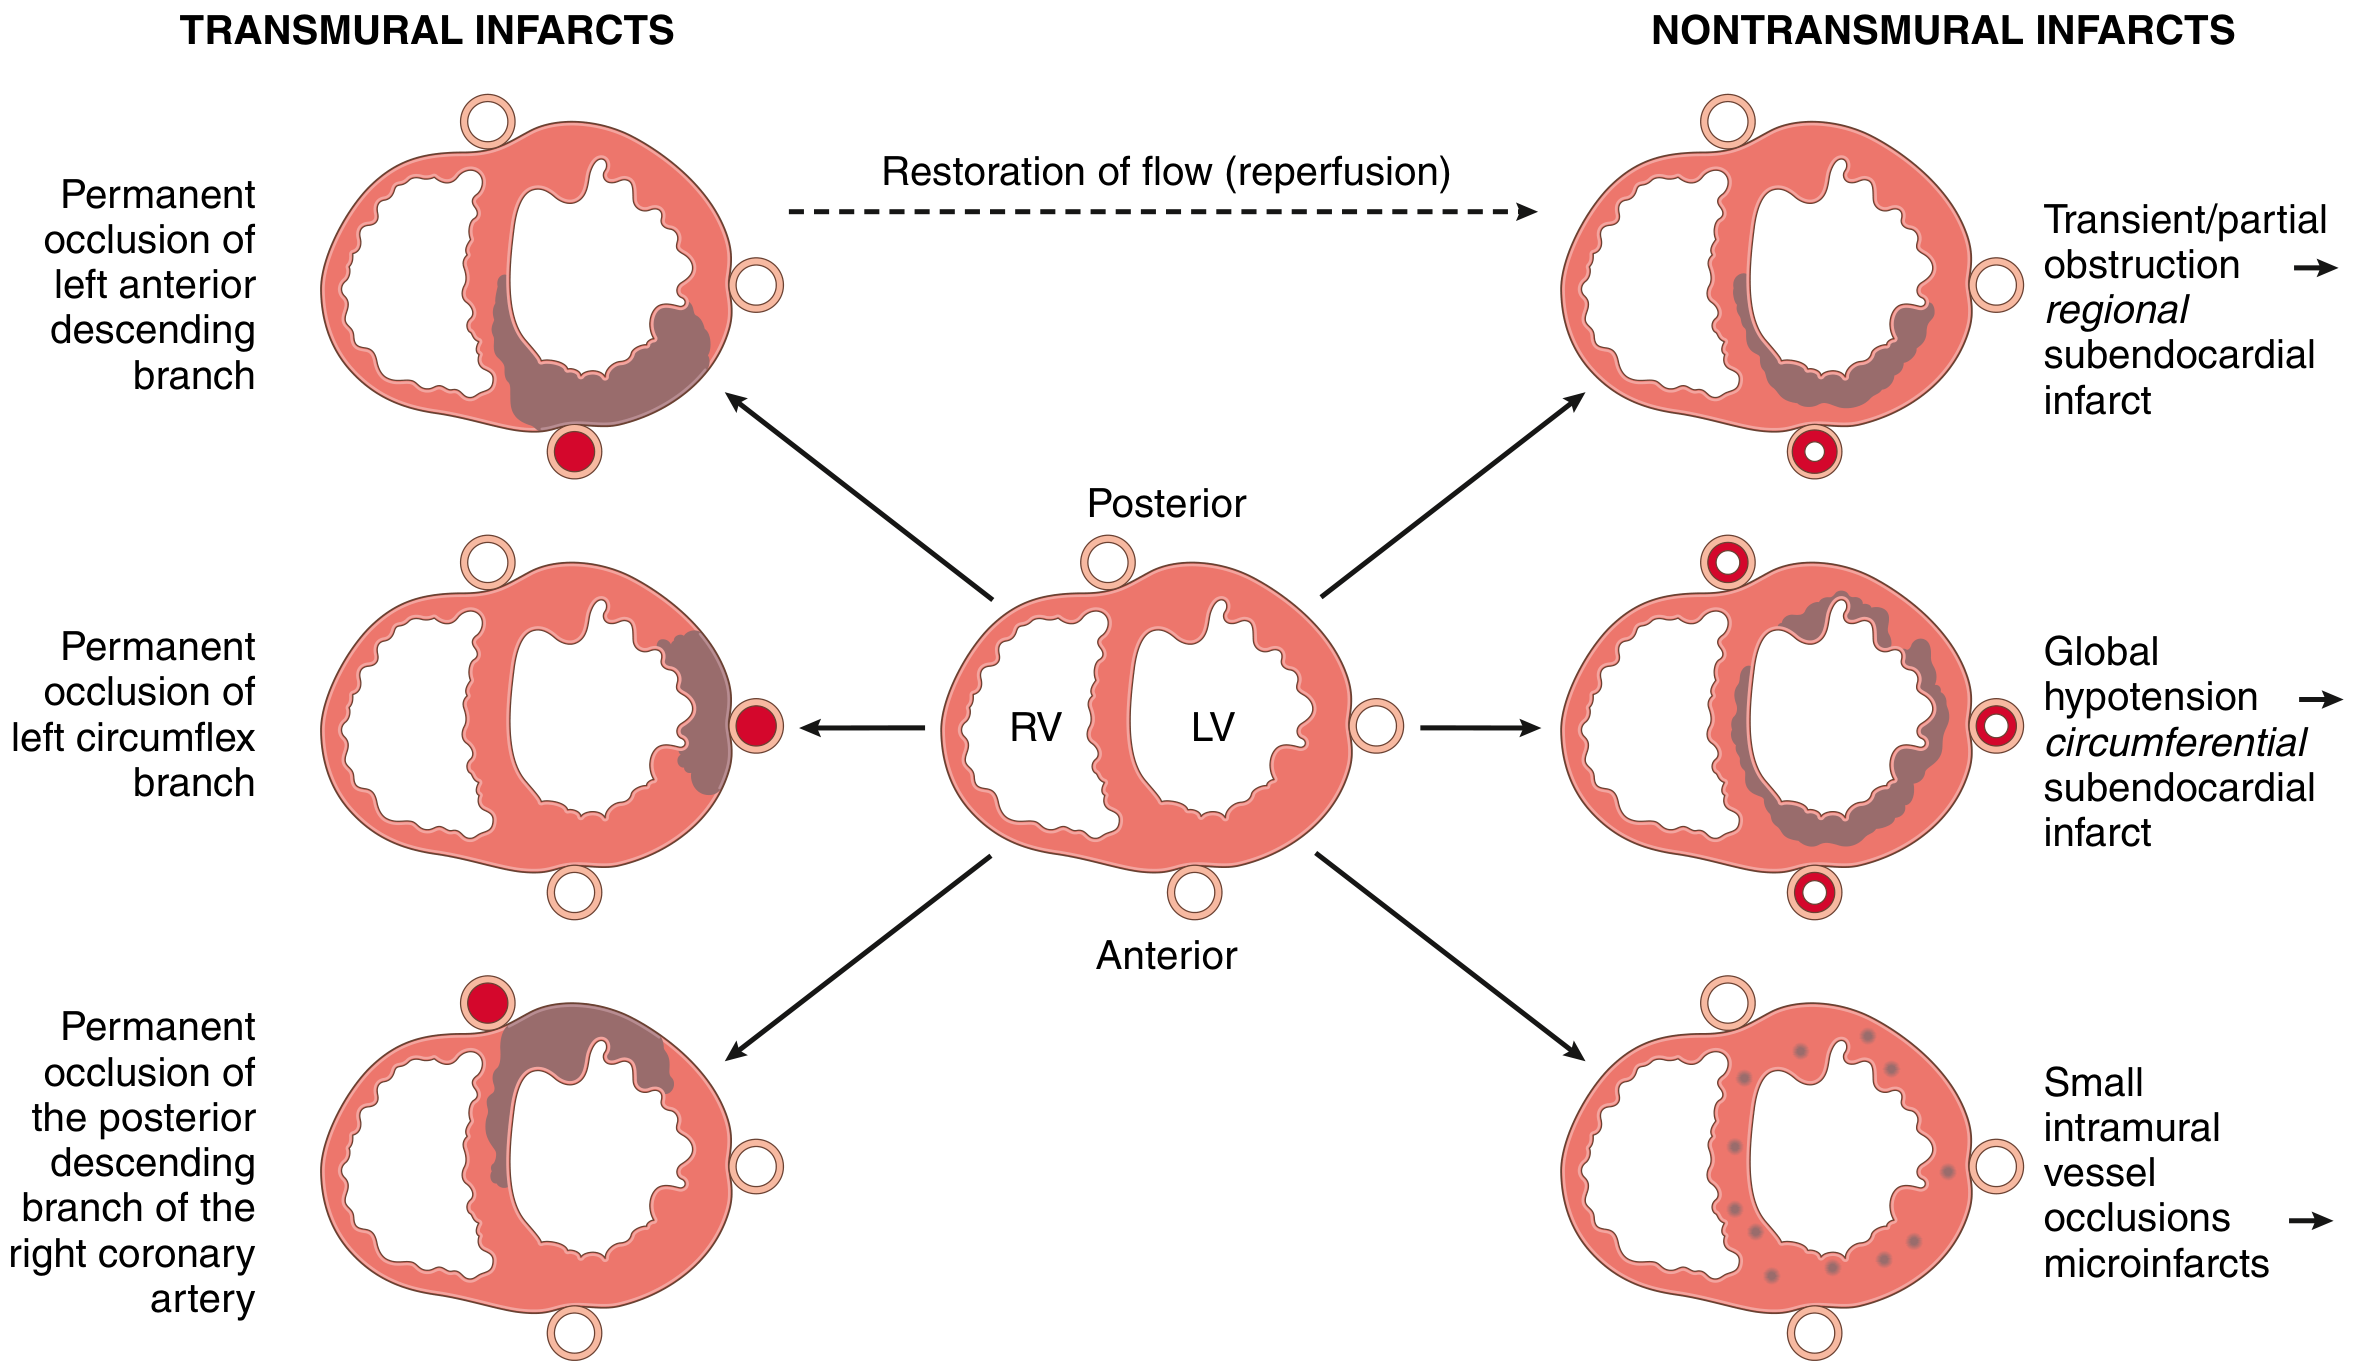
- Transmural infarction: Full thickness of the ventricle; caused by complete epicardial vessel occlusion (atherosclerosis + acute plaque change with thrombosis). Correlates with STEMI on ECG.
- Subendocardial infarction: Limited to the inner third of myocardium. Occurs when the thrombus is lysed spontaneously or therapeutically before necrosis becomes transmural. The subendocardial region is especially vulnerable due to higher oxygen consumption and compression of vessels during systole. Correlates with NSTEMI on ECG.
Morphological Changes (Gross and Microscopic)
| Time | Gross Appearance | Microscopic Findings |
|---|---|---|
| 0-6 hours | No visible change | Wavy fibres; coagulative necrosis beginning |
| 12-24 hours | Dark discolouration, early mottling | Coagulative necrosis, marginal neutrophilic infiltration |
| 1-3 days | Pale, soft, yellow-tan infarct | Dense neutrophilic infiltrate; nuclear pyknosis and karyolysis |
| 3-7 days | Hyperaemic border, softening begins | Macrophages begin phagocytosis of necrotic debris |
| 1-3 weeks | Yellow-white centre with red hyperaemic border | Granulation tissue ingrowth; fibroblast proliferation |
| >6 weeks | White/grey scar | Dense collagen scar (fibrosis); complete replacement |
Clinical Features
Symptoms
- Chest pain: Severe, crushing, "squeezing" or "pressure-like" central chest pain - the most characteristic symptom. May radiate to the left arm, jaw, neck, or back. Lasts >20 minutes (unlike angina). Not relieved by nitrates.
- Dyspnoea - due to impaired ventricular function
- Sweating (diaphoresis), nausea, vomiting
- Palpitations - from arrhythmias
- Syncope - due to haemodynamic compromise
- Note: In diabetics, women, and elderly patients, "silent" (painless) MIs may occur
Signs
- Pallor, cold clammy skin
- Tachycardia, hypotension (in large infarcts)
- S3 or S4 gallop; new murmur if papillary muscle rupture or VSD
- Signs of cardiac failure (elevated JVP, pulmonary crackles, oedema)
- Pericardial friction rub (2-3 days later, in transmural MI - Dressler's syndrome)
Investigations
Electrocardiogram (ECG)
| Defect | Current Flow | ECG Change |
|---|---|---|
| Rapid repolarisation of infarcted cells | Out of infarct | ST segment elevation |
| Decreased resting membrane potential (K+ loss) | Into infarct | TQ depression (recorded as ST elevation) |
| Delayed depolarisation | Out of infarct | ST elevation |
- Hyperacute phase: Tall peaked T waves (first minutes)
- Acute phase: ST elevation in leads overlying the infarct (STEMI); reciprocal ST depression in opposite leads
- Hours-days: T wave inversion develops
- Days-weeks: Pathological Q waves appear (>40 ms wide, >25% of R wave height) - permanent marker of transmural necrosis
- "Non-Q-wave infarcts" (NSTEMI) show ST depression or T wave changes without Q waves; tend to be less severe but carry a high risk of reinfarction
Cardiac Biomarkers
| Biomarker | Rises | Peaks | Returns to Normal | Notes |
|---|---|---|---|---|
| Troponin I/T | 3-6 hours | 12-24 hours | 7-14 days | Most sensitive and specific; gold standard |
| CK-MB | 4-6 hours | 24 hours | 48-72 hours | Useful for detecting reinfarction |
| Myoglobin | 1-4 hours | 6-9 hours | 24 hours | Earliest marker, but not cardiac-specific |
| LDH | 24-48 hours | 3-6 days | 8-14 days | Useful for late presentation |
Other Investigations
- Chest X-ray: May show cardiomegaly, pulmonary oedema
- Echocardiography: Regional wall motion abnormalities, ejection fraction assessment, complications (VSD, MR, tamponade)
- Coronary angiography: Defines anatomy, guides PCI
- FBC: Leukocytosis reflects inflammation; elevated WBC correlates with worse prognosis
- Lipid profile, glucose, renal function: Risk factor assessment
Complications
Early (within 48 hours)
- Ventricular fibrillation (VF) - Most common cause of early death. Risk is highest in the first 10 minutes after infarction, then again 1 hour later. Caused by K+ loss from ischaemic cells, injury currents, sympathetic activation, and re-entry circuits from ventricular dilation. - Guyton & Hall, p. 272
- Cardiogenic shock - Occurs when >40% of the LV is infarcted. Systolic stretch (paradoxical outward bulging of infarcted muscle during systole) reduces pump efficiency. Mortality 40-50% even with treatment.
- Acute pump failure / pulmonary oedema - from impaired LV function
- Bradyarrhythmias and heart block - especially in inferior MI (RCA territory involving AV node)
Later Complications
- Pericarditis (Dressler's syndrome) - autoimmune reaction 1-8 weeks post-MI; fever, pleuritis, pericardial effusion
- Ventricular aneurysm - paradoxical bulging of the thinned scar; risk of thrombus formation and embolism
- Left ventricular pseudoaneurysm - contained rupture; requires surgery
- Ventricular septal defect (VSD) - from septal necrosis; causes acute left-to-right shunt
- Papillary muscle rupture - causes acute severe mitral regurgitation; haemodynamic collapse
- Mural thrombus - in large anterior MIs; risk of systemic embolism
- Post-MI angina / reinfarction - particularly with NSTEMI
- Heart failure / ischaemic cardiomyopathy - long-term sequelae of extensive damage
Management
Immediate (Acute Phase)
- M - Morphine (IV): pain relief, reduces sympathetic activation; use cautiously
- O - Oxygen: supplemental O2 if SpO2 <94%; avoid in normoxic patients
- N - Nitrates (sublingual/IV GTN): vasodilation, pain relief; avoid in right-sided MI or hypotension
- A - Aspirin 300 mg loading dose: antiplatelet (irreversible COX-1 inhibition)
- P2Y12 inhibitor (clopidogrel, ticagrelor, prasugrel): dual antiplatelet therapy
- Anticoagulation: heparin (UFH or LMWH) or bivalirudin
- Beta-blocker: reduces myocardial oxygen demand, anti-arrhythmic; avoid if cardiogenic shock, severe bradycardia, or bronchospasm
Reperfusion Therapy
- Primary PCI (percutaneous coronary intervention) - preferred if available within 90-120 minutes. Balloon angioplasty ± stent deployment directly opens the occluded vessel.
- Thrombolysis (fibrinolysis) - if primary PCI unavailable in time. Agents: streptokinase, alteplase (tPA), tenecteplase. Give within 12 hours of symptom onset. Contraindicated in recent surgery, stroke, active bleeding. - Sabiston Textbook of Surgery, p. 2932
Long-Term (Secondary Prevention)
- Aspirin (75-100 mg daily) indefinitely
- Statin (e.g. atorvastatin 40-80 mg): lipid-lowering + pleiotropic effects
- ACE inhibitor/ARB: reduces afterload, prevents LV remodelling; especially if EF <40%
- Beta-blocker: reduces mortality, prevents reinfarction and arrhythmia
- Aldosterone antagonist (e.g. eplerenone): if EF <40% with heart failure or diabetes
- Dual antiplatelet therapy for 12 months post-stent, then aspirin alone
- Cardiac rehabilitation, lifestyle modification (smoking cessation, diet, exercise)
Prognosis
Summary
- Robbins & Kumar Basic Pathology (Robbins Pathology) - Cardiovascular Pathology chapter
- Guyton & Hall Textbook of Medical Physiology - Coronary Circulation and Ischaemic Heart Disease
- Ganong's Review of Medical Physiology (26th ed.) - ECG in MI
- Sabiston Textbook of Surgery - Coronary Artery Disease and Surgical Management
- Goldman-Cecil Medicine International Edition - Acute Coronary Syndromes
Generate a PowerPoint presentation on MI pathophysiology and management
mkdir -p /tmp/workspace/mi-presentation && ls /tmp/workspace/
~/mi-presentation/build_mi_pptx.py
"""
Myocardial Infarction - Pathophysiology and Management
Professional PowerPoint Presentation Generator
"""

from pptx import Presentation
from pptx.util import Inches, Pt, Emu
from pptx.dml.color import RGBColor
from pptx.enum.text import PP_ALIGN, MSO_ANCHOR
from pptx.enum.shapes import MSO_SHAPE
from pptx.enum.shapes import MSO_CONNECTOR
import json, subprocess, base64
from io import BytesIO

# ─── Colour Palette ────────────────────────────────────────────────────────────
DARK_RED    = RGBColor(0xC0, 0x20, 0x2A)   # deep crimson
MED_RED     = RGBColor(0xE8, 0x3A, 0x3A)   # vivid red
LIGHT_RED   = RGBColor(0xF5, 0xB8, 0xB8)   # blush
DARK_GREY   = RGBColor(0x1E, 0x1E, 0x1E)   # near-black
MID_GREY    = RGBColor(0x4A, 0x4A, 0x4A)   # body text
LIGHT_GREY  = RGBColor(0xF2, 0xF2, 0xF2)   # background panels
WHITE       = RGBColor(0xFF, 0xFF, 0xFF)
GOLD        = RGBColor(0xE8, 0xA8, 0x00)
TEAL        = RGBColor(0x00, 0x7A, 0x8A)
ORANGE      = RGBColor(0xE8, 0x6A, 0x10)
GREEN       = RGBColor(0x2E, 0x7D, 0x32)
BLUE        = RGBColor(0x1A, 0x5C, 0x9A)

# ─── Helper Functions ──────────────────────────────────────────────────────────
def add_rect(slide, x, y, w, h, fill_color, line_color=None, line_width=0):
    shp = slide.shapes.add_shape(MSO_SHAPE.RECTANGLE, x, y, w, h)
    shp.fill.solid()
    shp.fill.fore_color.rgb = fill_color
    if line_color:
        shp.line.color.rgb = line_color
        shp.line.width = Pt(line_width)
    else:
        shp.line.fill.background()
    shp.shadow.inherit = False
    return shp

def add_rounded_rect(slide, x, y, w, h, fill_color, line_color=None, line_width=0):
    shp = slide.shapes.add_shape(MSO_SHAPE.ROUNDED_RECTANGLE, x, y, w, h)
    shp.fill.solid()
    shp.fill.fore_color.rgb = fill_color
    if line_color:
        shp.line.color.rgb = line_color
        shp.line.width = Pt(line_width)
    else:
        shp.line.fill.background()
    shp.shadow.inherit = False
    return shp

def add_text(slide, text, x, y, w, h, font_size=14, bold=False,
             color=DARK_GREY, align=PP_ALIGN.LEFT, italic=False,
             v_anchor=MSO_ANCHOR.TOP, wrap=True):
    tb = slide.shapes.add_textbox(x, y, w, h)
    tf = tb.text_frame
    tf.word_wrap = wrap
    tf.vertical_anchor = v_anchor
    tf.margin_left = 0
    tf.margin_right = 0
    tf.margin_top = 0
    tf.margin_bottom = 0
    p = tf.paragraphs[0]
    p.alignment = align
    run = p.add_run()
    run.text = text
    run.font.size = Pt(font_size)
    run.font.bold = bold
    run.font.italic = italic
    run.font.color.rgb = color
    run.font.name = "Calibri"
    return tb

def add_multiline_text(slide, lines, x, y, w, h, font_size=12, bold=False,
                       color=DARK_GREY, line_spacing=1.2):
    """lines = list of (text, bold, color) tuples or plain strings"""
    tb = slide.shapes.add_textbox(x, y, w, h)
    tf = tb.text_frame
    tf.word_wrap = True
    tf.margin_left = Inches(0.05)
    tf.margin_right = Inches(0.05)
    tf.margin_top = Inches(0.05)
    tf.margin_bottom = Inches(0.05)
    first = True
    for item in lines:
        if isinstance(item, str):
            txt, b, c = item, bold, color
        else:
            txt, b, c = item
        if first:
            p = tf.paragraphs[0]
            first = False
        else:
            p = tf.add_paragraph()
        run = p.add_run()
        run.text = txt
        run.font.size = Pt(font_size)
        run.font.bold = b
        run.font.color.rgb = c
        run.font.name = "Calibri"
    return tb

def add_header_bar(slide, title, subtitle=None,
                   bar_color=DARK_RED, title_color=WHITE, sub_color=LIGHT_RED):
    """Full-width header bar at top of slide"""
    bar_h = Inches(1.25) if subtitle else Inches(0.9)
    add_rect(slide, 0, 0, Inches(13.333), bar_h, bar_color)
    # accent stripe
    add_rect(slide, 0, bar_h, Inches(13.333), Inches(0.04), MED_RED)
    add_text(slide, title, Inches(0.4), Inches(0.12), Inches(12.5),
             Inches(0.6), font_size=26, bold=True, color=title_color,
             v_anchor=MSO_ANCHOR.MIDDLE)
    if subtitle:
        add_text(slide, subtitle, Inches(0.4), Inches(0.72), Inches(12.5),
                 Inches(0.45), font_size=14, color=sub_color, italic=True,
                 v_anchor=MSO_ANCHOR.MIDDLE)

def add_section_label(slide, label, x, y, w=Inches(3.5), color=DARK_RED):
    shp = add_rounded_rect(slide, x, y, w, Inches(0.32), color)
    tf = shp.text_frame
    tf.margin_left = Inches(0.1)
    tf.margin_top = Inches(0.03)
    p = tf.paragraphs[0]
    run = p.add_run()
    run.text = label.upper()
    run.font.size = Pt(11)
    run.font.bold = True
    run.font.color.rgb = WHITE
    run.font.name = "Calibri"

def add_card(slide, x, y, w, h, fill=LIGHT_GREY, border=DARK_RED, bw=1.5):
    shp = add_rounded_rect(slide, x, y, w, h, fill, border, bw)
    return shp

def bullet_block(slide, title, items, x, y, w, h,
                 title_color=DARK_RED, item_color=MID_GREY,
                 bg_color=LIGHT_GREY, border_color=DARK_RED,
                 title_size=13, item_size=11.5):
    add_card(slide, x, y, w, h, bg_color, border_color)
    add_text(slide, title, x + Inches(0.12), y + Inches(0.08),
             w - Inches(0.2), Inches(0.3),
             font_size=title_size, bold=True, color=title_color)
    line_h = Inches(0.25)
    for i, item in enumerate(items):
        add_text(slide, f"  \u2022  {item}",
                 x + Inches(0.1),
                 y + Inches(0.38) + i * line_h,
                 w - Inches(0.2), line_h,
                 font_size=item_size, color=item_color)


def number_badge(slide, number, x, y, bg=DARK_RED):
    """Circle badge with a number"""
    sz = Inches(0.38)
    shp = slide.shapes.add_shape(MSO_SHAPE.OVAL, x, y, sz, sz)
    shp.fill.solid()
    shp.fill.fore_color.rgb = bg
    shp.line.fill.background()
    shp.shadow.inherit = False
    tf = shp.text_frame
    tf.margin_left = 0; tf.margin_top = 0
    tf.margin_right = 0; tf.margin_bottom = 0
    tf.vertical_anchor = MSO_ANCHOR.MIDDLE
    p = tf.paragraphs[0]
    p.alignment = PP_ALIGN.CENTER
    run = p.add_run()
    run.text = str(number)
    run.font.size = Pt(13)
    run.font.bold = True
    run.font.color.rgb = WHITE
    run.font.name = "Calibri"


# ─── Build Presentation ────────────────────────────────────────────────────────
prs = Presentation()
prs.slide_width = Inches(13.333)
prs.slide_height = Inches(7.5)
blank_layout = prs.slide_layouts[6]

# ══════════════════════════════════════════════════════════════════════════════
# SLIDE 1 — Title
# ══════════════════════════════════════════════════════════════════════════════
s = prs.slides.add_slide(blank_layout)

# Background
add_rect(s, 0, 0, Inches(13.333), Inches(7.5), DARK_GREY)

# Left accent column
add_rect(s, 0, 0, Inches(0.25), Inches(7.5), DARK_RED)

# Large red block behind title area
add_rect(s, Inches(0.25), Inches(1.8), Inches(13.083), Inches(2.8), RGBColor(0xAA,0x18,0x20))

# ECG-style horizontal line decoration
for y_off in [0.4, 0.5]:
    ln = s.shapes.add_connector(MSO_CONNECTOR.STRAIGHT,
        Inches(0.3), Inches(y_off * 7.5),
        Inches(13.0), Inches(y_off * 7.5))
    ln.line.color.rgb = RGBColor(0x80, 0x00, 0x10)
    ln.line.width = Pt(0.5)

# Title
add_text(s, "MYOCARDIAL INFARCTION",
         Inches(0.5), Inches(2.0), Inches(12.5), Inches(1.4),
         font_size=48, bold=True, color=WHITE,
         align=PP_ALIGN.CENTER, v_anchor=MSO_ANCHOR.MIDDLE)

# Subtitle
add_text(s, "Pathophysiology, Diagnosis & Management",
         Inches(0.5), Inches(3.5), Inches(12.5), Inches(0.6),
         font_size=22, color=LIGHT_RED,
         align=PP_ALIGN.CENTER, v_anchor=MSO_ANCHOR.MIDDLE)

# Horizontal divider
ln = s.shapes.add_connector(MSO_CONNECTOR.STRAIGHT,
    Inches(2.5), Inches(4.22), Inches(10.8), Inches(4.22))
ln.line.color.rgb = GOLD
ln.line.width = Pt(2)

# Tagline
add_text(s, '"Time is Muscle — Every Minute Counts"',
         Inches(0.5), Inches(4.3), Inches(12.5), Inches(0.5),
         font_size=14, italic=True, color=GOLD,
         align=PP_ALIGN.CENTER)

# Bottom chips
chips = ["Definition", "Pathogenesis", "Morphology", "Clinical Features",
         "Investigations", "Management", "Complications"]
chip_w = Inches(1.55)
chip_gap = Inches(0.08)
total = len(chips) * chip_w + (len(chips)-1) * chip_gap
start_x = (Inches(13.333) - total) / 2
for i, ch in enumerate(chips):
    cx = start_x + i * (chip_w + chip_gap)
    shp = add_rounded_rect(s, cx, Inches(5.8), chip_w, Inches(0.45),
                           RGBColor(0x55, 0x08, 0x0C), GOLD, 1)
    tf = shp.text_frame
    tf.margin_left = 0; tf.margin_top = 0
    tf.margin_right = 0; tf.margin_bottom = 0
    tf.vertical_anchor = MSO_ANCHOR.MIDDLE
    p = tf.paragraphs[0]
    p.alignment = PP_ALIGN.CENTER
    run = p.add_run()
    run.text = ch
    run.font.size = Pt(10)
    run.font.bold = True
    run.font.color.rgb = WHITE
    run.font.name = "Calibri"

# Bottom note
add_text(s, "University College Examination Preparation  |  Cardiology",
         Inches(0.4), Inches(6.9), Inches(12.5), Inches(0.4),
         font_size=10, color=RGBColor(0xAA, 0xAA, 0xAA),
         align=PP_ALIGN.CENTER)


# ══════════════════════════════════════════════════════════════════════════════
# SLIDE 2 — Definition & Epidemiology
# ══════════════════════════════════════════════════════════════════════════════
s = prs.slides.add_slide(blank_layout)
add_rect(s, 0, 0, Inches(13.333), Inches(7.5), WHITE)
add_header_bar(s, "Definition & Epidemiology",
               "What is a Heart Attack and Who Gets It?")

# Left card - definition
add_card(s, Inches(0.3), Inches(1.45), Inches(6.2), Inches(2.9), LIGHT_GREY, DARK_RED, 2)
add_text(s, "DEFINITION (2018 Universal Task Force)",
         Inches(0.45), Inches(1.55), Inches(5.9), Inches(0.35),
         font_size=13, bold=True, color=DARK_RED)
add_multiline_text(s, [
    '"Presence of acute myocardial injury detected by abnormal cardiac',
    'biomarkers in the setting of evidence of acute myocardial ischaemia"',
    '',
    ("MI = Necrosis of myocardium due to sustained ischaemia", True, DARK_GREY),
    ("Most severe form of Ischaemic Heart Disease (IHD)", False, MID_GREY),
    ("Underlying cause: Atherosclerosis in >90% of cases", False, MID_GREY),
],  Inches(0.45), Inches(1.92), Inches(5.9), Inches(2.3),
    font_size=12, color=MID_GREY)

# Right card - epidemiology
add_card(s, Inches(6.8), Inches(1.45), Inches(6.2), Inches(2.9), LIGHT_GREY, DARK_RED, 2)
add_text(s, "EPIDEMIOLOGY",
         Inches(6.95), Inches(1.55), Inches(5.9), Inches(0.35),
         font_size=13, bold=True, color=DARK_RED)
epi = [
    "Leading cause of death worldwide",
    "10% of MIs occur before age 40",
    "45% of MIs occur before age 65",
    "Men > Women (gap narrows after menopause)",
    "Declining estrogen post-menopause = major risk",
    "1-in-3 die before reaching hospital",
]
for i, e in enumerate(epi):
    add_text(s, f"  \u2022  {e}",
             Inches(6.95), Inches(1.92) + i * Inches(0.37),
             Inches(5.9), Inches(0.37), font_size=11.5, color=MID_GREY)

# Risk factors row
add_rect(s, Inches(0.3), Inches(4.5), Inches(12.7), Inches(0.32), DARK_RED)
add_text(s, "RISK FACTORS",
         Inches(0.45), Inches(4.52), Inches(3), Inches(0.28),
         font_size=12, bold=True, color=WHITE)

rf_non = ["Age", "Male sex", "Family history", "Genetics"]
rf_mod = ["Hypertension", "Hyperlipidaemia", "Diabetes mellitus", "Smoking"]
rf_mod2 = ["Obesity", "Sedentary lifestyle", "Stress", "Cocaine use"]

bullet_block(s, "Non-Modifiable", rf_non,
             Inches(0.3), Inches(4.9), Inches(4.1), Inches(1.9),
             bg_color=RGBColor(0xF9, 0xEC, 0xEC), border_color=MED_RED)
bullet_block(s, "Modifiable (Lifestyle)", rf_mod,
             Inches(4.6), Inches(4.9), Inches(4.1), Inches(1.9),
             bg_color=RGBColor(0xF9, 0xEC, 0xEC), border_color=MED_RED)
bullet_block(s, "Additional Modifiable", rf_mod2,
             Inches(8.9), Inches(4.9), Inches(4.1), Inches(1.9),
             bg_color=RGBColor(0xF9, 0xEC, 0xEC), border_color=MED_RED)


# ══════════════════════════════════════════════════════════════════════════════
# SLIDE 3 — Classification (5 types)
# ══════════════════════════════════════════════════════════════════════════════
s = prs.slides.add_slide(blank_layout)
add_rect(s, 0, 0, Inches(13.333), Inches(7.5), WHITE)
add_header_bar(s, "Classification of Myocardial Infarction",
               "Fourth Universal Definition (2018) — 5 Types")

types = [
    ("Type 1", "Spontaneous MI", "Atherosclerotic plaque rupture/erosion with thrombosis\nMost common type — true plaque event", DARK_RED),
    ("Type 2", "Supply-Demand Mismatch", "Ischaemic imbalance without plaque rupture\nCauses: tachycardia, anaemia, coronary spasm, hypotension", BLUE),
    ("Type 3", "Sudden Cardiac Death", "MI causing death before biomarkers can be obtained\nPresents as fatal arrhythmia", ORANGE),
    ("Type 4", "PCI-Related", "Peri-procedural MI during percutaneous coronary intervention\n(4a = during PCI; 4b = stent thrombosis)", TEAL),
    ("Type 5", "CABG-Related", "MI associated with coronary artery bypass graft surgery\nDiagnosed by biomarker + imaging evidence", GREEN),
]

card_w = Inches(2.45)
for i, (typ, name, desc, col) in enumerate(types):
    cx = Inches(0.25) + i * (card_w + Inches(0.1))
    # Card background
    shp = add_rounded_rect(s, cx, Inches(1.45), card_w, Inches(5.7),
                           LIGHT_GREY, col, 2)
    # Coloured top bar
    add_rect(s, cx, Inches(1.45), card_w, Inches(0.55), col)
    add_text(s, typ, cx, Inches(1.48), card_w, Inches(0.5),
             font_size=16, bold=True, color=WHITE, align=PP_ALIGN.CENTER)
    # Name
    add_text(s, name, cx + Inches(0.1), Inches(2.1), card_w - Inches(0.2), Inches(0.5),
             font_size=13, bold=True, color=col, align=PP_ALIGN.CENTER)
    # Divider
    ln = s.shapes.add_connector(MSO_CONNECTOR.STRAIGHT,
        cx + Inches(0.2), Inches(2.65), cx + card_w - Inches(0.2), Inches(2.65))
    ln.line.color.rgb = col
    ln.line.width = Pt(1)
    # Description
    add_multiline_text(s, desc.split('\n'),
                       cx + Inches(0.1), Inches(2.75),
                       card_w - Inches(0.2), Inches(4.1),
                       font_size=11, color=MID_GREY)

# Bottom note
add_text(s, "Treatment flows from the type: Revascularisation for Type 1 vs. reducing demand for Type 2",
         Inches(0.3), Inches(7.1), Inches(12.7), Inches(0.3),
         font_size=10, italic=True, color=MID_GREY, align=PP_ALIGN.CENTER)


# ══════════════════════════════════════════════════════════════════════════════
# SLIDE 4 — Pathogenesis (Coronary Occlusion Cascade)
# ══════════════════════════════════════════════════════════════════════════════
s = prs.slides.add_slide(blank_layout)
add_rect(s, 0, 0, Inches(13.333), Inches(7.5), WHITE)
add_header_bar(s, "Pathogenesis — Coronary Artery Occlusion",
               "Type 1 MI: Plaque Rupture → Thrombosis → Necrosis")

# Step cascade
steps = [
    ("1", "Plaque Disruption", "Atheromatous plaque eroded or ruptured by endothelial injury,\nintraplaque haemorrhage, or mechanical forces.\nExposes subendothelial collagen & necrotic contents.", DARK_RED),
    ("2", "Platelet Activation", "Platelets adhere, aggregate, and release\nThromboxane A2, ADP & Serotonin.\nCauses further aggregation and vasospasm.", MED_RED),
    ("3", "Coagulation Cascade", "Tissue factor exposure activates extrinsic pathway.\nFibrin mesh reinforces platelet plug.\nThrombus grows rapidly.", ORANGE),
    ("4", "Complete Occlusion", "Enlarging thrombus occludes coronary artery lumen\nwithin minutes.\nAngiography shows 90% occlusion within 4 hours of MI.", BLUE),
]

arrow_y = Inches(3.35)
for i, (num, title, desc, col) in enumerate(steps):
    cx = Inches(0.25) + i * Inches(3.25)
    add_card(s, cx, Inches(1.45), Inches(3.05), Inches(4.5), LIGHT_GREY, col, 2)
    number_badge(s, num, cx + Inches(1.3), Inches(1.55), col)
    add_text(s, title, cx + Inches(0.1), Inches(2.05), Inches(2.85), Inches(0.45),
             font_size=13, bold=True, color=col, align=PP_ALIGN.CENTER)
    ln = s.shapes.add_connector(MSO_CONNECTOR.STRAIGHT,
        cx + Inches(0.2), Inches(2.55), cx + Inches(2.85), Inches(2.55))
    ln.line.color.rgb = col
    ln.line.width = Pt(1.2)
    add_multiline_text(s, desc.split('\n'),
                       cx + Inches(0.15), Inches(2.65),
                       Inches(2.75), Inches(3.1),
                       font_size=11, color=MID_GREY)
    if i < 3:
        arr = s.shapes.add_connector(MSO_CONNECTOR.STRAIGHT,
            cx + Inches(3.05), arrow_y, cx + Inches(3.25), arrow_y)
        arr.line.color.rgb = DARK_RED
        arr.line.width = Pt(3)

# Bottom box — Ischaemic timeline
add_rect(s, Inches(0.25), Inches(6.1), Inches(12.8), Inches(1.1), RGBColor(0xF5, 0xEC, 0xEC))
add_rect(s, Inches(0.25), Inches(6.1), Inches(12.8), Inches(0.05), DARK_RED)
add_text(s, "ISCHAEMIC TIMELINE", Inches(0.4), Inches(6.15), Inches(3), Inches(0.3),
         font_size=11, bold=True, color=DARK_RED)
timeline = [
    ("Seconds", "Aerobic metabolism stops; ATP ↓; lactate accumulates"),
    ("Minutes", "Loss of contractility — REVERSIBLE at this stage"),
    ("20–40 min", "IRREVERSIBLE damage — coagulative necrosis begins"),
    (">40 min", "Wavefront necrosis spreads: subendocardium → epicardium"),
]
for i, (tm, ev) in enumerate(timeline):
    tx = Inches(0.4) + i * Inches(3.2)
    add_text(s, tm, tx, Inches(6.5), Inches(1.4), Inches(0.25),
             font_size=11, bold=True, color=DARK_RED)
    add_text(s, ev, tx, Inches(6.75), Inches(3.1), Inches(0.35),
             font_size=10, color=MID_GREY)


# ══════════════════════════════════════════════════════════════════════════════
# SLIDE 5 — Morphological Changes (Gross + Microscopic)
# ══════════════════════════════════════════════════════════════════════════════
s = prs.slides.add_slide(blank_layout)
add_rect(s, 0, 0, Inches(13.333), Inches(7.5), WHITE)
add_header_bar(s, "Morphological Changes of Myocardial Infarction",
               "Gross and Microscopic Evolution Over Time")

# Table header
col_headers = ["Time", "Gross Appearance", "Microscopic Findings", "Clinical Significance"]
col_widths = [Inches(1.4), Inches(3.5), Inches(4.5), Inches(3.5)]
col_x = [Inches(0.25), Inches(1.65), Inches(5.15), Inches(9.65)]

# header row
for j, (hdr, w, x) in enumerate(zip(col_headers, col_widths, col_x)):
    add_rect(s, x, Inches(1.45), w, Inches(0.38), DARK_RED)
    add_text(s, hdr, x + Inches(0.05), Inches(1.48),
             w - Inches(0.1), Inches(0.32),
             font_size=11, bold=True, color=WHITE, align=PP_ALIGN.CENTER)

rows = [
    ("0–6 hrs", "No visible change", "Wavy fibres; early coagulative necrosis; marginal oedema", "Golden period for reperfusion"),
    ("12–24 hrs", "Dark mottling, discolouration", "Coagulative necrosis with nuclear pyknosis; neutrophil margination", "Biomarkers peak (CK-MB)"),
    ("1–3 days", "Pale, soft, yellow-tan infarct", "Dense neutrophilic infiltrate; karyolysis; cytoplasmic eosinophilia", "High risk of arrhythmia"),
    ("3–7 days", "Hyperaemic (red) border; softest zone", "Macrophages phagocytose debris; early granulation tissue", "Risk of cardiac rupture"),
    ("1–3 wks", "Yellow centre, red-brown border", "Granulation tissue with fibroblasts & new capillaries", "Organising — scar forming"),
    (">6 wks", "White/grey firm scar", "Dense collagen scar; no viable myocytes", "Permanent dysfunction"),
]

row_colors = [WHITE, LIGHT_GREY, WHITE, LIGHT_GREY, WHITE, LIGHT_GREY]
for i, (row, bg) in enumerate(zip(rows, row_colors)):
    ry = Inches(1.83) + i * Inches(0.83)
    for j, (cell, w, x) in enumerate(zip(row, col_widths, col_x)):
        add_rect(s, x, ry, w, Inches(0.83), bg, MID_GREY, 0.3)
        col_c = DARK_RED if j == 0 else MID_GREY
        bold_c = True if j == 0 else False
        add_text(s, cell, x + Inches(0.06), ry + Inches(0.08),
                 w - Inches(0.12), Inches(0.67),
                 font_size=10.5, color=col_c, bold=bold_c)

add_text(s, "Key: Necrosis progresses from subendocardium outward (wavefront phenomenon). Subendocardial region is most vulnerable due to higher O2 demand and systolic compression.",
         Inches(0.25), Inches(7.05), Inches(12.8), Inches(0.35),
         font_size=9.5, italic=True, color=MID_GREY)


# ══════════════════════════════════════════════════════════════════════════════
# SLIDE 6 — Clinical Features
# ══════════════════════════════════════════════════════════════════════════════
s = prs.slides.add_slide(blank_layout)
add_rect(s, 0, 0, Inches(13.333), Inches(7.5), WHITE)
add_header_bar(s, "Clinical Features",
               "Symptoms, Signs and Atypical Presentations")

# Symptoms column
add_section_label(s, "Symptoms", Inches(0.3), Inches(1.5), Inches(3.2))
syms = [
    ("Chest Pain", "Central, crushing/squeezing, >20 min, not relieved by nitrates"),
    ("Radiation", "Left arm, jaw, neck, back, epigastrium"),
    ("Dyspnoea", "Due to impaired LV function / pulmonary oedema"),
    ("Diaphoresis", "Cold, clammy sweat — sympathetic activation"),
    ("Nausea/Vomiting", "Vagal response — common with inferior MI"),
    ("Palpitations", "Arrhythmias; may present as syncope or dizziness"),
]
for i, (s_name, s_desc) in enumerate(syms):
    ry = Inches(1.92) + i * Inches(0.77)
    add_rect(s, Inches(0.3), ry, Inches(6.0), Inches(0.72),
             LIGHT_GREY if i % 2 == 0 else WHITE, LIGHT_RED, 0.5)
    add_text(s, s_name, Inches(0.4), ry + Inches(0.06),
             Inches(1.5), Inches(0.3), font_size=11, bold=True, color=DARK_RED)
    add_text(s, s_desc, Inches(1.95), ry + Inches(0.06),
             Inches(4.2), Inches(0.6), font_size=10.5, color=MID_GREY)

# Signs column
add_section_label(s, "Signs on Examination", Inches(6.6), Inches(1.5), Inches(4.0))
signs = [
    "Pallor, cold clammy peripheries",
    "Tachycardia; hypotension in large infarcts",
    "S3 or S4 gallop rhythm",
    "New murmur: MR (papillary rupture) or VSD",
    "Elevated JVP, pulmonary crackles",
    "Pericardial friction rub (Day 2–3, transmural MI)",
    "Signs of cardiogenic shock: oliguria, confusion",
]
for i, sg in enumerate(signs):
    add_text(s, f"  \u2713  {sg}",
             Inches(6.6), Inches(1.92) + i * Inches(0.62),
             Inches(6.4), Inches(0.55),
             font_size=11, color=MID_GREY)
    ln = s.shapes.add_connector(MSO_CONNECTOR.STRAIGHT,
        Inches(6.6), Inches(1.92) + i * Inches(0.62) + Inches(0.55),
        Inches(13.0), Inches(1.92) + i * Inches(0.62) + Inches(0.55))
    ln.line.color.rgb = LIGHT_RED
    ln.line.width = Pt(0.5)

# Vertical divider
ln = s.shapes.add_connector(MSO_CONNECTOR.STRAIGHT,
    Inches(6.45), Inches(1.45), Inches(6.45), Inches(7.2))
ln.line.color.rgb = LIGHT_RED
ln.line.width = Pt(1)

# Atypical banner
add_rect(s, Inches(0.3), Inches(7.0), Inches(12.8), Inches(0.35), RGBColor(0xFF, 0xF3, 0xCD))
add_rect(s, Inches(0.3), Inches(7.0), Inches(0.35), Inches(0.35), GOLD)
add_text(s, "  \u26a0  ATYPICAL / SILENT MI: Diabetics, Women, Elderly — may present with epigastric pain, fatigue, dyspnoea only, or NO chest pain. Always check ECG + troponins.",
         Inches(0.65), Inches(7.02), Inches(12.4), Inches(0.31),
         font_size=10, color=RGBColor(0x5A, 0x40, 0x00), italic=True)


# ══════════════════════════════════════════════════════════════════════════════
# SLIDE 7 — Investigations (ECG + Biomarkers)
# ══════════════════════════════════════════════════════════════════════════════
s = prs.slides.add_slide(blank_layout)
add_rect(s, 0, 0, Inches(13.333), Inches(7.5), WHITE)
add_header_bar(s, "Investigations",
               "ECG Changes, Cardiac Biomarkers & Imaging")

# ECG section
add_section_label(s, "ECG Changes by Phase", Inches(0.3), Inches(1.45), Inches(4.2))

ecg_phases = [
    ("Hyperacute (mins)", "Tall, peaked T waves (hyperacute T)", ORANGE),
    ("Acute Phase (hrs)", "ST elevation (STEMI) in leads over infarct\nReciprocal ST depression in opposite leads", DARK_RED),
    ("Hours-Days", "T-wave inversion develops", MED_RED),
    ("Days-Weeks", "Pathological Q waves (>40ms; >25% R height)\nPermanent sign of transmural necrosis", BLUE),
    ("NSTEMI", "ST depression or T-wave changes\nNo Q waves — subendocardial infarct", TEAL),
]
for i, (ph, desc, col) in enumerate(ecg_phases):
    ry = Inches(1.88) + i * Inches(0.95)
    add_rect(s, Inches(0.3), ry, Inches(6.0), Inches(0.9),
             LIGHT_GREY if i % 2 == 0 else WHITE, col, 1)
    add_text(s, ph, Inches(0.4), ry + Inches(0.05),
             Inches(2.0), Inches(0.35), font_size=11, bold=True, color=col)
    add_text(s, desc, Inches(2.45), ry + Inches(0.05),
             Inches(3.7), Inches(0.8), font_size=10.5, color=MID_GREY)

# ECG lead localisation mini-table
add_section_label(s, "Localisation on ECG", Inches(0.3), Inches(6.65), Inches(3.5))
loc_data = [
    ("Anterior (LAD)", "V1 – V4"), ("Lateral (LCX)", "I, aVL, V5–V6"),
    ("Inferior (RCA)", "II, III, aVF"), ("Posterior", "R in V1, ST depression V1-V3"),
]
for i, (terr, leads) in enumerate(loc_data):
    tx = Inches(0.3) + i * Inches(3.05)
    shp = add_rounded_rect(s, tx, Inches(7.0), Inches(2.9), Inches(0.38),
                           DARK_RED, DARK_RED, 0)
    tf = shp.text_frame
    tf.margin_left = Inches(0.05); tf.margin_top = Inches(0.04)
    tf.vertical_anchor = MSO_ANCHOR.MIDDLE
    p = tf.paragraphs[0]
    run = p.add_run()
    run.text = f"{terr}: {leads}"
    run.font.size = Pt(10)
    run.font.color.rgb = WHITE
    run.font.bold = True
    run.font.name = "Calibri"

# Biomarker table
add_section_label(s, "Cardiac Biomarkers", Inches(6.6), Inches(1.45), Inches(3.5))
bio_headers = ["Marker", "Rises", "Peaks", "Normal", "Note"]
bio_widths = [Inches(1.4), Inches(0.9), Inches(0.9), Inches(1.1), Inches(2.2)]
bio_x = [Inches(6.6), Inches(8.0), Inches(8.9), Inches(9.8), Inches(10.9)]

for j, (hdr, w, x) in enumerate(zip(bio_headers, bio_widths, bio_x)):
    add_rect(s, x, Inches(1.88), w, Inches(0.35), DARK_RED)
    add_text(s, hdr, x + Inches(0.03), Inches(1.9),
             w - Inches(0.06), Inches(0.31),
             font_size=10, bold=True, color=WHITE, align=PP_ALIGN.CENTER)

bio_rows = [
    ("Troponin I/T", "3–6 h", "12–24 h", "7–14 d", "Gold standard; most sensitive+specific"),
    ("CK-MB", "4–6 h", "24 h", "48–72 h", "Good for detecting reinfarction"),
    ("Myoglobin", "1–4 h", "6–9 h", "24 h", "Earliest — not cardiac-specific"),
    ("LDH", "24–48 h", "3–6 d", "8–14 d", "Late presentations"),
]
bio_bgs = [WHITE, LIGHT_GREY, WHITE, LIGHT_GREY]
for i, (row, bg) in enumerate(zip(bio_rows, bio_bgs)):
    ry = Inches(2.23) + i * Inches(0.72)
    for j, (cell, w, x) in enumerate(zip(row, bio_widths, bio_x)):
        add_rect(s, x, ry, w, Inches(0.72), bg, MID_GREY, 0.3)
        col_c = DARK_RED if j == 0 else MID_GREY
        add_text(s, cell, x + Inches(0.04), ry + Inches(0.08),
                 w - Inches(0.08), Inches(0.56),
                 font_size=10, color=col_c, bold=(j == 0))

# Other investigations box
add_rect(s, Inches(6.6), Inches(5.2), Inches(6.5), Inches(0.28), DARK_RED)
add_text(s, "OTHER KEY INVESTIGATIONS",
         Inches(6.65), Inches(5.22), Inches(6.4), Inches(0.24),
         font_size=10, bold=True, color=WHITE)
other_inv = [
    "\u2022 CXR: cardiomegaly, pulmonary oedema, pleural effusion",
    "\u2022 Echocardiography: wall motion abnormalities, EF, complications (MR, VSD)",
    "\u2022 Coronary angiography: defines anatomy, guides PCI",
    "\u2022 FBC: leukocytosis (elevated WBC = worse prognosis)",
]
for i, inv in enumerate(other_inv):
    add_text(s, inv, Inches(6.65), Inches(5.52) + i * Inches(0.42),
             Inches(6.4), Inches(0.4), font_size=10.5, color=MID_GREY)

# Vertical divider
ln = s.shapes.add_connector(MSO_CONNECTOR.STRAIGHT,
    Inches(6.45), Inches(1.45), Inches(6.45), Inches(7.2))
ln.line.color.rgb = LIGHT_RED
ln.line.width = Pt(1)


# ══════════════════════════════════════════════════════════════════════════════
# SLIDE 8 — Management (STEMI + NSTEMI)
# ══════════════════════════════════════════════════════════════════════════════
s = prs.slides.add_slide(blank_layout)
add_rect(s, 0, 0, Inches(13.333), Inches(7.5), WHITE)
add_header_bar(s, "Acute Management",
               "STEMI vs NSTEMI — Time-Sensitive Interventions")

# Immediate MONA row
add_rect(s, Inches(0.25), Inches(1.42), Inches(12.8), Inches(0.32), DARK_RED)
add_text(s, "IMMEDIATE TREATMENT  —  M.O.N.A. + Dual Antiplatelet",
         Inches(0.35), Inches(1.44), Inches(12.5), Inches(0.28),
         font_size=12, bold=True, color=WHITE)

mona = [
    ("M", "Morphine", "IV opioid for pain; reduces sympathetic drive. Use cautiously (may mask symptoms).", DARK_RED),
    ("O", "Oxygen", "If SpO2 <94%. Avoid in normoxic patients — may increase mortality.", ORANGE),
    ("N", "Nitrates", "GTN sublingual/IV for pain & hypertension.\nCONTRAINDICATED in right-sided MI, hypotension.", MED_RED),
    ("A", "Aspirin", "300 mg loading dose. Irreversible COX-1 inhibition.\nGive to ALL patients immediately.", BLUE),
    ("+", "P2Y12", "Clopidogrel / Ticagrelor / Prasugrel.\nDual antiplatelet + heparin anticoagulation.", TEAL),
]
for i, (letter, name, desc, col) in enumerate(mona):
    cx = Inches(0.25) + i * Inches(2.58)
    add_card(s, cx, Inches(1.82), Inches(2.48), Inches(2.15), LIGHT_GREY, col, 2)
    # Letter circle
    shp = s.shapes.add_shape(MSO_SHAPE.OVAL,
        cx + Inches(0.95), Inches(1.9), Inches(0.55), Inches(0.55))
    shp.fill.solid(); shp.fill.fore_color.rgb = col
    shp.line.fill.background(); shp.shadow.inherit = False
    tf = shp.text_frame; tf.vertical_anchor = MSO_ANCHOR.MIDDLE
    tf.margin_left = 0; tf.margin_top = 0; tf.margin_right = 0; tf.margin_bottom = 0
    p = tf.paragraphs[0]; p.alignment = PP_ALIGN.CENTER
    run = p.add_run(); run.text = letter
    run.font.size = Pt(16); run.font.bold = True
    run.font.color.rgb = WHITE; run.font.name = "Calibri"
    add_text(s, name, cx + Inches(0.05), Inches(2.5),
             Inches(2.38), Inches(0.3), font_size=12, bold=True, color=col,
             align=PP_ALIGN.CENTER)
    add_text(s, desc, cx + Inches(0.08), Inches(2.82),
             Inches(2.32), Inches(1.1), font_size=10, color=MID_GREY)

# STEMI column
add_section_label(s, "STEMI Reperfusion", Inches(0.25), Inches(4.1), Inches(3.2), DARK_RED)
stemi_items = [
    "PRIMARY PCI = preferred (door-to-balloon <90 min)",
    "Balloon angioplasty ± stent — directly opens vessel",
    "THROMBOLYSIS if PCI unavailable within 120 min",
    "Agents: Alteplase, Tenecteplase, Streptokinase",
    "Give within 12 hrs of symptoms",
    "CI: recent surgery, stroke, active bleeding",
]
for i, it in enumerate(stemi_items):
    add_text(s, f"  \u2022  {it}",
             Inches(0.25), Inches(4.52) + i * Inches(0.43),
             Inches(6.1), Inches(0.43), font_size=11, color=MID_GREY)

# NSTEMI column
add_section_label(s, "NSTEMI / UA Management", Inches(6.7), Inches(4.1), Inches(3.8), BLUE)
nstemi_items = [
    "Early invasive strategy: angiography within 24–72 hrs",
    "High-risk: elevated troponin, dynamic ECG, haemodynamic instability",
    "Beta-blocker: reduces O2 demand (avoid in shock/bradycardia)",
    "ACE inhibitor: begin early, especially if EF <40%",
    "Statin: high-intensity (atorvastatin 40–80 mg)",
    "Risk stratify: GRACE or TIMI score",
]
for i, it in enumerate(nstemi_items):
    add_text(s, f"  \u2022  {it}",
             Inches(6.7), Inches(4.52) + i * Inches(0.43),
             Inches(6.3), Inches(0.43), font_size=11, color=MID_GREY)

# Vertical divider
ln = s.shapes.add_connector(MSO_CONNECTOR.STRAIGHT,
    Inches(6.55), Inches(4.1), Inches(6.55), Inches(7.2))
ln.line.color.rgb = LIGHT_RED
ln.line.width = Pt(1.2)

# Key tagline
add_rect(s, Inches(0.25), Inches(7.1), Inches(12.8), Inches(0.3), RGBColor(0xF5, 0xEC, 0xEC))
add_text(s, "\u23f0  TIME IS MUSCLE — For STEMI, every 30-minute delay in PCI increases mortality by ~7.5%",
         Inches(0.4), Inches(7.12), Inches(12.5), Inches(0.26),
         font_size=10.5, bold=True, color=DARK_RED, align=PP_ALIGN.CENTER)


# ══════════════════════════════════════════════════════════════════════════════
# SLIDE 9 — Secondary Prevention + Complications
# ══════════════════════════════════════════════════════════════════════════════
s = prs.slides.add_slide(blank_layout)
add_rect(s, 0, 0, Inches(13.333), Inches(7.5), WHITE)
add_header_bar(s, "Complications & Secondary Prevention",
               "Post-MI Sequelae and Long-Term Drug Therapy")

# Complications — Left
add_section_label(s, "Complications", Inches(0.25), Inches(1.45), Inches(3.2))

early_c = [
    ("Ventricular Fibrillation", "Most common cause of early death.\nPeak risk: 1st 10 min, then again at 1 hr.\nK+ loss, injury currents, sympathetic activation."),
    ("Cardiogenic Shock", "Occurs when >40% LV infarcted.\nSystemic stretch reduces pump output.\nMortality 40–50% even with treatment."),
    ("Acute Pulmonary Oedema", "From impaired LV function.\nManage: diuretics, CPAP, inotropes."),
    ("Heart Block / Bradycardia", "Inferior MI (RCA) — AV node involvement.\nMay require temporary pacing."),
]
add_text(s, "Early (within 48 hours)",
         Inches(0.25), Inches(1.85), Inches(6.15), Inches(0.3),
         font_size=11, bold=True, italic=True, color=DARK_RED)
for i, (ttl, desc) in enumerate(early_c):
    ry = Inches(2.2) + i * Inches(1.02)
    add_rect(s, Inches(0.25), ry, Inches(6.15), Inches(0.97),
             LIGHT_GREY if i % 2 == 0 else WHITE, DARK_RED, 0.7)
    add_text(s, ttl, Inches(0.35), ry + Inches(0.05),
             Inches(5.9), Inches(0.3), font_size=11, bold=True, color=DARK_RED)
    add_text(s, desc, Inches(0.35), ry + Inches(0.35),
             Inches(5.9), Inches(0.58), font_size=10, color=MID_GREY)

late_c = [
    "Dressler's Syndrome (autoimmune pericarditis, weeks later)",
    "Ventricular Aneurysm (paradoxical bulge → thrombus → embolism)",
    "Ventricular Septal Defect (acute left-to-right shunt)",
    "Papillary Muscle Rupture → Acute Severe Mitral Regurgitation",
    "Mural Thrombus → Systemic embolism (stroke)",
]
add_text(s, "Late Complications",
         Inches(0.25), Inches(6.28), Inches(6.15), Inches(0.3),
         font_size=11, bold=True, italic=True, color=ORANGE)
for i, lc in enumerate(late_c):
    add_text(s, f"  \u25b8  {lc}",
             Inches(0.25), Inches(6.6) + i * Inches(0.15),
             Inches(6.15), Inches(0.15), font_size=10, color=MID_GREY)

# Actually let's just use a box for late complications
add_rect(s, Inches(0.25), Inches(6.25), Inches(6.15), Inches(0.3), ORANGE)
add_text(s, "LATE COMPLICATIONS",
         Inches(0.35), Inches(6.27), Inches(5.9), Inches(0.26),
         font_size=11, bold=True, color=WHITE)
for i, lc in enumerate(late_c):
    add_text(s, f"  \u25b8  {lc}",
             Inches(0.25), Inches(6.6) + i * Inches(0.16),
             Inches(6.15), Inches(0.16), font_size=9.5, color=MID_GREY)

# Secondary Prevention — Right
add_section_label(s, "Secondary Prevention", Inches(6.65), Inches(1.45), Inches(3.5), BLUE)

drugs = [
    ("Aspirin 75–100 mg OD", "Indefinitely. Antiplatelet.", DARK_RED),
    ("P2Y12 Inhibitor", "12 months post-stent (dual antiplatelet).", DARK_RED),
    ("High-Intensity Statin", "Atorvastatin 40–80 mg. Lipid-lowering + pleiotropic.", BLUE),
    ("ACE Inhibitor / ARB", "Reduces afterload, prevents LV remodelling. Esp. if EF <40%.", TEAL),
    ("Beta-Blocker", "Reduces mortality, prevents reinfarction & arrhythmia.", GREEN),
    ("Aldosterone Antagonist", "Eplerenone/Spironolactone. If EF <40% with HF or diabetes.", ORANGE),
]

for i, (drug, desc, col) in enumerate(drugs):
    ry = Inches(1.88) + i * Inches(0.82)
    add_rect(s, Inches(6.65), ry, Inches(6.4), Inches(0.77),
             LIGHT_GREY if i % 2 == 0 else WHITE, col, 0.8)
    # Pill icon (oval)
    pill = s.shapes.add_shape(MSO_SHAPE.OVAL,
        Inches(6.75), ry + Inches(0.22), Inches(0.3), Inches(0.3))
    pill.fill.solid(); pill.fill.fore_color.rgb = col
    pill.line.fill.background(); pill.shadow.inherit = False
    add_text(s, drug, Inches(7.12), ry + Inches(0.06),
             Inches(3.6), Inches(0.28), font_size=11, bold=True, color=col)
    add_text(s, desc, Inches(7.12), ry + Inches(0.36),
             Inches(5.8), Inches(0.35), font_size=10, color=MID_GREY)

add_text(s, "LIFESTYLE: Smoking cessation | Cardiac rehab | Diet & exercise | BP & glucose control",
         Inches(6.65), Inches(6.83), Inches(6.4), Inches(0.3),
         font_size=10, bold=True, color=GREEN, align=PP_ALIGN.CENTER)

# Vertical divider
ln = s.shapes.add_connector(MSO_CONNECTOR.STRAIGHT,
    Inches(6.5), Inches(1.45), Inches(6.5), Inches(7.2))
ln.line.color.rgb = LIGHT_RED
ln.line.width = Pt(1)


# ══════════════════════════════════════════════════════════════════════════════
# SLIDE 10 — Summary / Key Points
# ══════════════════════════════════════════════════════════════════════════════
s = prs.slides.add_slide(blank_layout)
add_rect(s, 0, 0, Inches(13.333), Inches(7.5), DARK_GREY)
add_rect(s, 0, 0, Inches(0.25), Inches(7.5), DARK_RED)

add_text(s, "KEY TAKEAWAYS",
         Inches(0.4), Inches(0.25), Inches(12.5), Inches(0.7),
         font_size=30, bold=True, color=WHITE, align=PP_ALIGN.CENTER)
ln = s.shapes.add_connector(MSO_CONNECTOR.STRAIGHT,
    Inches(2), Inches(1.05), Inches(11.333), Inches(1.05))
ln.line.color.rgb = DARK_RED
ln.line.width = Pt(2.5)

takeaways = [
    ("Definition", "MI = necrosis of myocardium from ischaemia; defined by biomarker rise + clinical/ECG evidence of ischaemia.", DARK_RED),
    ("Most Common Cause", "Type 1 MI: atherosclerotic plaque rupture → platelet activation → thrombotic coronary occlusion.", MED_RED),
    ("Critical Timeline", "Irreversible injury begins at 20–40 minutes. Subendocardium is affected first (wavefront necrosis).", ORANGE),
    ("ECG Hallmarks", "STEMI: ST elevation + Q waves. NSTEMI: ST depression or T-wave inversion, no Q waves.", GOLD),
    ("Best Biomarker", "Troponin I/T — rises at 3–6 h, peaks 12–24 h, most sensitive and specific. Used for all types.", TEAL),
    ("Reperfusion Priority", "STEMI: primary PCI (<90 min door-to-balloon) or thrombolysis. Time is muscle!", GREEN),
    ("Secondary Prevention", "Aspirin + P2Y12 + Statin + ACE inhibitor + Beta-blocker. All reduce mortality.", BLUE),
    ("Deadly Complications", "VF (early death), cardiogenic shock (>40% LV lost), Dressler's, papillary rupture, VSD.", RGBColor(0xF5,0x60,0x42)),
]

col1 = takeaways[:4]
col2 = takeaways[4:]
for col_idx, col_data in enumerate([col1, col2]):
    cx = Inches(0.4) + col_idx * Inches(6.5)
    for i, (title, desc, col) in enumerate(col_data):
        ry = Inches(1.2) + i * Inches(1.45)
        # Coloured side bar
        add_rect(s, cx, ry, Inches(0.12), Inches(1.3), col)
        add_text(s, title,
                 cx + Inches(0.22), ry + Inches(0.05),
                 Inches(5.9), Inches(0.38),
                 font_size=13, bold=True, color=col)
        add_text(s, desc,
                 cx + Inches(0.22), ry + Inches(0.45),
                 Inches(5.9), Inches(0.75),
                 font_size=11, color=RGBColor(0xCC, 0xCC, 0xCC))

add_text(s, "Robbins & Kumar Basic Pathology  |  Guyton & Hall Medical Physiology  |  Ganong's Review  |  Sabiston Textbook of Surgery",
         Inches(0.4), Inches(7.1), Inches(12.5), Inches(0.3),
         font_size=9, italic=True, color=RGBColor(0x77, 0x77, 0x77),
         align=PP_ALIGN.CENTER)


# ─── Save ──────────────────────────────────────────────────────────────────────
out_path = "/tmp/workspace/mi-presentation/Myocardial_Infarction.pptx"
from io import BytesIO
buf = BytesIO()
prs.save(buf)
with open(out_path, "wb") as f:
    f.write(buf.getvalue())

print(f"Saved: {out_path}")
import os
size_kb = os.path.getsize(out_path) // 1024
print(f"File size: {size_kb} KB")
print(f"Slides: {len(prs.slides)}")
cd /tmp/workspace/mi-presentation && python build_mi_pptx.py
Myocardial Infarction
Presentation · PPTX
| # | Slide Title |
|---|---|
| 1 | Title Slide - Dark background with gold accents and topic chips |
| 2 | Definition & Epidemiology - 2018 Universal Definition + risk factors |
| 3 | Classification - All 5 types (Fourth Universal Definition) in colour-coded cards |
| 4 | Pathogenesis - 4-step plaque rupture cascade with ischaemic timeline |
| 5 | Morphological Changes - Gross + microscopic evolution table (0 hrs → 6 wks) |
| 6 | Clinical Features - Symptoms table + examination signs + atypical warning |
| 7 | Investigations - ECG phases, ECG localisation, cardiac biomarker table |
| 8 | Acute Management - MONA mnemonic + STEMI vs NSTEMI reperfusion strategies |
| 9 | Complications & Secondary Prevention - Early/late complications + 6-drug regimen |
| 10 | Key Takeaways - 8-point summary on dark background for revision |