Explain ECG in detail
Reading File
Finding Sources
Finding Sources
Finding Sources
Finding Sources
Reading File
Reading File
Reading File
Reading File
Reading File
Reading File
Reading File
Reading File
Loading Image
Loading Image
Loading Image
Reading File
I have comprehensive content now. Let me compile the full detailed answer:
Electrocardiogram (ECG) - A Detailed Guide
What Is an ECG?
An electrocardiogram (ECG, or EKG from the German Elektrokardiogramm) is a non-invasive recording of the electrical activity of the heart obtained by placing electrodes on the skin surface. Electrical currents generated by the depolarizing and repolarizing myocardium spread into surrounding tissues and ultimately reach the body's surface, where they can be measured. By recording from multiple vantage points simultaneously, the ECG allows analysis of electrical activation across different myocardial regions. The technique has changed remarkably little since Willem Einthoven introduced it in the early 1900s and remains one of the most widely used diagnostic tools in medicine.
- Goldman-Cecil Medicine, p. 420
1. The Cardiac Electrical Basis
Before understanding the ECG trace, you need to understand the electrical events that create it:
The Conduction System
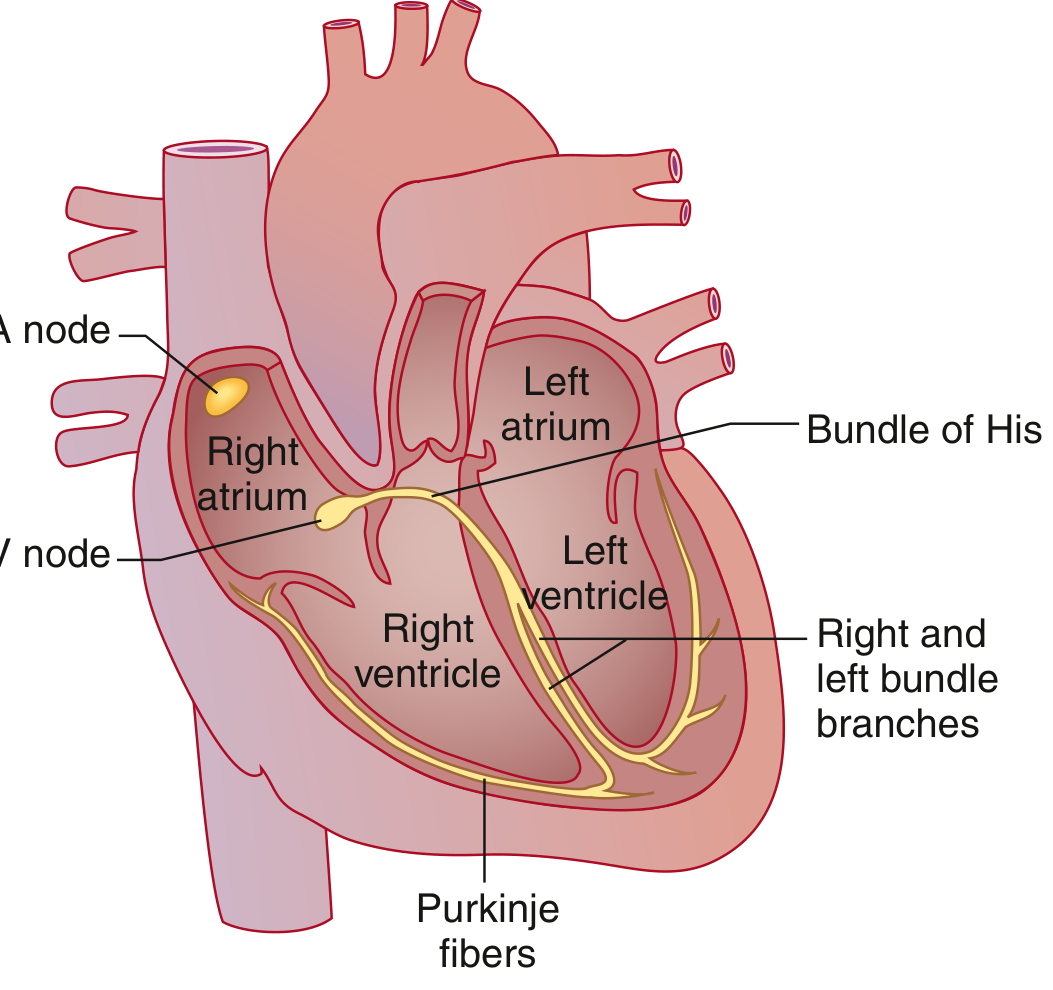
The cardiac conduction system - Goldman-Cecil Medicine
The sequence of normal cardiac activation:
- SA Node (Sinoatrial node) - Located in the high lateral epicardial right atrium near the superior vena cava. It spontaneously depolarizes at the highest rate (~60-100/min), making it the dominant pacemaker. Its depolarization is not visible on the surface ECG.
- Atrial conduction - The depolarizing wavefront spreads through the right and left atria. The Bachmann bundle speeds conduction to the left atrium. Atrial depolarization triggers contraction, pushing blood through the mitral and tricuspid valves.
- AV Node - The only normal electrical bridge between atria and ventricles (the AV valve rings are electrically insulated). The AV node intentionally slows conduction, providing the delay that allows atrial contraction to fill the ventricles before ventricular systole.
- Bundle of His - Exits the AV node; specialized fast-conducting tissue.
- Bundle Branches - The His bundle bifurcates into right bundle branch (RBB) and left bundle branch (LBB). The LBB further divides into left anterior fascicle (LAF) and left posterior fascicle (LPF).
- Purkinje Fibers - The distal ramifications that deliver the impulse rapidly to ventricular myocardium.
- Ventricular myocardium - Depolarizes from endocardium to epicardium, triggering ventricular contraction.
After depolarization, a recovery period called repolarization returns cells to resting potential, allowing the next cycle.
- Goldman-Cecil Medicine, p. 421; Guyton and Hall, p. 142
2. The ECG Waveforms
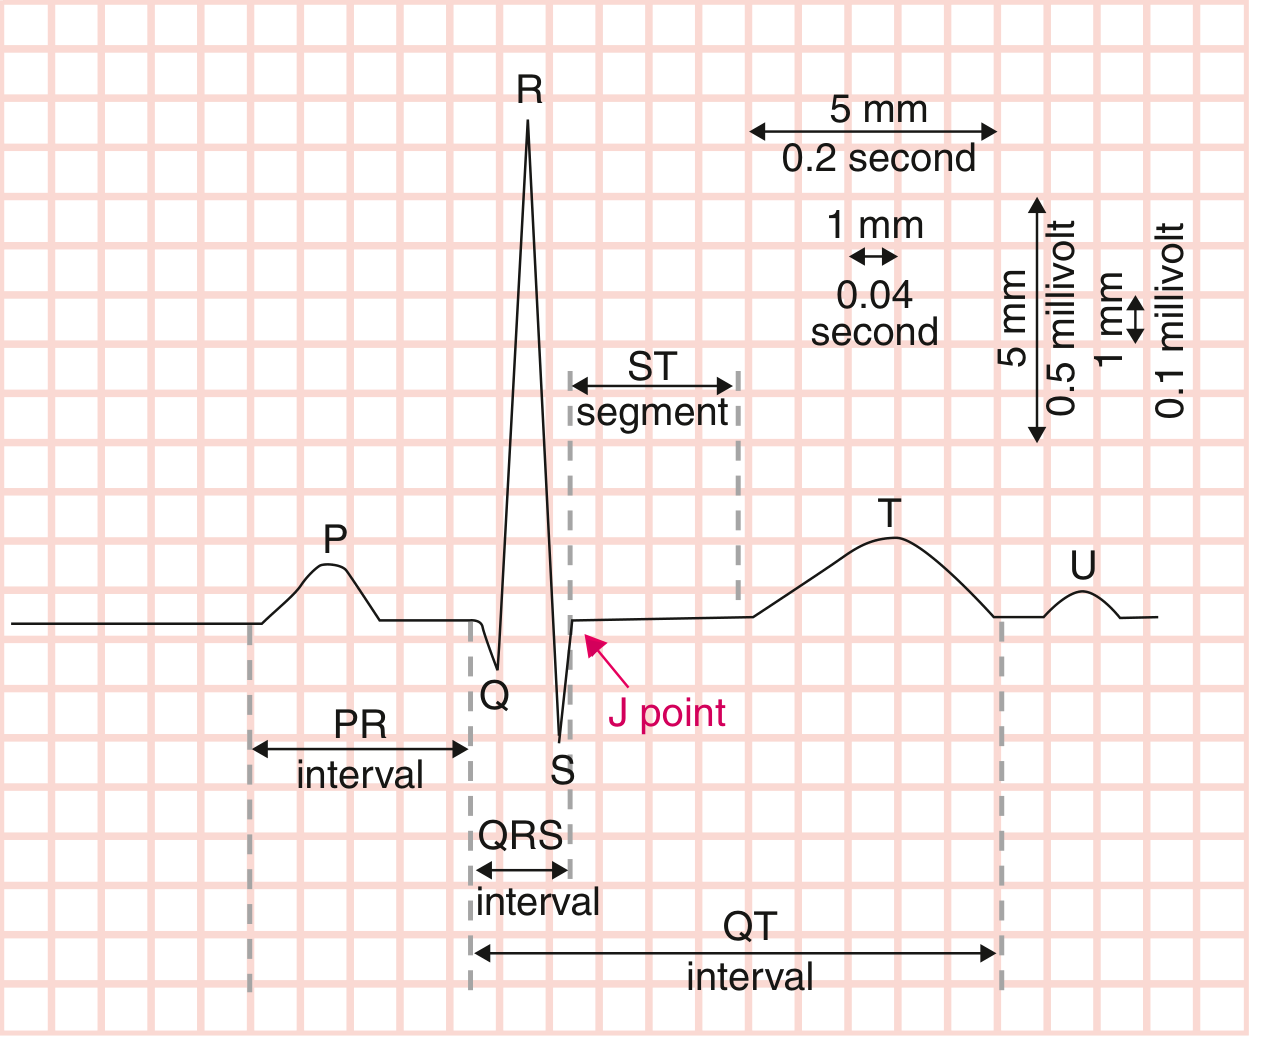
Normal ECG waveform with all labeled components - Guyton and Hall
Each recognizable wave corresponds to a specific electrical event:
P Wave
- Represents atrial muscular depolarization
- Normally small, rounded, upright in most leads
- Normal amplitude: 0.1-0.3 mV; duration < 120 msec
- Absent in atrial fibrillation; abnormally tall in right atrial enlargement; wide/notched in left atrial enlargement
PR Interval
- Measured from the onset of the P wave to the onset of the QRS complex
- Represents: conduction time through atrial muscle + AV node delay + His-Purkinje system
- Normal: 0.09 to 0.20 second (90-200 msec)
- PR > 200 msec = first-degree AV block (delayed AV conduction)
- Short PR = ventricular preexcitation (Wolff-Parkinson-White syndrome) or junctional rhythm
QRS Complex
- Represents ventricular muscular depolarization
- Much larger than the P wave due to greater ventricular muscle mass
- Normal duration: 75-110 msec (< 3 small boxes); duration ≥ 120 msec = bundle branch block
- Wave naming convention:
- Capital letters (Q, R, S) = large amplitude (≥ 5 mm / 0.5 mV)
- Lowercase letters (q, r, s) = small amplitude (< 5 mm / 0.5 mV)
- Q/q = initial negative deflection
- R/r = positive deflection
- S/s = negative deflection following an R wave
- QS complex = entirely negative deflection
- R' = second positive deflection after S wave
ST Segment
- The flat segment from the end of the QRS (J point) to the start of the T wave
- Normally isoelectric (on the baseline)
- ST elevation = myocardial injury/infarction, pericarditis, Brugada syndrome
- ST depression = ischemia, posterior MI, digitalis effect
T Wave
- Represents ventricular repolarization
- Ventricular repolarization begins ~0.20 seconds after QRS onset and extends for about 0.15 second
- Normally concordant with the QRS (same direction as main QRS deflection)
- Broader and lower amplitude than QRS because repolarization is more prolonged
- Inverted T waves suggest ischemia, ventricular hypertrophy, or bundle branch block
QT Interval
- Measured from QRS onset to end of T wave
- Represents the total ventricular depolarization + repolarization time
- Must be corrected for heart rate using Bazett's formula:
QTc = QT / √RR (RR interval in seconds)
- Normal QTc: < 440 msec in men, < 460 msec in women
- Prolonged QTc increases risk of torsades de pointes (a life-threatening ventricular arrhythmia)
- Shortened by hypercalcemia, digitalis; prolonged by hypokalemia, hypomagnesemia, many drugs
U Wave
- A small, positive deflection after the T wave
- Likely represents late repolarization of Purkinje fibers or mid-myocardial (M) cells
- More prominent at slow heart rates and in hypokalemia
- Prominent U waves are a classic sign of hypokalemia
J Point and J Wave
-
J point = junction between end of QRS and beginning of ST segment
-
J wave (Osborn wave) = positive deflection at the J point; classically seen in hypothermia; also in hypercalcemia and brain injury; may indicate risk of idiopathic ventricular fibrillation
-
Goldman-Cecil Medicine, pp. 421-423; Guyton and Hall, pp. 142-144
3. ECG Paper and Calibration
The ECG is recorded on a standardized grid:
| Axis | Unit | Value |
|---|---|---|
| Horizontal (time) | Small box (1 mm) | 0.04 seconds (40 msec) |
| Horizontal (time) | Large box (5 mm) | 0.20 seconds (200 msec) |
| Vertical (voltage) | Small box (1 mm) | 0.1 mV |
| Vertical (voltage) | Large box (5 mm) | 0.5 mV |
| Standard speed | - | 25 mm/sec |
| Standard gain | - | 10 mm = 1 mV |
4. The 12 ECG Leads
A standard ECG records from 12 leads - 12 different "views" of the heart's electrical activity from different angles.
Limb Leads (Bipolar) - Leads I, II, III
These record potential differences between limb electrodes:
- Lead I: Left arm (+) vs Right arm (-) - views left lateral wall
- Lead II: Left leg (+) vs Right arm (-) - views inferior wall
- Lead III: Left leg (+) vs Left arm (-) - views inferior wall
These three leads form Einthoven's triangle around the heart. By Einthoven's law: Lead I + Lead III = Lead II.
Augmented Limb Leads (Unipolar) - aVR, aVL, aVF
- aVR (augmented Vector Right): looks at the heart from the right shoulder
- aVL (augmented Vector Left): looks from the left shoulder
- aVF (augmented Vector Foot): looks from below (inferior view)
Under normal activation, P waves and QRS complexes are upright in I, II, III, and aVF, and inverted in aVR.
Precordial (Chest) Leads - V1 through V6
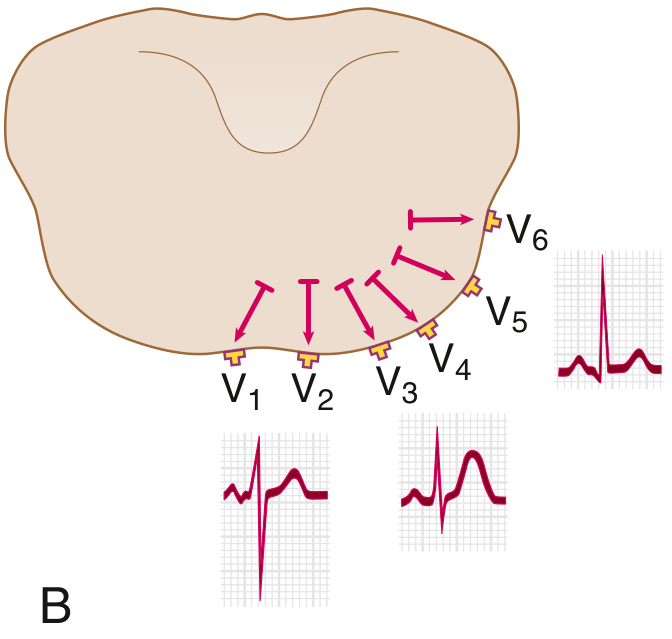
Precordial lead positioning and R wave progression - Goldman-Cecil Medicine
Placed on the chest wall, these record local electrical events:
| Lead | Position | Normal QRS |
|---|---|---|
| V1 | 4th intercostal space, right sternal border | Small r, deep S (rS pattern) |
| V2 | 4th intercostal space, left sternal border | Small r, deep S |
| V3 | Between V2 and V4 | Transitional |
| V4 | 5th intercostal space, midclavicular line | Transitional (R wave = S wave) |
| V5 | Anterior axillary line | Tall R, small S |
| V6 | Midaxillary line | Tall R, no S (qR pattern) |
R wave progression: The R wave progressively grows from V1 to V5 and the S wave diminishes, reflecting the shift from right-to-left dominance across the precordium. The transition (where R = S) normally occurs at V3 or V4. Loss of normal R wave progression suggests anterior MI or right ventricular hypertrophy.
5. Calculating Heart Rate
From the ECG:
- Regular rhythm: Rate = 300 ÷ (number of large boxes between R waves)
- Or: Rate = 1500 ÷ (number of small boxes between R waves)
- Irregular rhythm: Count QRS complexes in a 10-second strip × 6
6. Cardiac Axis
The QRS axis describes the overall direction of ventricular depolarization in the frontal plane:
| Axis | Degrees |
|---|---|
| Normal | -30° to +90° |
| Left axis deviation (LAD) | -30° to -90° |
| Right axis deviation (RAD) | +90° to +180° |
| Extreme (northwest) axis | -90° to ±180° |
Causes of LAD: Left anterior fascicular block, left ventricular hypertrophy, inferior MI
Causes of RAD: Right ventricular hypertrophy, left posterior fascicular block, pulmonary embolism, normal in children/young adults
7. Common Abnormal Patterns
Bundle Branch Blocks
When either bundle branch fails to conduct:
- LBBB (Left Bundle Branch Block): QRS ≥ 120 msec; broad notched R in V5/V6 (M-shaped), deep S in V1; no septal q waves in lateral leads; discordant ST-T changes. Isolated LBBB doubles cardiovascular risk.
- RBBB (Right Bundle Branch Block): QRS ≥ 120 msec; RSR' ("rabbit ears") in V1, broad S wave in I, V5, V6.
AV Blocks
- 1st degree: PR > 200 msec; every P wave conducts
- 2nd degree - Mobitz I (Wenckebach): Progressive PR lengthening until a P wave is blocked (non-conducted)
- 2nd degree - Mobitz II: Constant PR, then sudden non-conducted P wave; higher risk of complete block
- 3rd degree (complete): No relationship between P waves and QRS; complete AV dissociation
ST Changes
- ST elevation: STEMI (localized to territory), pericarditis (diffuse, saddle-shaped), Brugada (V1-V2 coved pattern)
- ST depression: NSTEMI/unstable angina, subendocardial ischemia, posterior STEMI (reciprocal)
Hypertrophy
- LVH: Increased QRS voltages (e.g., S in V1 + R in V5 or V6 ≥ 35 mm = Sokolov-Lyon criterion); lateral ST-T changes
- RVH: Dominant R in V1, right axis deviation, deep S in lateral leads
8. Clinical Uses of the ECG
The ECG is used to diagnose and monitor:
- Arrhythmias (AF, flutter, SVT, VT, VF, bradycardias)
- Acute myocardial infarction (STEMI, NSTEMI)
- Conduction defects (bundle branch blocks, fascicular blocks, AV blocks)
- Electrolyte abnormalities (hyperkalemia peaked T waves and sine wave; hypokalemia U waves; hypercalcemia short QT)
- Drug effects (digoxin "reverse tick" ST depression; QT-prolonging drugs)
- Structural disease (hypertrophy, pre-excitation syndromes)
- Pericarditis and myocarditis
9. Limitations
- A normal ECG does not exclude cardiac disease (e.g., significant CAD between events)
- Single time-point recordings miss intermittent arrhythmias - ambulatory (Holter) monitoring records over 24-48 hours for infrequent events
- Computerized interpretation algorithms improve accuracy but require physician review
- Obesity, emphysema, and poor electrode contact reduce signal quality
Summary Table: Normal ECG Intervals
| Parameter | Normal Range |
|---|---|
| Heart rate | 60-100 bpm |
| PR interval | 120-200 msec (3-5 small boxes) |
| QRS duration | 70-110 msec (< 3 small boxes) |
| QTc | < 440 msec (men), < 460 msec (women) |
| QRS axis | -30° to +90° |
| R wave transition | V3-V4 |
Sources:
- Goldman-Cecil Medicine International Edition, Chapter 42: Electrocardiography, pp. 420-423
- Guyton and Hall Textbook of Medical Physiology, Chapter 11: Fundamentals of Electrocardiography, pp. 142-148
Create a presentation on ECG interpretation and common pathologic patterns
Reading File
Reading File
Reading File
Reading File
Running Command
Running Command
Writing File
Running Command
Running Command
Running Command
Running Command
Running Command
Editing File
Running Command
Running Command
Your presentation is ready - 1.5 MB, 13 slides:
ECG Interpretation
Presentation · PPTX
What's inside (13 slides, deep navy + crimson theme):
| # | Slide | Highlights |
|---|---|---|
| 1 | Title | Full-bleed ECG waveform backdrop, crimson/gold header band |
| 2 | Table of Contents | 8 topic cards with section numbers |
| 3 | Cardiac Conduction System | Textbook anatomy diagram + 6-step activation sequence |
| 4 | ECG Waveforms & Intervals | Labeled waveform image + 7-row wave reference (normal values + meaning) |
| 5 | The 12-Lead System | Einthoven triangle image + precordial lead image + lead group descriptions |
| 6 | Heart Rate & Axis | Rate calculation formulas, bradycardia/normal/tachy cards, axis table + real 12-lead ECG |
| 7 | Conduction Abnormalities | LBBB, RBBB, and all AV blocks with criteria |
| 8 | Ischemia & Infarction | STEMI vs NSTEMI criteria + territory localization table (leads → artery → wall) |
| 9 | Hypertrophy & Enlargement | LVH (Sokolov-Lyon, Cornell), RVH, atrial enlargement criteria |
| 10 | Electrolyte & Drug Effects | 6-panel grid: hypo/hyperkalaemia, hypo/hypercalcaemia, digoxin, QT-prolonging drugs |
| 11 | Quick Reference Table | 10-row normal values table with "abnormal if" and clinical significance columns |
| 12 | Systematic 10-Step Approach | Step-by-step reading method in numbered card layout |
| 13 | Key Takeaways | 6 high-yield points for rapid review |
This is a shared conversation. Sign in to Orris to start your own chat.