
Explain in detail about congestive heart faliure
congestive heart failure pathophysiology diagram
heart failure chest X-ray pulmonary edema
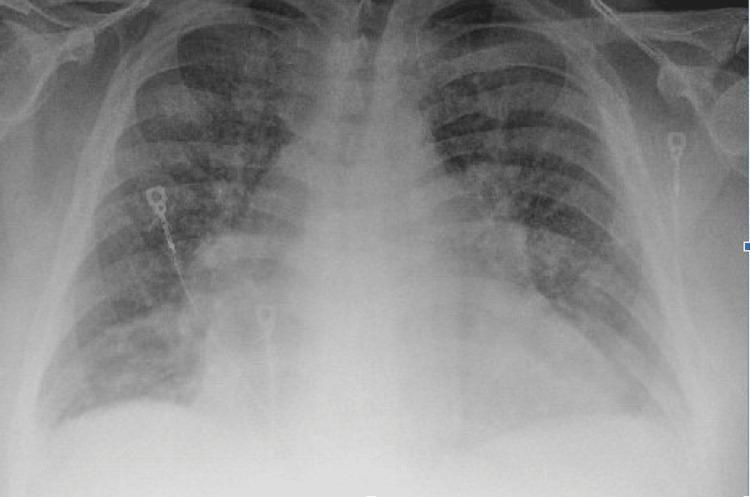
This anterior-posterior (AP) chest X-ray illustrates classic radiological findings of acute congestive heart failure. The primary finding is significant cardiomegaly, with the cardiac silhouette appearing enlarged and globular, occupying more than 50% of the thoracic diameter. Diffuse, bilateral hazy opacities are present throughout both lung fields, consistent with pulmonary edema. These opacifications are most prominent in the perihilar regions and lung bases, obscuring normal pulmonary vasculature and the sharp definition of the diaphragmatic borders. The costophrenic angles appear blunted, suggesting associated pleural effusions. Visible medical hardware includes ECG leads positioned on the chest wall. The image serves as an educational example of how chronic heart failure with reduced ejection fraction manifests as pulmonary venous congestion and interstitial-to-alveolar edema on diagnostic imaging.
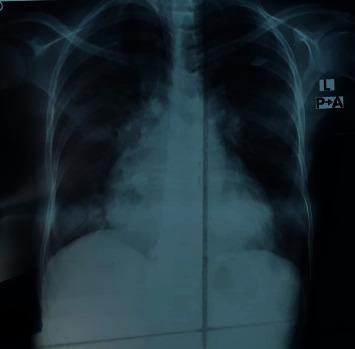
Posteroanterior (PA) view chest X-ray demonstrating clinical features of congestive heart failure and pulmonary edema. The image shows significant cardiomegaly with an enlarged cardiac silhouette. There is evidence of pulmonary venous hypertension, specifically characterized by upper lobe diversion where the vascular markings in the upper lobes are more prominent than those in the lower zones. The hilar regions appear congested with increased density and blurring of the hilar shadows. In the lower lung fields, patchy opacities and areas of increased density are visible, consistent with pulmonary consolidation or alveolar edema. The diaphragmatic angles appear somewhat obscured by the parenchymal density changes. This radiographic presentation is typical for decompensated heart failure, illustrating the redistribution of blood flow and fluid accumulation within the pulmonary parenchyma.
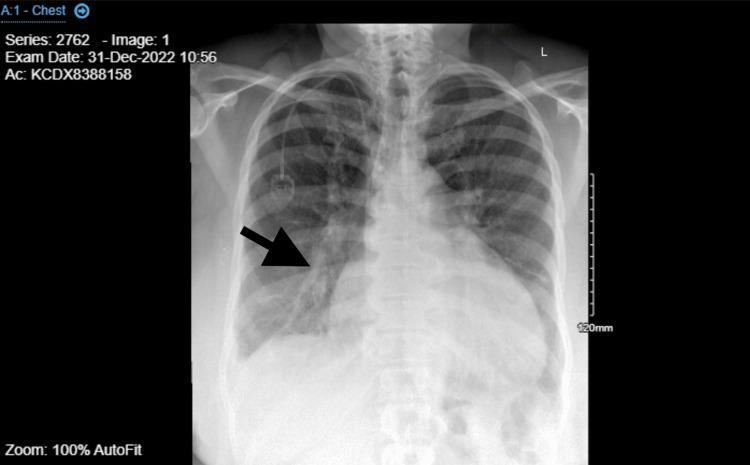
This diagnostic image is a posterior-anterior (PA) view chest X-ray demonstrating classic signs of congestive heart failure and acute pulmonary edema. Centrally, there is significant cardiomegaly with an increased cardiothoracic ratio, suggesting left ventricular enlargement. The pulmonary parenchyma shows widespread, bilateral increased opacification and haziness, particularly in the perihilar regions and lower lung zones, consistent with interstitial and alveolar edema. A black arrow in the right medial lung field specifically highlights enlarged, prominent pulmonary arteries and congested vascular markings (cephalization). The costophrenic angles appear partially obscured, which may indicate small pleural effusions. An implanted medical device, consistent with a chemotherapy port (Port-a-Cath), is visible in the right upper thoracic region with its catheter tip terminating in the superior vena cava. This visual evidence supports a clinical diagnosis of decompensated heart failure and pulmonary vascular congestion.
left ventricular hypertrophy cardiac remodeling heart failure
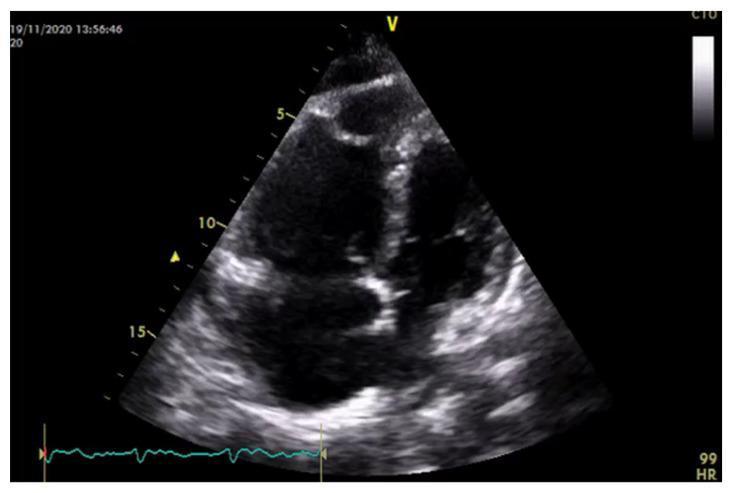
This diagnostic image is a standard transthoracic apical four-chamber view echocardiogram demonstrating advanced morphological changes secondary to pulmonary hypertension (PH). The visual focus is on the right heart structures, which exhibit significant remodeling due to chronic pressure and volume overload. Key findings include marked right ventricular (RV) hypertrophy, evidenced by thickened myocardial walls, and severe RV dilatation. The RV has lost its typical crescentic shape, appearing more spherical and globular. Furthermore, there is massive dilatation of the right atrium (RA), which appears disproportionately large compared to the left-sided chambers. These features—RV hypertrophy, spherical remodeling, and RA enlargement—are hallmark indicators of right heart failure and increased right ventricular wall stress. The image serves as an educational example of cardiac adaptation to increased pulmonary vascular resistance and chronic right heart afterload.
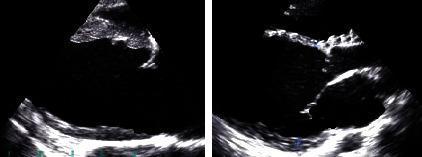
This clinical imaging figure consists of two side-by-side grayscale echocardiogram still frames focusing on the left heart chambers of a 63-year-old female patient. The diagnostic images illustrate key features of cardiovascular pathology associated with heart failure and atrial fibrillation. Centrally, the left ventricle is visible, showing moderately thickened myocardial walls consistent with left ventricular hypertrophy. The endocardial borders and chamber dimensions are delineated, reflecting decreased left ventricular diastolic function. While valve structures are partially visible, they are not the primary focus of these specific frames. The imaging serves as a clinical demonstration of the structural remodeling and hemodynamic changes seen in chronic cardiac conditions, including atrial fibrillation and congestive heart failure. These visual findings are relevant for medical students and clinicians studying cardiac ultrasound indicators like ejection fraction (LVEF) and ventricular geometry in the context of cardiovascular disease management.
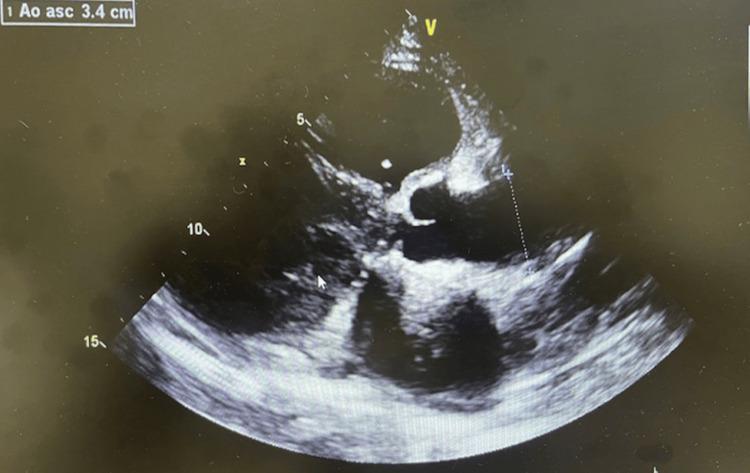
This diagnostic image is a transthoracic echocardiogram in a parasternal long-axis view, demonstrating significant structural cardiac abnormalities. The visual highlights include marked ventricular dilation and thickening of the ventricular walls, consistent with ventricular hypertrophy. An annotation in the upper left corner, 'Ao asc 3.4 cm', indicates a measurement of the ascending aorta's diameter. The cardiac chambers appear enlarged, and the myocardium exhibits increased echogenicity. This imaging provides evidence of chronic heart remodeling, often associated with systemic conditions such as systemic lupus erythematosus (SLE) or hypertensive heart disease, resulting in congestive heart failure. The image serves as a clinical example of structural heart changes secondary to long-term inflammatory or hypertensive disease, facilitating the study of cardiomyopathy and aortic root evaluation via ultrasound.
Congestive Heart Failure (CHF) - A Comprehensive Overview
1. Definition and Types
- Heart Failure with Reduced Ejection Fraction (HFrEF) - systolic dysfunction; EF < 40-45%. Cardiac output is significantly reduced. This is the classic form, seen after myocardial infarction.
- Heart Failure with Preserved Ejection Fraction (HFpEF) - diastolic dysfunction; EF may be normal (>60%), but stiff, hypertrophied myocardium impairs filling. Cardiac output is reduced despite a normal EF. Drug treatment differs from HFrEF.
- High-Output Failure - a rare form where even increased cardiac output is insufficient for the body's demands (hyperthyroidism, beriberi, severe anemia, arteriovenous shunts).
-
Left-sided CHF - pulmonary congestion predominates
-
Right-sided CHF - systemic venous congestion predominates
-
Biventricular (global) CHF - both sides fail
-
Katzung's Basic and Clinical Pharmacology, 16th Ed.
2. Etiology (Causes)
| Category | Examples |
|---|---|
| Ischemic Heart Disease | Myocardial infarction, chronic ischemia (most common cause) |
| Hypertension | Chronic pressure overload |
| Valvular Disease | Aortic stenosis/regurgitation, mitral regurgitation |
| Cardiomyopathy | Dilated, hypertrophic, restrictive |
| Arrhythmias | Atrial fibrillation (can cause cardiomyopathy when rate is uncontrolled) |
| Cor Pulmonale | Pulmonary hypertension, COPD |
| Metabolic/Toxic | Thyroid disease, alcohol, chemotherapy (anthracyclines) |
| Congenital HD | Various structural defects |
- Robbins, Cotran & Kumar Pathologic Basis of Disease
3. Pathophysiology
3a. Cardiac Hypertrophy - The Initial Response
- Pressure-overload hypertrophy (e.g., hypertension, aortic stenosis): New sarcomeres are assembled in parallel, expanding cross-sectional area → concentric hypertrophy with thick walls and a small cavity.
- Volume-overload hypertrophy (e.g., mitral/aortic regurgitation): New sarcomeres are assembled in series → eccentric hypertrophy with dilation. The wall may look normal in thickness despite increased heart weight.
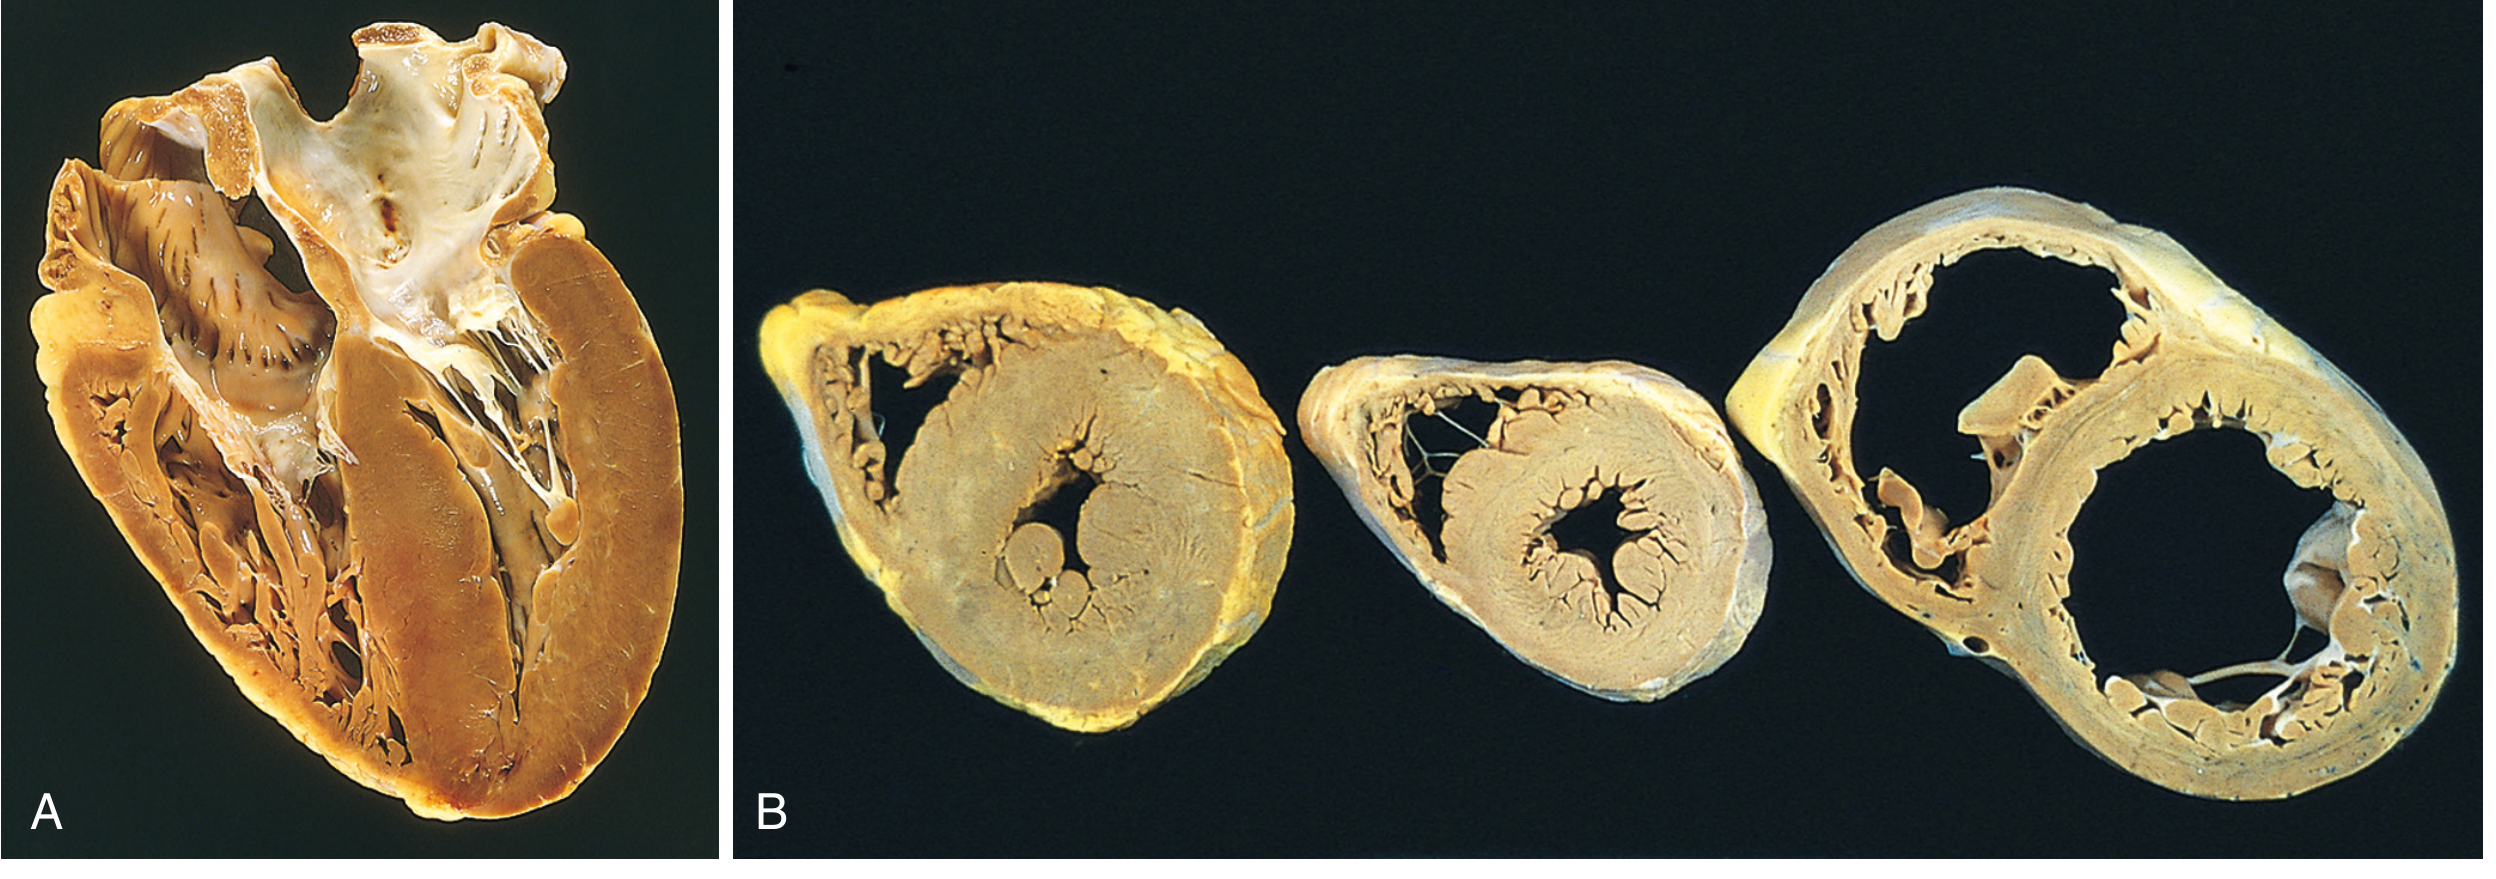
- Robbins, Cotran & Kumar Pathologic Basis of Disease, p. 499-500
3b. Neurohumoral Compensation - The Vicious Cycle
- Baroreceptor reflex is reset at lower sensitivity in CHF
- Increased sympathetic outflow → tachycardia, increased contractility, vasoconstriction
- Vasoconstriction (also driven by angiotensin II and endothelin) increases afterload, which further reduces ejection fraction - a vicious cycle
- Reduced renal perfusion activates renin release
- Angiotensin II causes vasoconstriction, promotes norepinephrine release, and stimulates aldosterone
- Aldosterone → sodium and water retention → increased preload and volume overload
- Angiotensin II also drives cardiac fibrosis and remodeling
- Released from the posterior pituitary → free water retention, worsening volume overload
-
Released from ventricular myocytes under wall stress
-
Counteract the RAAS by promoting natriuresis and vasodilation
-
Clinically used as biomarkers: elevated BNP/NT-proBNP is diagnostic of CHF
-
Katzung's Basic and Clinical Pharmacology, 16th Ed., p. 334-335
3c. Cellular and Molecular Changes
-
Beta-receptor downregulation: Prolonged sympathetic stimulation causes downregulation of cardiac β1 receptors, reducing the heart's ability to respond to catecholamines
-
Calcium handling abnormalities: SERCA (SR Ca²⁺-ATPase) function is impaired, reducing Ca²⁺ reuptake; RyR channels leak Ca²⁺ from the SR → impaired contraction and relaxation, and arrhythmias
-
Apoptosis: Elevated caspase activity from excessive β-adrenergic stimulation accelerates myocyte death
-
Cardiac Remodeling: Structural changes including dilation, fibrosis, and altered ventricular geometry. Myocytes develop characteristics of fetal myocytes. Connective tissue proliferation stiffens the heart.
-
Mitochondrial dysfunction: Energy production is impaired in the overworked heart
-
Potassium channel alterations: Predispose to life-threatening arrhythmias (a major cause of death in CHF)
-
Katzung's Basic and Clinical Pharmacology, 16th Ed., p. 334-335
4. Classification
ACC/AHA Staging (Braunwald's Heart Disease)
| Stage | Description | Corresponds to NYHA |
|---|---|---|
| A | At high risk for HF but without structural disease or symptoms | None |
| B | Structural heart disease but without signs/symptoms | Class I |
| C | Structural heart disease with prior or current symptoms | Class I, II, or III |
| D | Refractory HF requiring specialized interventions | Class IV |
NYHA Functional Classification
| Class | Description |
|---|---|
| I | No limitation. Ordinary activity does not cause symptoms |
| II | Slight limitation. Comfortable at rest; ordinary activity causes symptoms |
| III | Marked limitation. Comfortable at rest; less-than-ordinary activity causes symptoms |
| IV | Symptoms at rest; unable to carry on any activity without symptoms |
- Braunwald's Heart Disease, A Textbook of Cardiovascular Medicine
5. Clinical Features
Left-Sided Heart Failure (Pulmonary Congestion)
- Dyspnea on exertion - the cardinal symptom; reflects rising pulmonary venous pressure
- Orthopnea - dyspnea when lying flat; relieved by sitting up (increased venous return overwhelms failing LV)
- Paroxysmal Nocturnal Dyspnea (PND) - sudden awakening with breathlessness
- Cardiac Asthma - bronchospasm from pulmonary edema
- Cough - especially nocturnal; may produce frothy/pink sputum in acute pulmonary edema
- Fatigue - reduced cardiac output with poor peripheral perfusion
- Tachycardia
- S3 gallop (ventricular filling sound) - indicates volume overload
- Fine bibasal crackles on auscultation
- Displaced apex beat (cardiomegaly)
-
Heart: LV hypertrophy and dilation; secondary LA dilation → atrial fibrillation risk; thrombus formation in atrial appendage
-
Lungs: "Heavy, wet lungs" - perivascular and interstitial edema; alveolar edema; heart failure cells (hemosiderin-laden macrophages in alveoli from extravasated red cells) are a hallmark; pleural effusions (serous transudates)
-
Robbins, Cotran & Kumar Pathologic Basis of Disease, p. 500
Right-Sided Heart Failure (Systemic Venous Congestion)
- Peripheral edema - pitting edema of feet, ankles, legs; sacral edema in bedridden patients
- Anasarca - generalized massive edema
- Jugular venous distension (JVD)
- Hepatomegaly - congestive hepatomegaly (tender, pulsatile liver)
- Ascites - peritoneal fluid accumulation
- Splenomegaly - with platelet sequestration
- Nausea/anorexia - bowel wall edema impairs absorption
- Azotemia - renal congestion
-
Liver: "Nutmeg liver" - congested red-brown pericentral zones around central veins with normal tan periportal regions; in severe/longstanding cases, cardiac cirrhosis can develop
-
Pleural/Pericardial/Peritoneal spaces: Transudative effusions; ascites
-
Subcutaneous tissues: Dependent pitting edema; anasarca
-
Kidneys: Greater fluid retention and azotemia than in left-sided failure
-
Robbins, Cotran & Kumar Pathologic Basis of Disease, p. 501
6. Investigations
Imaging
- Cardiomegaly (cardiothoracic ratio > 0.5)
- Upper lobe blood diversion (cephalization of pulmonary vasculature)
- Kerley B lines (interstitial edema in interlobular septa)
- Perihilar "bat-wing" haziness (alveolar edema)
- Bilateral pleural effusions (blunting of costophrenic angles)
- Measures ejection fraction (differentiates HFrEF from HFpEF)
- Assesses wall motion, valve function, chamber dimensions
- Detects mural thrombosis
Biomarkers
- BNP / NT-proBNP - released from ventricular myocytes under wall stress; elevated levels confirm CHF diagnosis and track severity. A low value has high negative predictive value for ruling out CHF.
- Troponin - elevated in acute decompensation
- Renal function / Electrolytes - assess for cardiorenal syndrome
- Thyroid function - screen for reversible cause
7. Management
Non-Pharmacological
- Salt restriction (< 2g Na/day)
- Fluid restriction in severe CHF
- Regular aerobic exercise (physiologic hypertrophy with beneficial capillary density increase - unlike pathologic hypertrophy)
- Weight monitoring (daily; > 2kg gain in 2 days = seek medical attention)
- Smoking cessation, alcohol avoidance
Pharmacological - HFrEF (Systolic CHF)
- ACE inhibitors (e.g., enalapril, ramipril, lisinopril) - first-line in all patients with LV systolic dysfunction regardless of symptoms. Reduce LV size, improve EF, reduce hospitalizations, and prolong survival. Side effects: dry cough (~5%), angioedema, hyperkalemia, renal dysfunction.
- ARBs (e.g., valsartan, losartan) - substitute when ACE inhibitor cough or angioedema occurs; similar efficacy.
- ARNI - Sacubitril/Valsartan (Entresto) - preferred over ACE inhibitor or ARB when tolerated. Sacubitril inhibits neprilysin (which breaks down natriuretic peptides), augmenting beneficial natriuresis and vasodilation. CANNOT be combined with an ACE inhibitor (risk of angioedema from dual bradykinin accumulation).
- Counteract the harmful long-term effects of chronic sympathetic activation
- Reduce heart rate, prevent arrhythmias, reverse remodeling
- Must be started low and uptitrated slowly; NEVER start in acute decompensation
- Cornerstone therapy alongside ARNI/ACE inhibitor
- Spironolactone / Eplerenone - block aldosterone; reduce fibrosis and remodeling; diuretic effect
- Significant mortality benefit in Class II-IV HF
- Monitor for hyperkalemia and renal function
- Originally developed for diabetes; now first-line in CHF regardless of diabetes status
- Reduce hospitalizations and mortality via multiple mechanisms (glycosuria, natriuresis, hemodynamic effects, anti-inflammatory)
- Loop diuretics (furosemide, torsemide) - first-line for volume overload; reduce preload
- Thiazides - can be combined for diuretic resistance
- Goldman-Cecil Medicine; Katzung's Basic and Clinical Pharmacology, 16th Ed.
Device Therapy
- Cardiac Resynchronization Therapy (CRT/Biventricular pacing) - for patients with LBBB and EF <35%; synchronizes RV and LV contraction; improves LVEF and reduces mortality
- Implantable Cardioverter-Defibrillator (ICD) - for primary prevention of sudden cardiac death when EF remains <35% despite optimal medical therapy
- Ventricular Assist Device (VAD) - mechanical support as bridge to transplant or destination therapy in end-stage HF
- Heart Transplantation - gold standard for Stage D (refractory) CHF
8. Complications
| Complication | Mechanism |
|---|---|
| Atrial Fibrillation | LA dilation from elevated filling pressures; prevalence 10% (Class I) to 50% (Class IV) |
| Sudden Cardiac Death | Ventricular arrhythmias from ion channel changes, ischemia, electrolyte disturbances |
| Cardiorenal Syndrome | Reduced renal perfusion + venous congestion → worsening renal function |
| Thromboembolic events | Stasis of blood in dilated chambers; risk of LV mural thrombus, stroke |
| Cardiac Cirrhosis | Longstanding severe right-sided CHF → centrizonal hepatic fibrosis |
| Pulmonary Hypertension | Chronic elevated pulmonary venous pressure → pulmonary arterial remodeling |
| Malnutrition / Cachexia | Bowel edema, poor absorption, increased catabolism |
- Braunwald's Heart Disease; Robbins, Cotran & Kumar Pathologic Basis of Disease
9. Prognosis
- ~50% of patients with Class IV symptoms die within 1 year
- Major causes of death: sudden arrhythmic death and progressive pump failure
- Prognostic markers: LVEF, NYHA class, BNP levels, renal function, serum sodium
- Modern quadruple therapy (ARNI + beta-blocker + MRA + SGLT2i) has dramatically improved prognosis compared to older regimens
Summary at a Glance
Reduced Cardiac Output
        ↓
↑ Sympathetic / RAAS activation
        ↓
Tachycardia, vasoconstriction, Na+H₂O retention
        ↓
↑ Afterload + ↑ Preload
        ↓
Further pump failure → Remodeling → Apoptosis
        ↓
Pulmonary congestion (Left CHF) + Systemic congestion (Right CHF)
It's ecg changes
ECG changes heart failure left bundle branch block
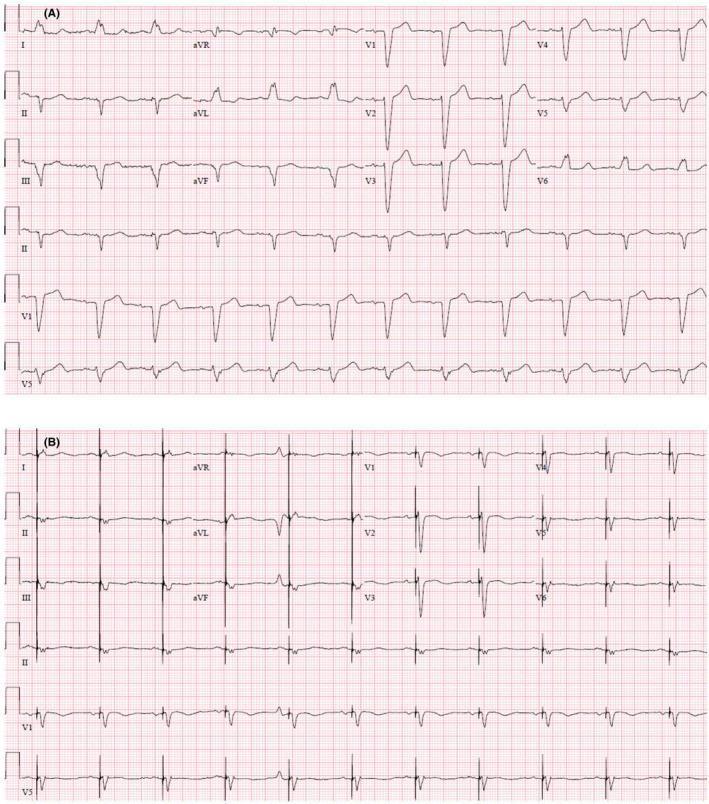
This diagnostic image displays a comparison between two 12-lead electrocardiograms (ECG) labeled A and B. Panel A (Baseline ECG) shows normal sinus rhythm with characteristic features of left bundle branch block (LBBB), including a prolonged QRS duration of 150 ms, wide slurred R waves in leads I and aVL, and deep S waves in leads V1-V3. Panel B (Post-CRT-P ECG) demonstrates the electrical changes following the implantation of a cardiac resynchronization therapy pacemaker. Key features in Panel B include visible pacing artifacts (vertical spikes) preceding the QRS complexes, indicating ventricular pacing. The QRS complex in the post-procedure ECG is slightly narrower (140 ms) compared to baseline, though still wider than normal, and exhibits T-wave inversions discordant with the paced QRS complexes. This comparison highlights the impact of biventricular pacing on ventricular depolarization and repolarization patterns in a patient with heart failure and LBBB.
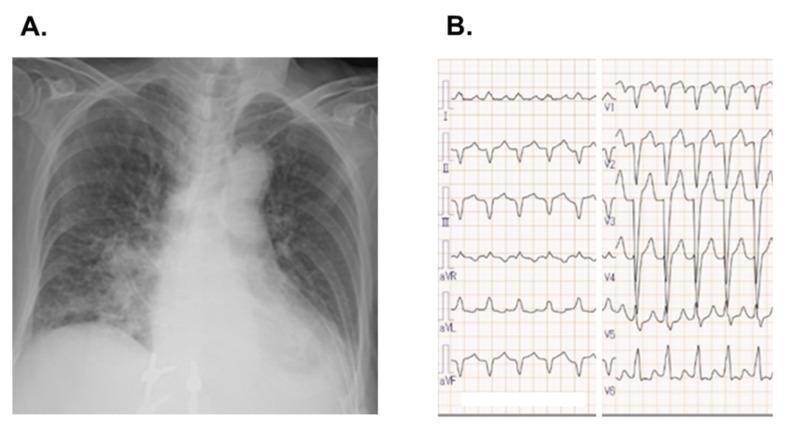
This composite diagnostic image features a posterobanterio (PA) chest X-ray and a 12-lead electrocardiogram (ECG) demonstrating cardiovascular complications. Image (A) is a chest radiograph showing significant cardiomegaly with a prominent cardiac silhouette and a cardiothoracic ratio greater than 0.5. There is evidence of bilateral pulmonary congestion, characterized by increased interstitial markings and hazy opacities, particularly in the perihilar regions and lower lung fields, consistent with acute heart failure. Image (B) displays a 12-lead ECG demonstrating a wide QRS complex (exceeding 120 ms) with a morphology characteristic of a complete left bundle branch block (LBBB), including deep S-waves in lead V1 and broad, notched R-waves in the lateral leads. Notably, there is poor R-wave progression across the precordial leads (V1–V4), which can be seen in anteroseptal myocardial injury or dilated cardiomyopathy. The combination of images illustrates clinical findings of drug-induced (osimertinib) cardiotoxicity, highlighting the relationship between structural cardiac changes (dilation/failure) and corresponding electrical conduction abnormalities.
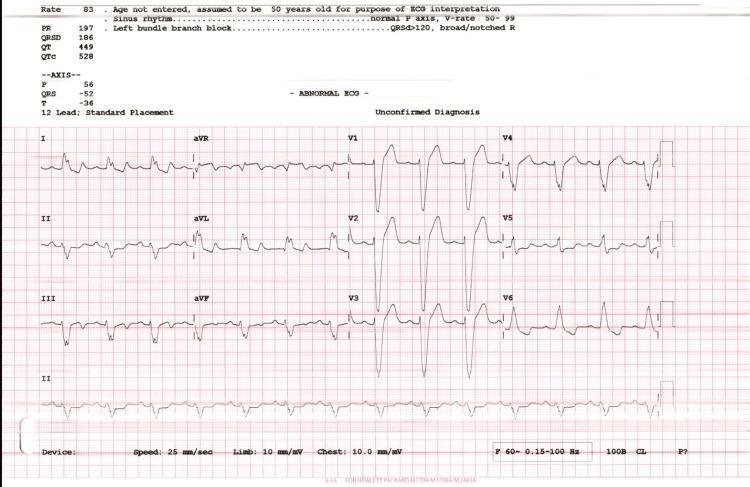
This diagnostic image is a 12-lead electrocardiogram (ECG) performed at standard placement, demonstrating normal sinus rhythm with findings classic for a complete left bundle branch block (LBBB). The tracing shows a wide QRS complex (QRSD measured at 186 ms) with a leftward axis (QRS axis of -52 degrees). Key morphological features include broad, notched 'M-shaped' R waves in the lateral leads (I, aVL, V5, and V6) and deep, wide S waves in the right precordial leads (V1-V3). There is a concurrent prolongation of the QTc interval (528 ms) and secondary ST-T wave changes, specifically T-wave inversion in the lateral leads, which are expected in the context of altered ventricular depolarization. This ECG is a critical educational example for identifying conduction delays in the setting of heart failure or cardiomyopathies, such as non-compaction cardiomyopathy, where left ventricular dysfunction is often accompanied by significant intraventricular conduction disturbances.
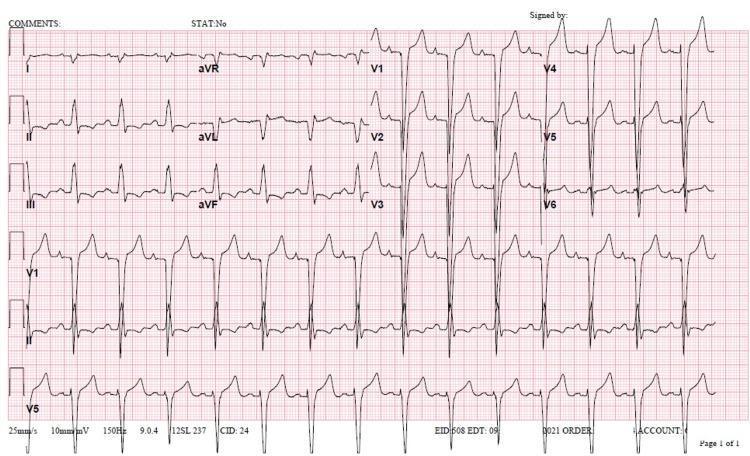
A 12-lead electrocardiogram (ECG) demonstrating a sinus rhythm with significant conduction abnormalities and morphological changes. The rhythm strip shows a heart rate of approximately 82 bpm with identifiable P waves and a PR interval of 180 ms. The QRS complex is markedly widened at 154 ms, exhibiting a morphology consistent with Left Bundle Branch Block (LBBB), characterized by deep S waves in leads V1-V3 and broad, tall R waves in the lateral leads V5 and V6. There is evidence of right axis deviation, which is an atypical finding in the setting of standard LBBB and may suggest concomitant right ventricular hypertrophy or lateral wall infarction. Secondary ST-T wave changes are visible, including T-wave inversions in leads V1 through V6. The QTc interval is prolonged at 500 ms. These findings are clinically relevant for assessing acute myocardial ischemia or cardiomyopathy-related conduction delay in the setting of heart failure.
left ventricular hypertrophy ECG voltage criteria
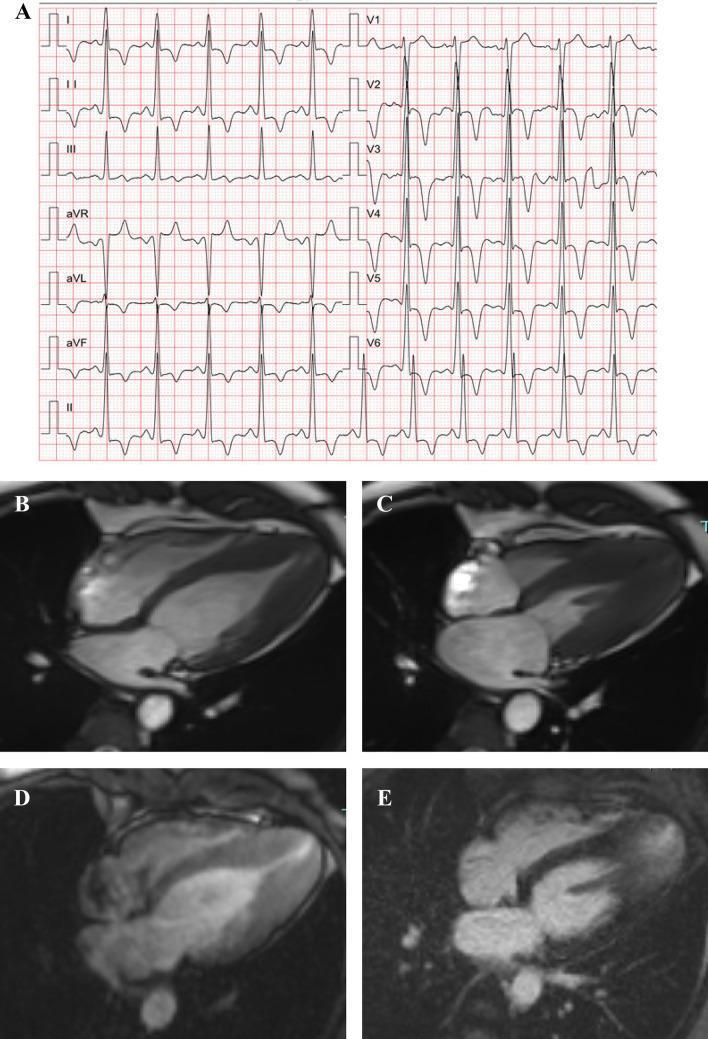
This composite educational graphic illustrates the diagnostic features of Apical Hypertrophic Cardiomyopathy (ApHCM) through electrocardiography (ECG) and Cardiac Magnetic Resonance (CMR) imaging. Panel A shows a 12-lead ECG characterized by high-voltage QRS complexes in the precordial leads, meeting voltage criteria for left ventricular hypertrophy, and striking, giant negative T-wave inversions (deeply symmetric), particularly in leads V2 through V6. Panels B through E present CMR four-chamber views demonstrating the structural manifestations of the disease. Diastolic imaging (B) shows relative thickening of the left ventricular apex (13.5 mm). Systolic imaging (C) depicts apical cavity obliteration, where the hypertrophied myocardium eliminates the distal ventricular space. Panel D identifies a small apical aneurysm, a known complication of localized hypertrophy. Panel E displays Late Gadolinium Enhancement (LGE) at the apex, indicating localized myocardial fibrosis or scarring. Collectively, these images provide a comprehensive clinical overview of ApHCM's electrical and structural pathology.
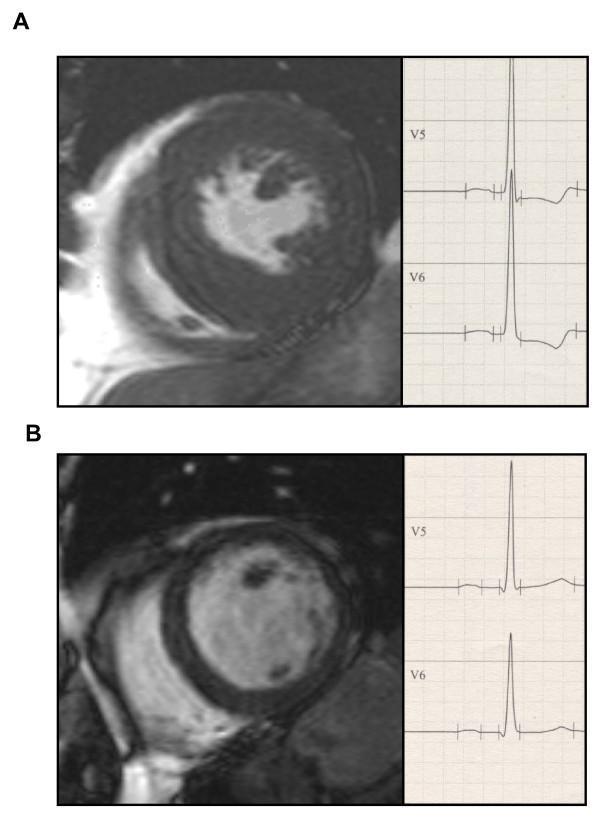
This comparative medical illustration presents short-axis Cardiac Magnetic Resonance (CMR) images and corresponding Electrocardiogram (ECG) tracings for two types of Left Ventricular Hypertrophy (LVH). Panel A demonstrates concentric LVH, characterized by a significantly thickened myocardial wall and a reduced left ventricular (LV) end-diastolic cavity diameter (42 mm). The adjacent ECG shows high-voltage R waves in leads V5 and V6 with accompanying ST-segment depression and T-wave inversion, consistent with a left ventricular strain pattern. Panel B illustrates eccentric LVH, featuring a dilated LV cavity (end-diastolic diameter 60 mm) and relatively thinner myocardial walls compared to the concentric model. The corresponding ECG in panel B shows high-voltage R waves but with upright T waves and less pronounced ST-segment changes. The visual comparison highlights the structural differences between pressure-overload (concentric) and volume-overload (eccentric) remodeling and their respective electrophysiological manifestations, facilitating the study of cardiac morphology and ECG-LVH correlation criteria.
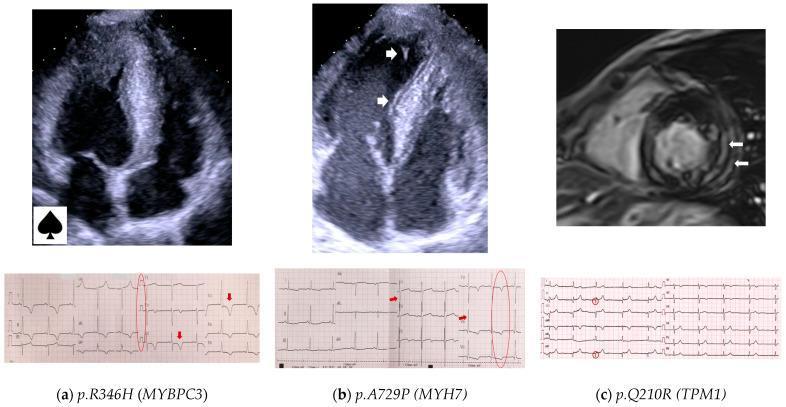
This composite figure presents clinical imaging and electrocardiogram (ECG) data for Hypertrophic Cardiomyopathy (HCM) associated with specific genetic variants.
ECG Changes in Congestive Heart Failure
1. Sinus Tachycardia
- One of the earliest and most consistent ECG findings in CHF
- Results from compensatory sympathetic activation (increased catecholamines) and withdrawal of parasympathetic tone
- Heart rate typically 100-120 bpm
- A resting tachycardia in a CHF patient is a poor prognostic sign
2. Left Ventricular Hypertrophy (LVH)
| Criterion | Measurement | Threshold |
|---|---|---|
| Sokolow-Lyon | SV1 + RV5 (or RV6) | ≥ 35 mm |
| Cornell voltage | SV2 + RaVL | ≥ 28 mm (men), ≥ 20 mm (women) |
| Limb lead | R aVL alone | > 28 mm (men), > 20 mm (women) |
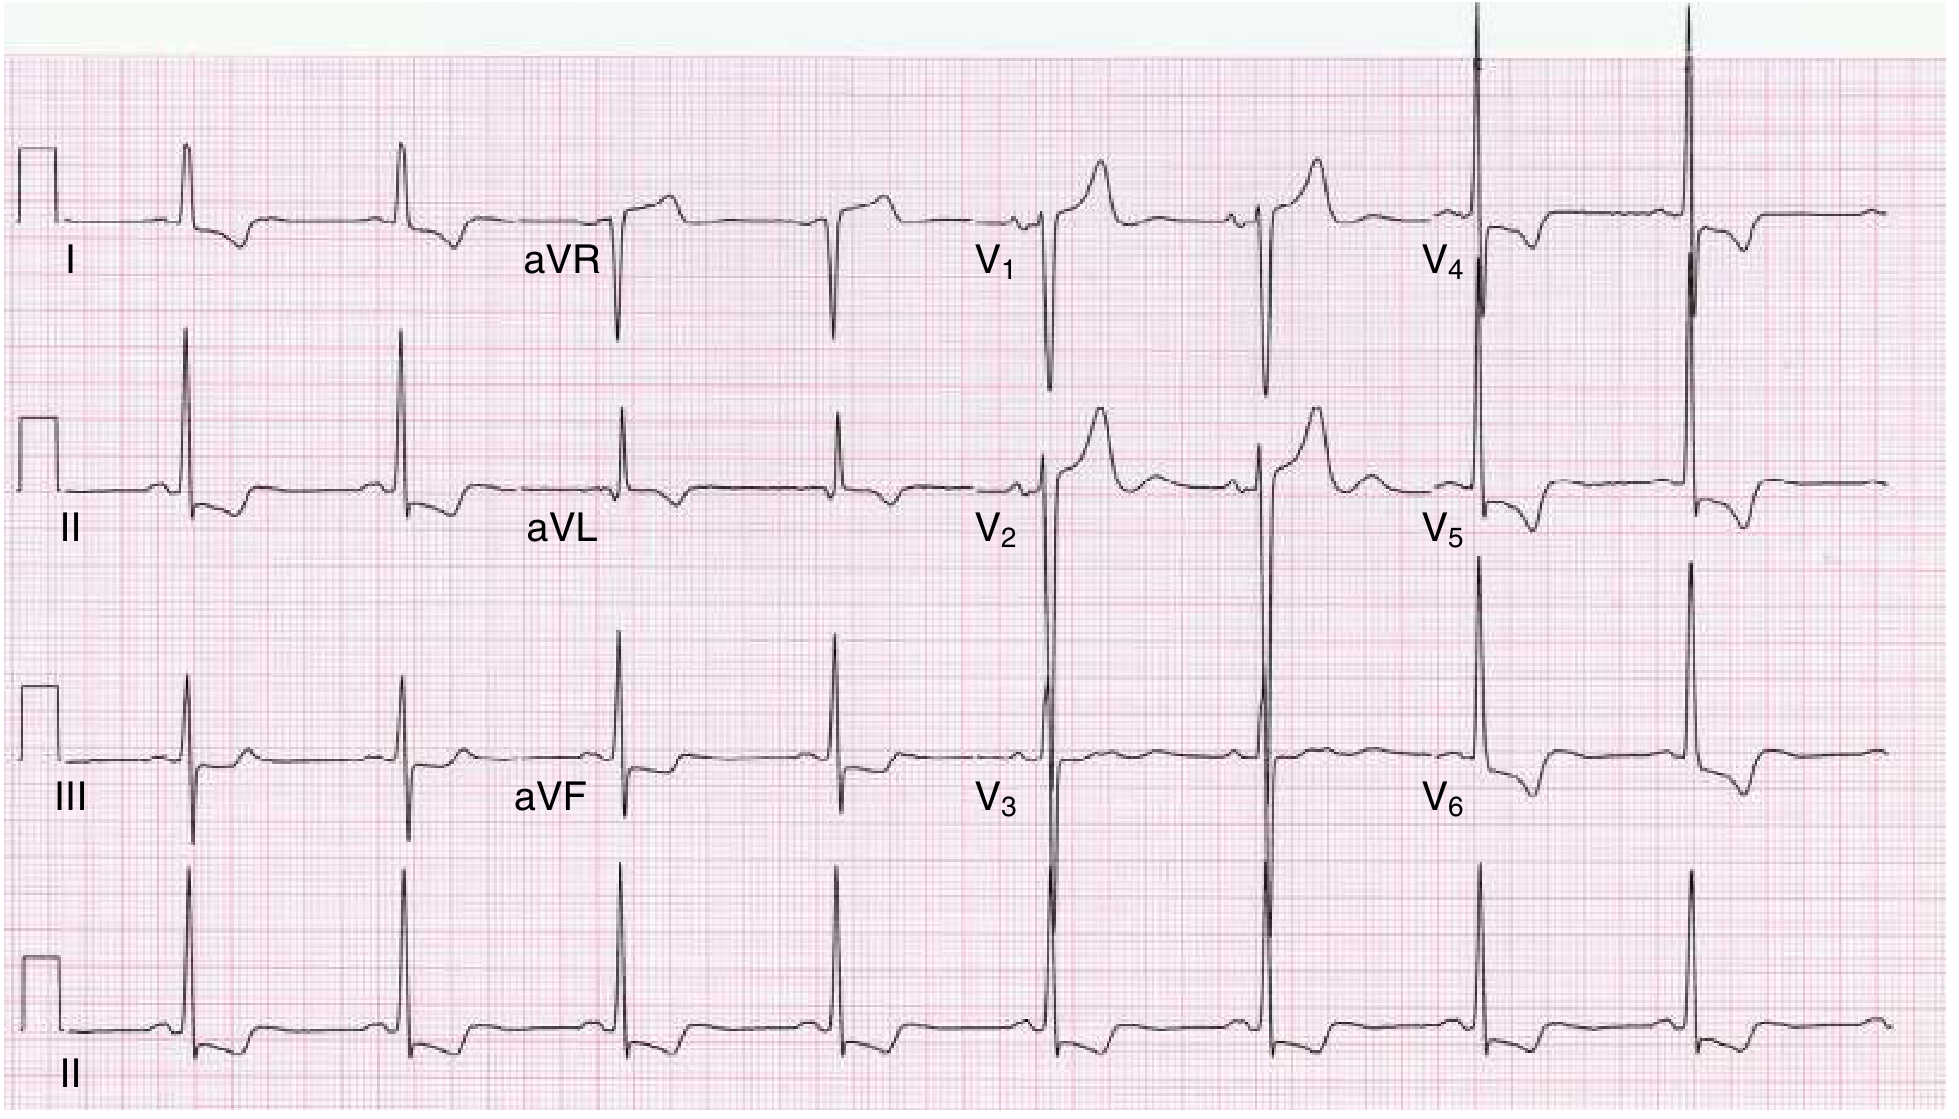
- "Strain" pattern - ST segment depression with asymmetric T-wave inversion in lateral leads (I, aVL, V5, V6) - these are secondary repolarization abnormalities from the hypertrophied muscle
- Left axis deviation (LAD)
- Left atrial enlargement (LAE) - broad, notched P wave in II ["P mitrale"], biphasic P in V1 with wide terminal negative deflection
- LVH often progresses to incomplete or complete LBBB
- Harrison's Principles of Internal Medicine, 22nd Ed.; Goldman-Cecil Medicine
3. Left Bundle Branch Block (LBBB)
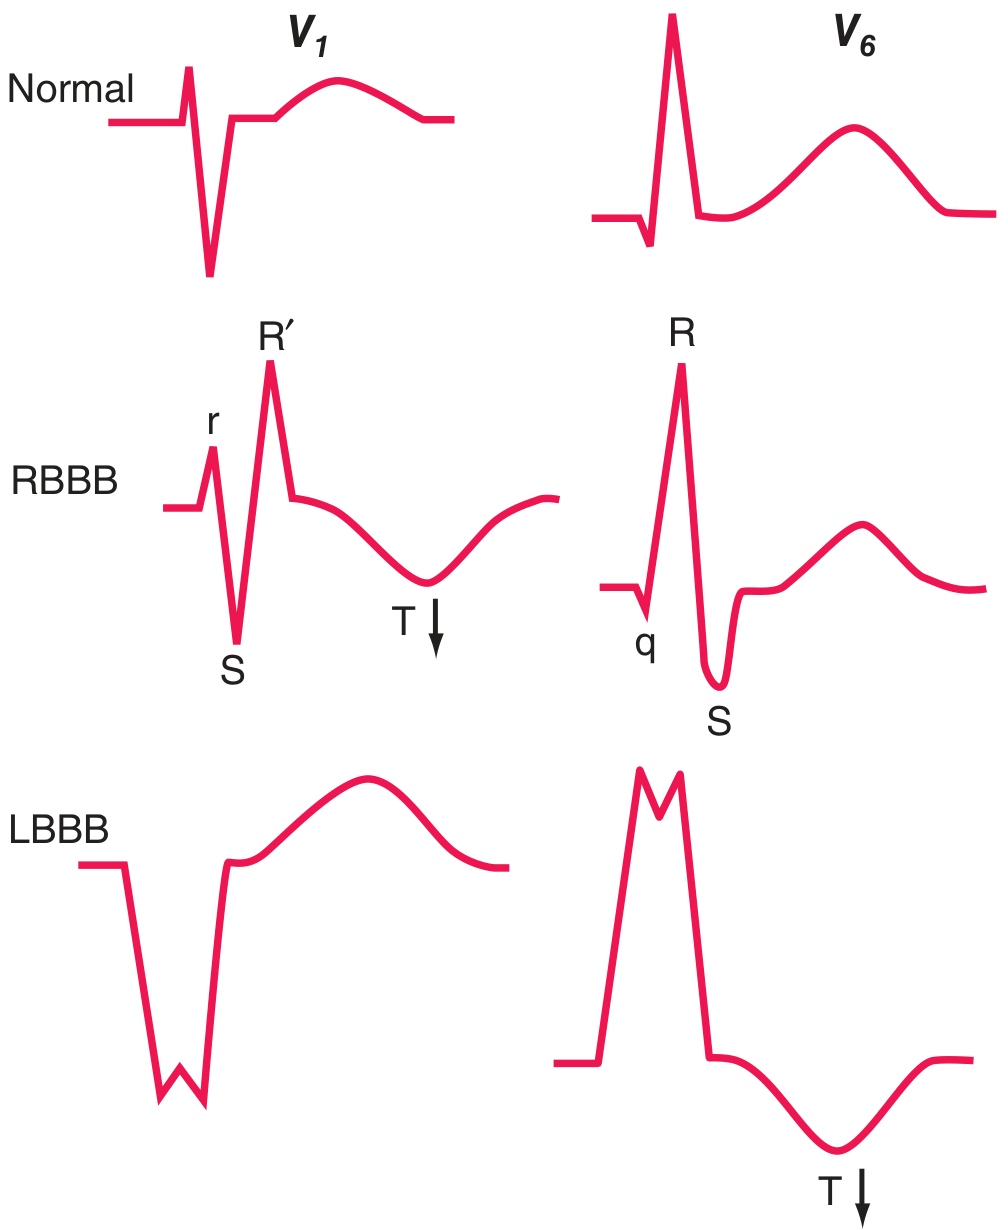
| Lead | Pattern |
|---|---|
| V1 | Wide, predominantly negative QS or rS complex |
| V5, V6, I, aVL | Broad, notched (M-shaped) positive R wave (no q wave) |
| ST-T wave | Discordant - T wave is opposite in polarity to the terminal QRS deflection |
- It causes dyssynchronous ventricular contraction - the LV lateral wall contracts late, reducing pump efficiency
- LBBB with EF ≤ 35% is the primary indication for Cardiac Resynchronization Therapy (CRT/biventricular pacing)
- New-onset LBBB in a CHF patient = assume ischemic cause until proven otherwise
- Harrison's Principles of Internal Medicine, 22nd Ed.
4. Atrial Fibrillation (AF)
- Absent P waves - replaced by irregular fibrillatory baseline (f waves), best seen in V1 and II
- Irregularly irregular RR intervals
- Narrow QRS (unless aberrant conduction or bundle branch block coexists)
-
LA dilation from elevated filling pressures → AF
-
AF with rapid ventricular rate can itself cause cardiomyopathy (tachycardia-induced cardiomyopathy)
-
Loss of atrial kick (atrial systole) contributes ~20-30% of ventricular filling; losing this worsens CHF
-
Braunwald's Heart Disease, A Textbook of Cardiovascular Medicine
5. Non-Specific ST-T Wave Changes
- Subendocardial ischemia from elevated diastolic filling pressures compressing coronary perfusion
- Digitalis effect - characteristic "reverse tick" or "sagging" ST depression (scoop-shaped), most prominent in V5/V6 and inferior leads. This is a digitalis effect, not toxicity.
- Electrolyte disturbances from diuretics (hypokalemia → ST depression, flat/inverted T waves, prominent U waves; hypomagnesemia)
- Secondary changes from bundle branch block
6. QRS Prolongation / Intraventricular Conduction Delay (IVCD)
- QRS duration > 120 ms (whether from LBBB, RBBB, or non-specific IVCD) indicates dyssynchrony
- QRS > 150 ms with LBBB morphology = the best predictor of response to CRT
- Prolonged QRS reflects delayed or disorganized ventricular activation
7. Poor R-Wave Progression (PRWP)
- R waves fail to grow from V1 → V4 (normally, the R wave gets progressively taller)
- In CHF from dilated cardiomyopathy or prior anterior MI, extensive myocardial fibrosis causes loss of anterior forces
- May mimic a "silent" anterior MI on ECG
8. Right Ventricular Hypertrophy (RVH) / Right Heart Strain
- Right axis deviation (axis > +90°)
- Tall R waves in V1 (R > S in V1)
- Deep S waves in V5/V6
- ST depression and T-wave inversion in right precordial leads (V1-V4) - "right ventricular strain"
- P pulmonale - tall, peaked P waves in II > 2.5 mm (right atrial enlargement)
- S1Q3T3 pattern (if acute right heart strain from pulmonary embolism precipitating CHF)
- Harrison's Principles of Internal Medicine, 22nd Ed.
9. Low Voltage
- Pericardial effusion (especially cardiac tamponade)
- Dilated cardiomyopathy (fibrosis replaces functional myocardium)
- Cardiac amyloidosis - a classic pattern of low voltage WITH significant LVH on echo ("voltage-mass discrepancy")
- Obesity, anasarca (edema increases resistance)
- Hypothyroidism (a reversible cause of CHF)
| Cause | Key ECG Feature |
|---|---|
| Pericardial effusion | Low voltage ± electrical alternans |
| Amyloidosis | Low voltage + pseudo-infarct Q waves in inferior/lateral leads |
| Dilated cardiomyopathy | Low voltage + LBBB + poor R-wave progression |
- Goldman-Cecil Medicine
10. Prolonged QTc
- Commonly seen in CHF patients due to electrolyte disturbances (hypokalemia, hypomagnesemia from diuretics), drug effects (amiodarone, sotalol, digoxin toxicity), and underlying cardiomyopathy
- QTc > 500 ms significantly increases risk of Torsades de Pointes
- Important: LBBB itself causes QTc prolongation as a secondary repolarization change - this must be distinguished from primary QT prolongation
11. Ischemic Changes (If Underlying IHD)
- Q waves - pathologic Q waves (> 40 ms wide, > 25% of R-wave amplitude) indicate prior MI, which caused the CHF
- ST segment changes - ST elevation in acute decompensation from ACS; ST depression from subendocardial ischemia
- T-wave inversions - "Wellens syndrome" pattern (symmetric deep inversions in V2-V4) = critical LAD disease
Summary Table - ECG Changes in CHF
| ECG Finding | Underlying Cause | Clinical Significance |
|---|---|---|
| Sinus tachycardia | Sympathetic activation | Compensation, poor prognosis |
| LVH (voltage + strain) | Hypertension, pressure overload | Suggests long-standing CHF cause |
| LBBB | Cardiomyopathy, IHD | Dyssynchrony; CRT candidacy (if EF ≤35%) |
| AF | LA dilation, neurohumoral | Worsens CHF; treat rate/rhythm |
| Poor R-wave progression | Anterior MI, DCM fibrosis | Silent prior infarction |
| Low voltage | Pericardial effusion, amyloid, DCM | Identifies specific etiology |
| Right heart strain | Pulmonary HTN, cor pulmonale | Right-sided CHF |
| Prolonged QTc | Electrolytes, drugs | Arrhythmia risk |
| Pathologic Q waves | Prior MI | IHD as CHF etiology |
| Digitalis effect | Digoxin therapy | Drug effect (≠ toxicity) |
| Electrical alternans | Large pericardial effusion | Tamponade risk |
Key Clinical Point
- Harrison's Principles of Internal Medicine, 22nd Ed.; Goldman-Cecil Medicine; Braunwald's Heart Disease