
Most common ecg findings in the cvs cases and along with are images features compared with normal ecg
Reading File
Now I'll search the medical library for ECG findings in cardiovascular cases.
Finding Sources
Finding Sources
Searching the Web
common ECG findings cardiovascular diseases compared to normal ECG
Finding Sources
Finding Sources
Good - I have strong sources. Let me now read the relevant textbook sections and search for ECG images in parallel.
Reading File
Finding Sources
Finding Sources
Now let me get the detailed ECG content from Rosen's and Harrison's, and search for ECG images.
Reading File
Finding Sources
Excellent. I have rich content from Rosen's block 11. Let me now grab the ECG images from that block and the Harrison's ECG section.
Reading File
Reading File
I have rich content and image URLs. Let me now fetch the key ECG images in parallel.
Loading Image
Loading Image
Reading File
Excellent - I have the normal ECG diagram, hyperacute T waves, and ST morphology images. Let me fetch a few more key ECG images (ST morphology, T wave inversions, LVH, heart block/arrhythmia) and get more content.
Loading Image
Reading File
I now have extensive content and 3 key images. Let me fetch 2 more critical ECG images (ST depression, T wave patterns) and get content on LBBB, LVH, heart block, and AF ECG findings.
Loading Image
Reading File
I have excellent content from Rosen's covering STEMI, ST morphology, T waves, Q waves, Wellens syndrome. Now let me fetch the Wellens syndrome image and get the LBBB/LVH/arrhythmia ECG images.
Loading Image
Reading File
I now have comprehensive content and 5 ECG images. I have enough to write an excellent, detailed, image-rich answer. Let me now compose the full response.
Common ECG Findings in Cardiovascular Cases - With Images Compared to Normal
The Normal ECG - Baseline Reference
Before examining pathological ECGs, understanding normal ECG components is essential.
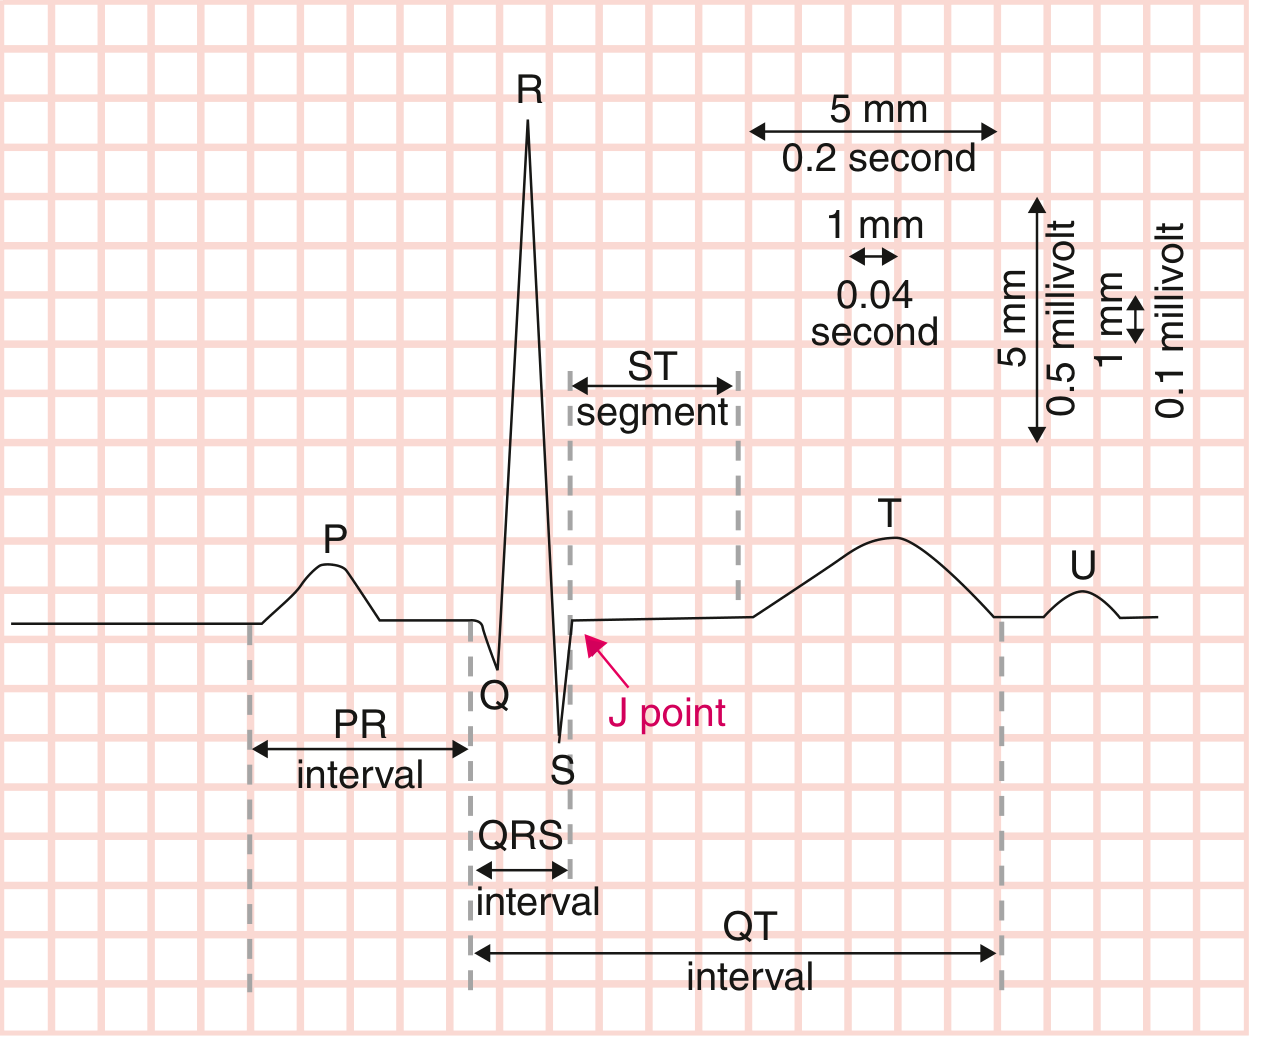
Normal ECG inscription showing P wave (atrial depolarization), PR interval (AV conduction delay), QRS complex (ventricular depolarization), ST segment + T wave (ventricular repolarization), J point, and QT interval. Paper speed: 25 mm/sec; 1 small box = 0.04 sec; 1 mm vertical = 0.1 mV. - Goldman-Cecil Medicine, Fig. 42-2
Normal values at a glance:
| Component | Normal Value |
|---|---|
| Heart rate | 60-100 bpm |
| P wave | Upright in I, II, aVF; duration <0.12 s |
| PR interval | 0.12-0.20 s (3-5 small boxes) |
| QRS duration | <0.12 s (3 small boxes) |
| QT interval | <0.44 s (corrected for rate) |
| ST segment | Isoelectric (at the TP segment baseline) |
| T wave | Upright in I, II, V3-V6; inverted in aVR; variable in III, aVL, aVF |
1. ST Segment Elevation - STEMI (Acute MI)
What changes vs. normal:
- Normal: ST segment sits flat at the isoelectric baseline
- STEMI: ST segment rises above the isoelectric line in at least 2 contiguous leads
- Diagnostic cut-offs (per Fourth Universal Definition of MI):
- Men >40 years: ≥2 mm in V2-V3, ≥1 mm in all other leads
- Men <40 years: ≥2.5 mm in V2-V3
- Women: ≥1.5 mm in V2-V3, ≥1 mm in all other leads
Evolution of STEMI on ECG (earliest to latest):
- Hyperacute T waves - tall, broad, peaked T waves appearing within minutes of infarction onset
- ST elevation - J-point elevation with flat/convex/tombstone morphology
- Q waves - pathologic Q waves develop at 8-12 hours (irreversible necrosis marker)
- T wave inversion - as ST segments return to baseline
- Persistent Q waves - permanent markers of prior infarction
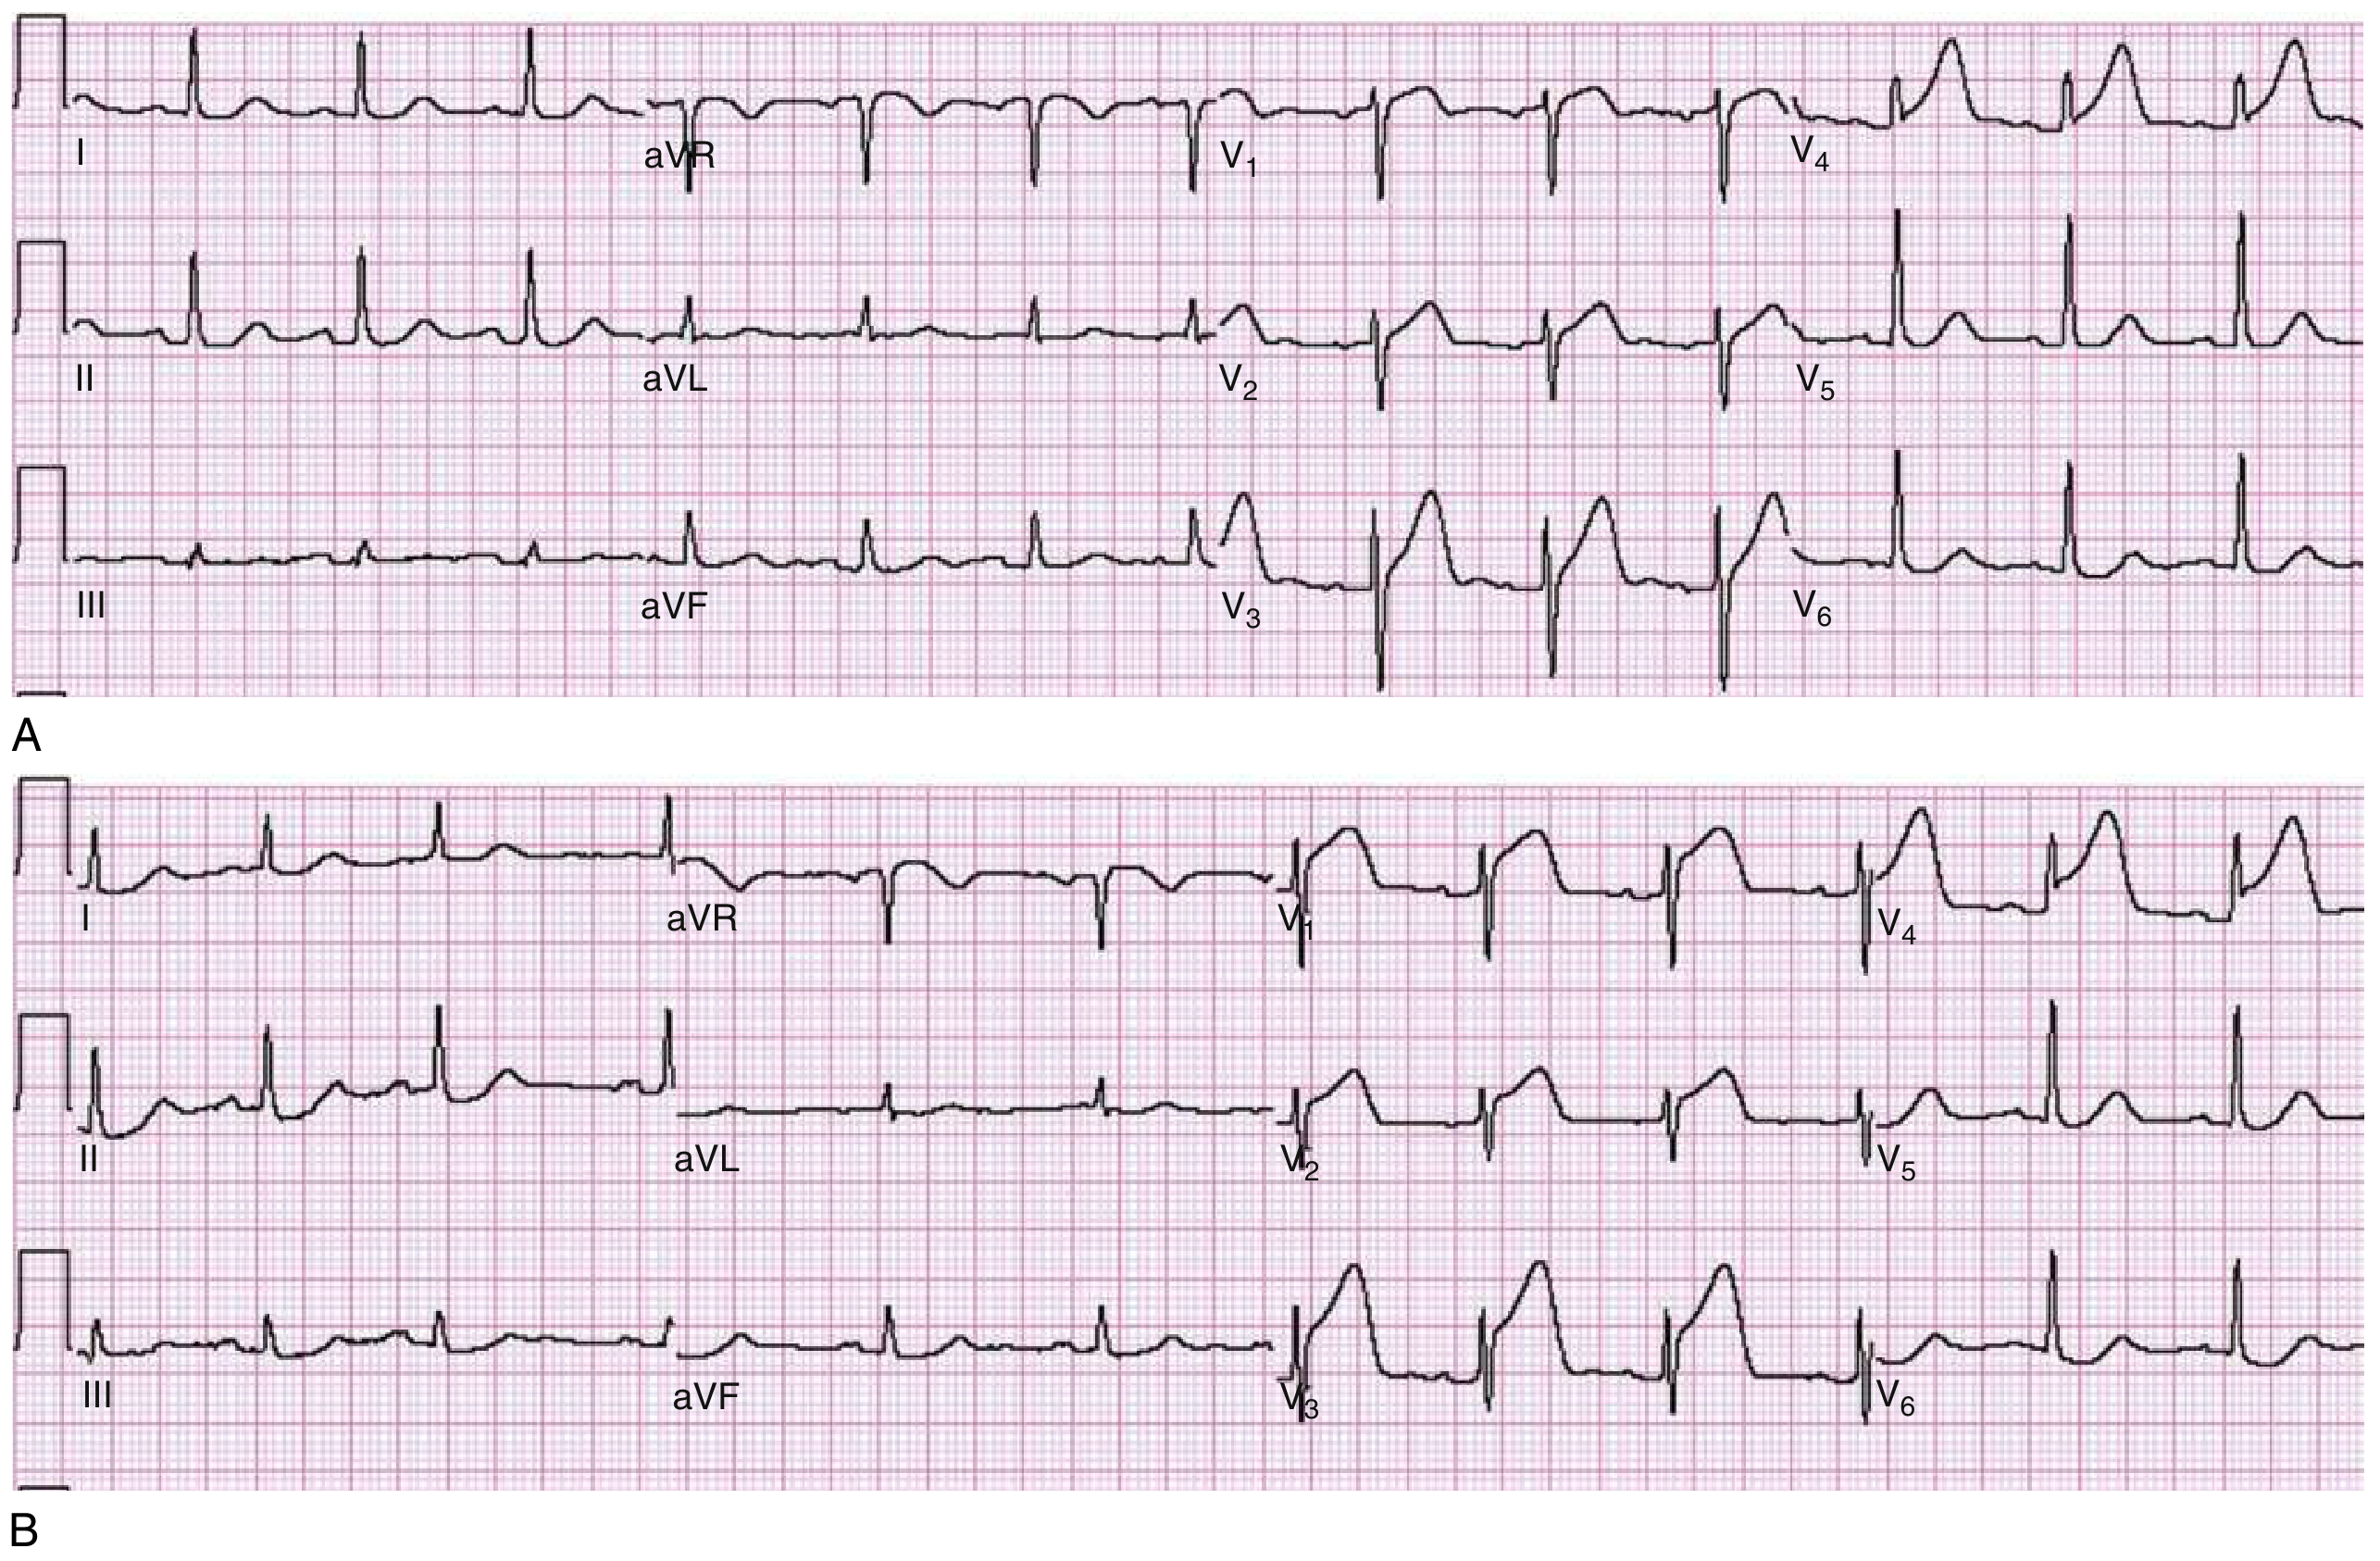
Fig. 64.1: (A) Hyperacute broad tall T waves in V3-V4 with early ST rise. (B) Same patient 30 minutes later showing frank ST elevation in V1-V4. - Rosen's Emergency Medicine
Regional localization by lead:
| Location | Leads with ST elevation | Artery |
|---|---|---|
| Anterior | V1-V4 | LAD |
| Anterolateral | V1-V6, I, aVL | LAD (proximal) |
| Inferior | II, III, aVF | RCA or LCx |
| Lateral | I, aVL, V5-V6 | LCx |
| Posterior | ST depression V1-V3 (mirror) | RCA/LCx |
| Right ventricular | V1, V3R-V4R | RCA (proximal) |
2. ST Segment Morphology - AMI vs. Mimics
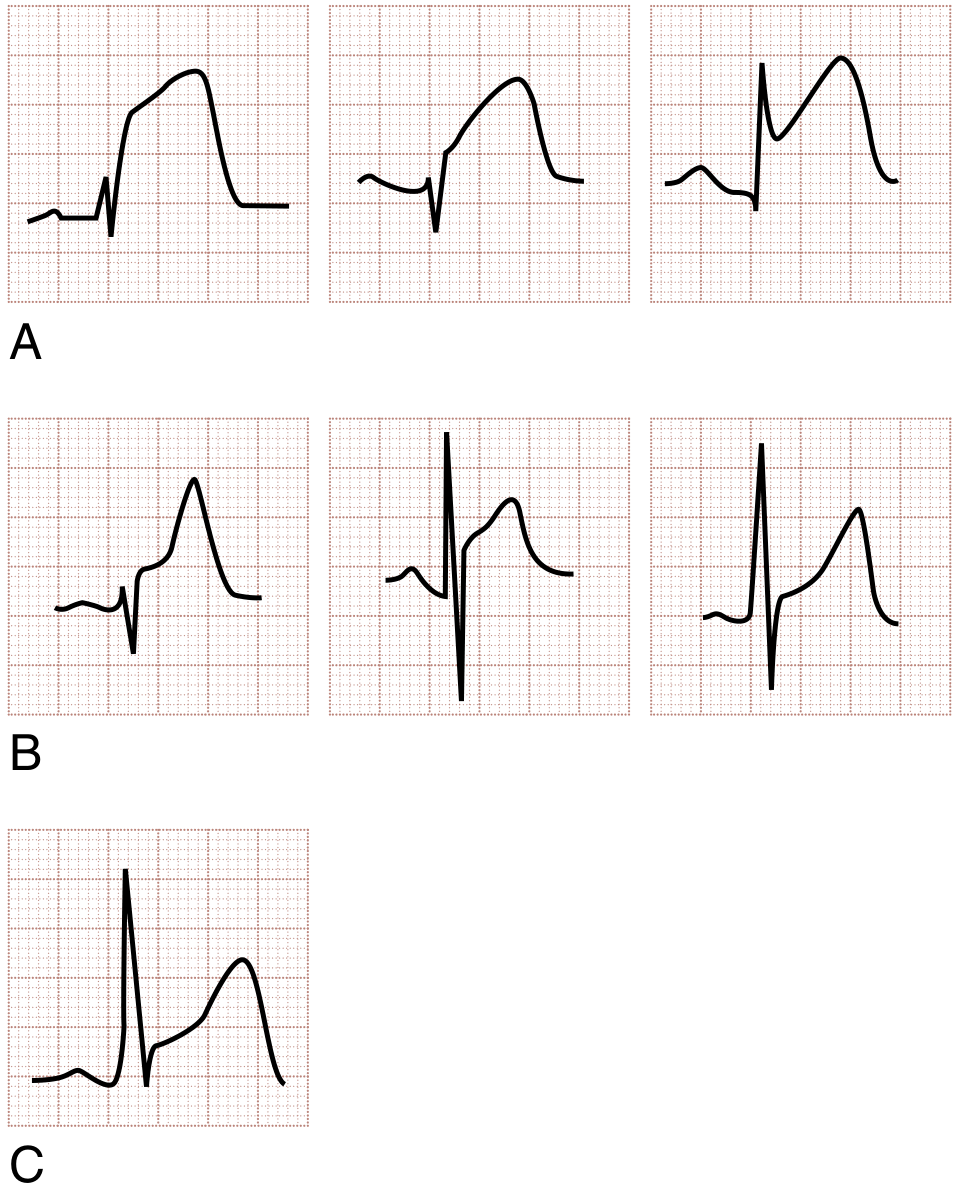
Fig. 64.2: (A) STEMI - flat/convex (domed) ST elevation. (B) Non-AMI causes: concave ST elevation of benign early repolarization (BER) and pericarditis. (C) STEMI can occasionally also show concavity - serial ECGs help resolve this. - Rosen's Emergency Medicine
Key morphologic distinctions:
| Condition | ST morphology | Key differentiator |
|---|---|---|
| STEMI | Flat, convex ("domed"), or "tombstone" | Dynamic - changes with symptoms; reciprocal depression |
| Benign early repolarization | Concave ("smiley face"), V4-V6 | Static, young males, J-point notching |
| Acute pericarditis | Concave, diffuse (all leads except aVR/V1) | PR depression in II, PR elevation in aVR |
| LVH | Concave in V5-V6 with deep S waves | Voltage criteria (Sokolow-Lyon) |
3. ST Segment Depression - NSTEMI / Subendocardial Ischemia
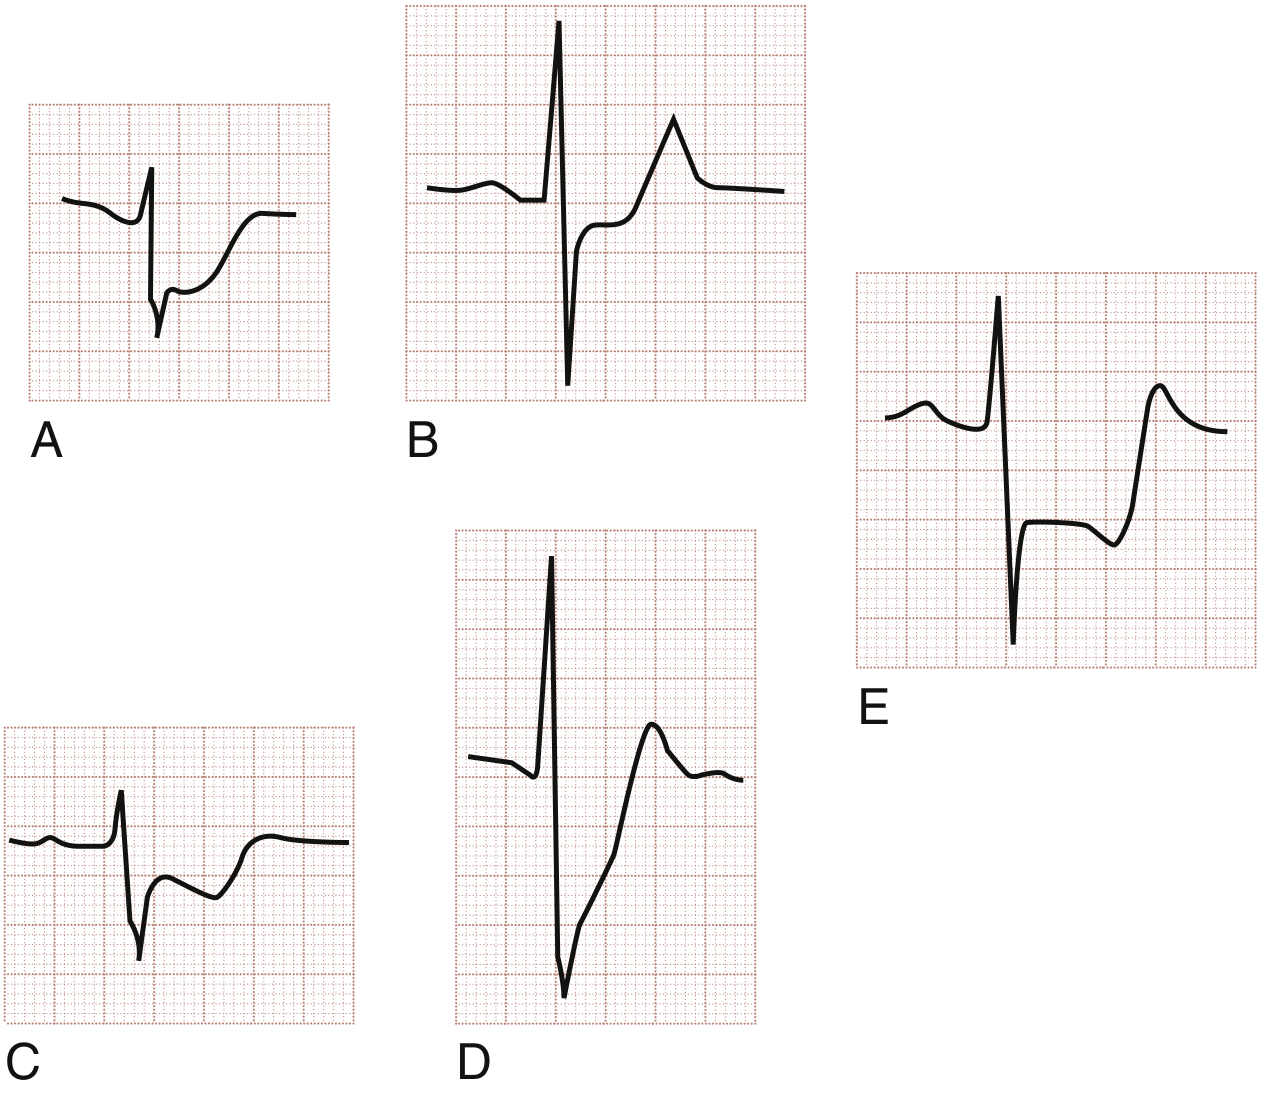
Fig. 64.3: (A) Horizontal ST depression - unstable angina. (B) Horizontal ST depression - NSTEMI. (C) Downsloping ST depression - unstable angina. (D) Upsloping ST depression - less ischemia-specific. (E) Reciprocal ST depression in lead III with anterior STEMI. - Rosen's Emergency Medicine
ST depression patterns compared to normal:
- Normal: ST segment is isoelectric (at baseline)
- Horizontal depression: Most specific for subendocardial ischemia - measures ≥1 mm below isoelectric line at J+60-80 ms
- Downsloping depression: More ominous, strongly associated with ischemia
- Upsloping depression: Less specific, also seen in sinus tachycardia
- Reciprocal depression: Mirror image of ST elevation in the opposite wall - increases specificity for STEMI and predicts larger infarction
4. T Wave Abnormalities
T Wave Inversion (TWI)
Normal vs. abnormal:
- Normal: T waves upright in I, II, V3-V6; inverted only in aVR, V1
- Ischemic TWI: Narrow, deep, symmetrical inversions in the precordial or limb leads
Wellens Syndrome - a specific and critical pattern:
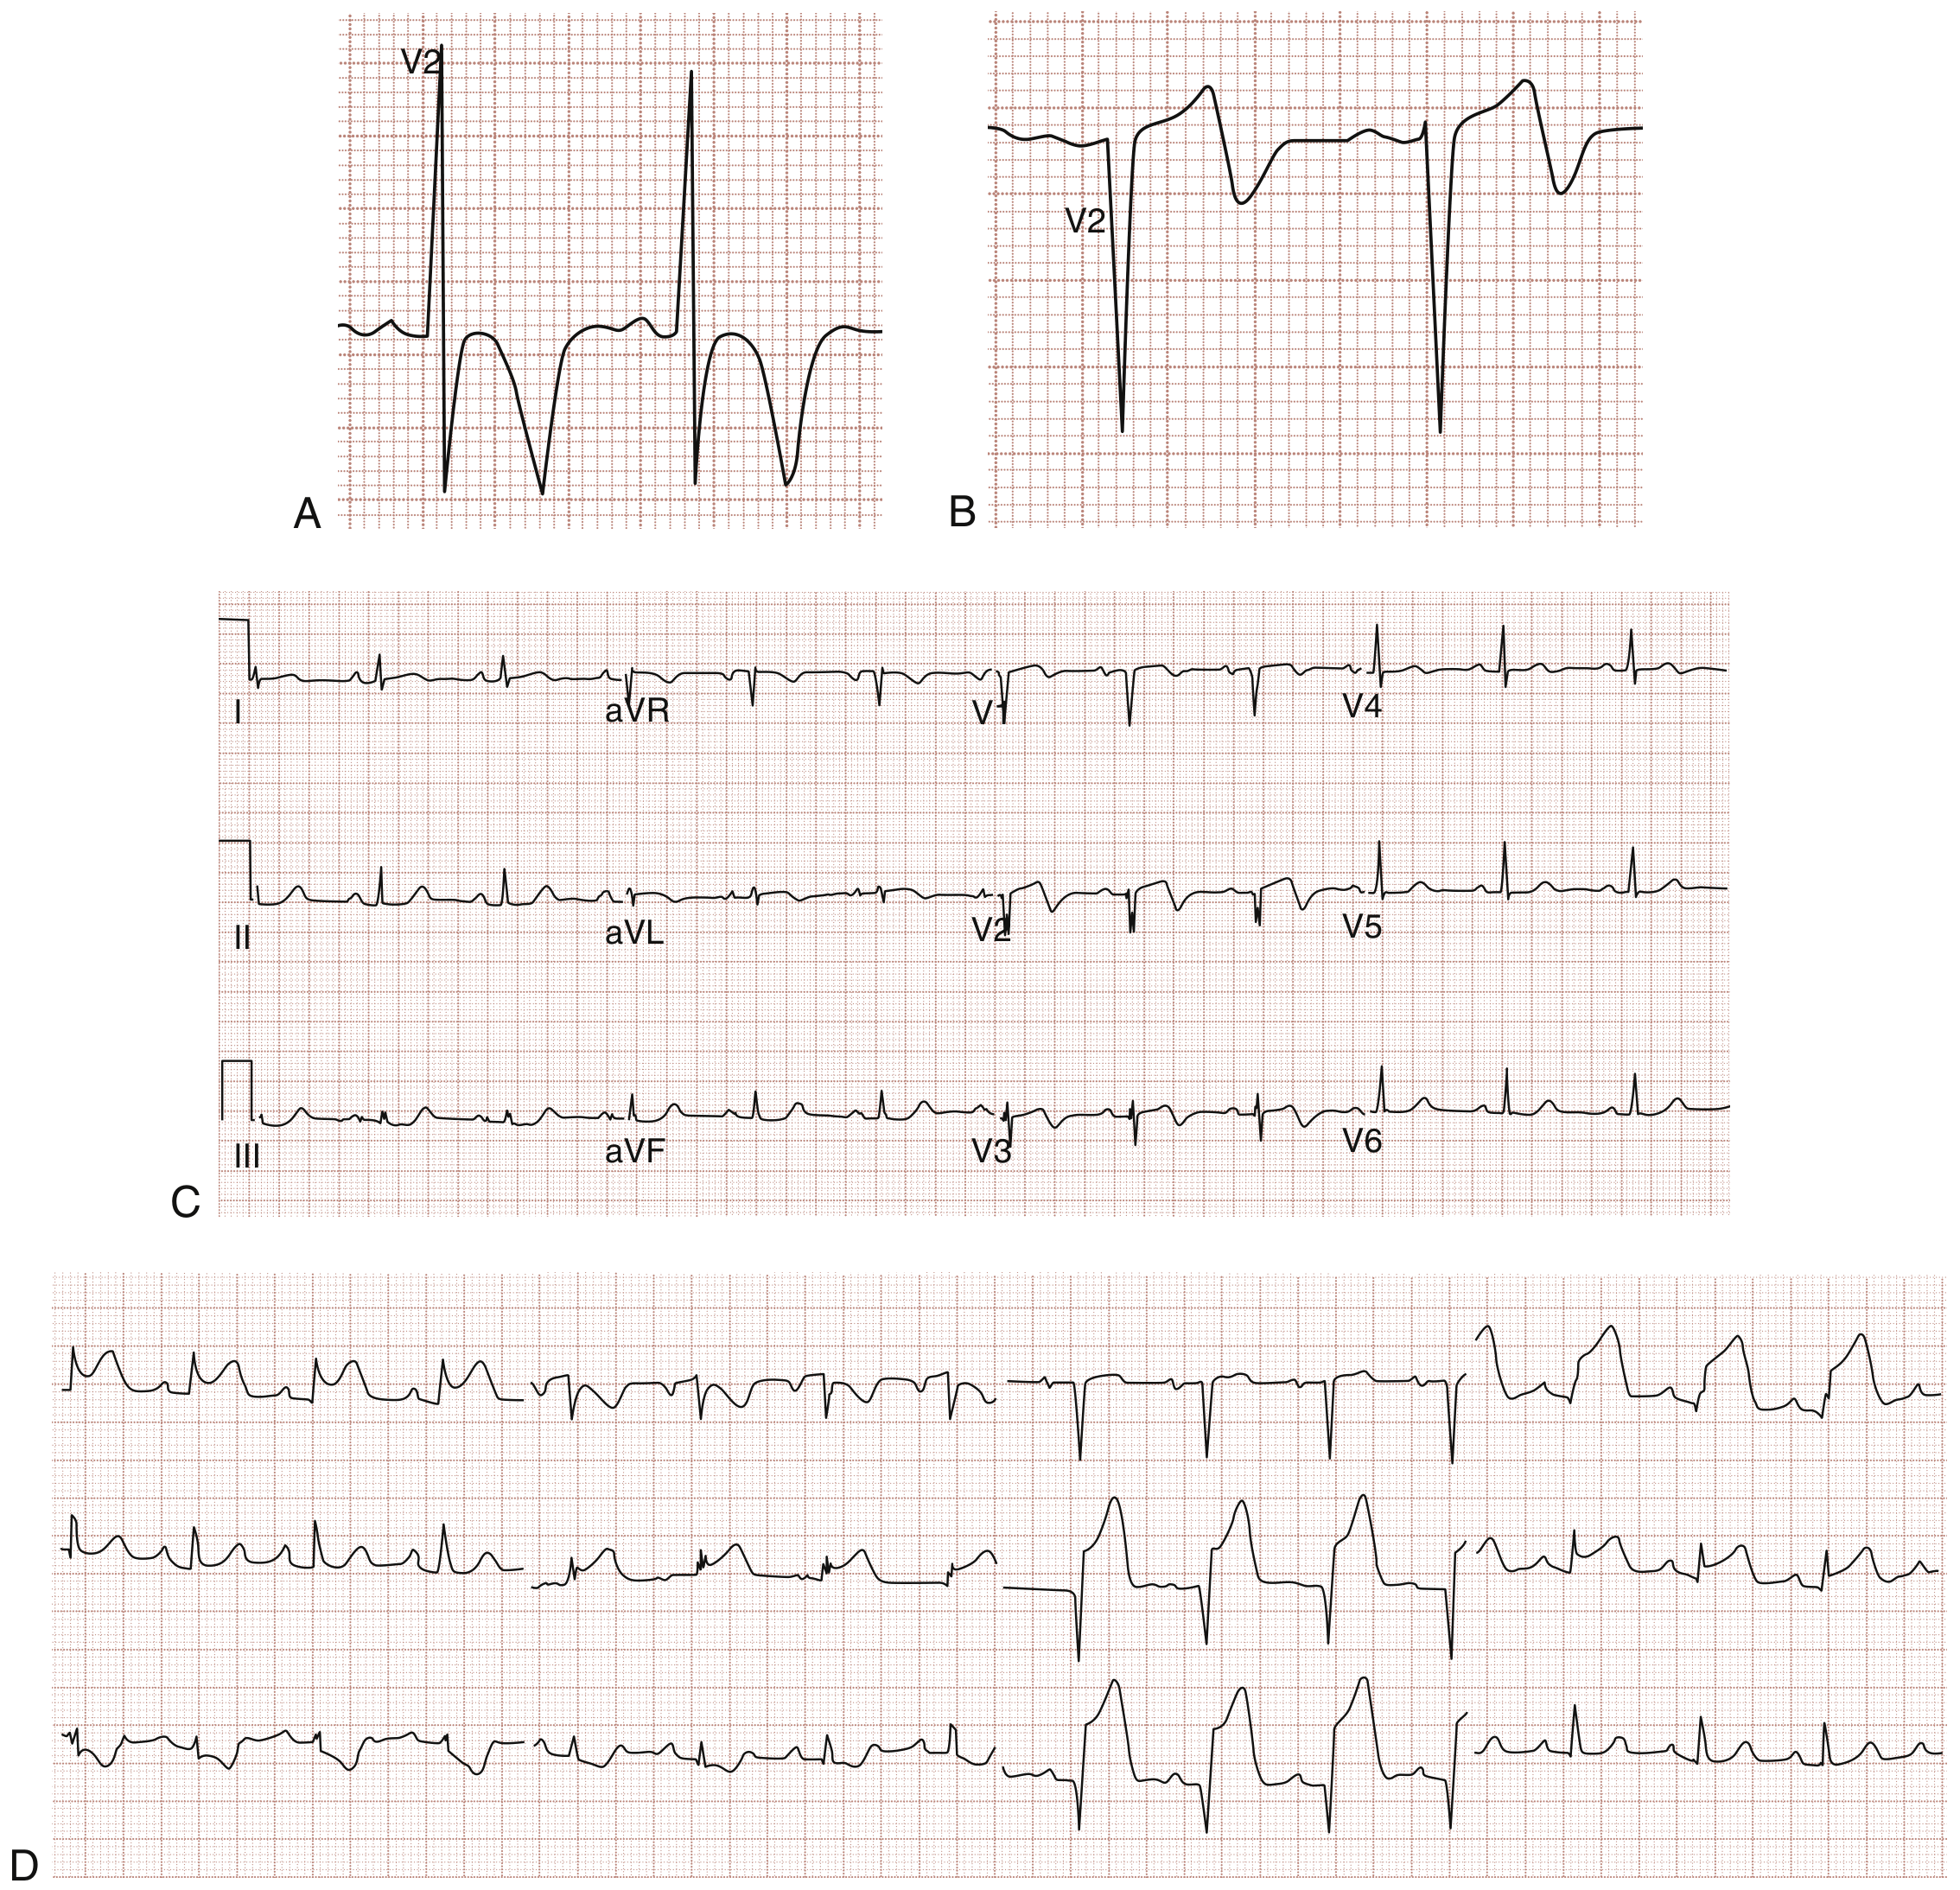
Fig. 64.5: (A) Type I Wellens: deeply inverted T waves in V2 (seen in ~75% of cases). (B) Type II Wellens: biphasic T waves in V2 (seen in ~25%). (C) Patient with Wellens pattern (pain-free). (D) Same patient 6 hours later with return of pain showing full anterolateral STEMI - proximal LAD occlusion confirmed. - Rosen's Emergency Medicine
- Clinical significance: Indicates critical proximal LAD stenosis; natural history is progression to anterior STEMI
- Characteristic features: Deep symmetric TWI or biphasic T waves in V2-V3; minimal ST elevation (<1 mm); no Q waves; often occurs when patient is pain-free
5. Left Bundle Branch Block (LBBB)
Normal vs. LBBB:
- Normal: QRS <0.12 s; upright R waves in lateral leads; concordant ST-T with QRS
- LBBB: QRS ≥0.12 s; broad notched R in I, aVL, V5-V6; QS pattern in V1-V3; discordant ST-T segments (ST and T opposite to QRS direction)
Rule of appropriate discordance: In LBBB, ST elevation in V1-V3 and ST depression with TWI in V5-V6 are normal findings (not ischemia). Ischemia is suspected when this rule is violated (Sgarbossa criteria):
- Concordant ST elevation ≥1 mm in any lead (5 points)
- Concordant ST depression ≥1 mm in V1-V3 (3 points)
- Excessively discordant ST elevation ≥5 mm (2 points)
- Score ≥3 = highly specific for acute MI in LBBB
6. Atrial Fibrillation (AF)
Normal vs. AF:
| Feature | Normal Sinus Rhythm | Atrial Fibrillation |
|---|---|---|
| P waves | Distinct, upright in II, one per QRS | Absent; replaced by chaotic f-waves (fine or coarse) |
| RR intervals | Regular | Irregularly irregular |
| Rate | 60-100 | Ventricular rate typically 110-160 (uncontrolled) |
| QRS | Narrow (unless aberrant conduction) | Narrow (unless LBBB or WPW) |
Key visual feature: Absent P waves replaced by an undulating, chaotic baseline with completely irregular ventricular response.
7. Heart Block (AV Block)
Normal PR interval: 0.12-0.20 s
| Type | ECG Finding | vs. Normal |
|---|---|---|
| 1st degree | PR >0.20 s; all P waves conduct | PR prolonged but every P followed by QRS |
| 2nd degree Mobitz I (Wenckebach) | Progressive PR lengthening until a P is dropped | PR gets longer each beat, then a QRS is dropped |
| 2nd degree Mobitz II | Fixed PR; sudden non-conducted P waves | PR constant but some P waves don't have a QRS |
| 3rd degree (Complete) | P waves and QRS completely dissociated | No relationship between P waves and QRS; QRS rate <40 |
8. Left Ventricular Hypertrophy (LVH)
Normal vs. LVH:
- Normal: R wave height + S wave depth do not meet voltage criteria
- LVH: Increased voltage + ST-T strain pattern
Sokolow-Lyon voltage criteria:
- S in V1 + R in V5 or V6 ≥35 mm, OR
- R in aVL ≥11 mm
LVH strain pattern: ST depression with asymmetric T wave inversion in I, aVL, V5-V6 - similar to ischemia but in the context of voltage criteria.
9. Pulmonary Embolism (PE) - S1Q3T3 Pattern
Normal vs. acute PE:
- Normal: No prominent S in lead I, no Q or T inversion in lead III
- Acute PE: The classic "S1Q3T3" pattern - S wave in lead I + Q wave in lead III + T wave inversion in lead III
- Also: Sinus tachycardia (most common), right heart strain (right axis deviation), new RBBB, T inversion in V1-V4
10. Pericarditis
Normal vs. acute pericarditis:
- Normal: Isoelectric ST throughout; flat PR
- Pericarditis: Diffuse concave ST elevation (all leads except aVR and V1) + PR depression (pathognomonic, best in lead II) + PR elevation in aVR
Summary Comparison Table
| Condition | ST Segment | T Waves | QRS | P Waves | Rate/Rhythm |
|---|---|---|---|---|---|
| Normal | Isoelectric | Upright I, II, V3-V6 | <0.12 s | Regular, one/beat | 60-100, regular |
| STEMI | Elevated (convex), regional | Hyperacute early, inverted late | May have Q waves | Normal | Often tachycardia |
| NSTEMI/UA | Depressed (horizontal/down) | Inverted | Normal | Normal | Often tachycardia |
| Wellens | Minimal elevation | Deep symmetric inversion V2-V3 | Normal, no Q | Normal | Normal |
| AF | Normal | Normal | Normal (may be wide) | Absent (f-waves) | Irregular |
| 1st-degree HB | Normal | Normal | Normal | Normal | PR >0.20 s |
| 3rd-degree HB | Normal | Normal | Wide (escape) | Dissociated from QRS | Bradycardia <40 |
| LBBB | Discordant elevation V1-V3 | Discordant inversions V5-V6 | Broad ≥0.12 s, notched R | Normal | Normal |
| LVH | Strain (depression V5-V6) | Asymmetric inversion | Tall R lateral leads | Normal | Normal |
| Pericarditis | Diffuse concave elevation | Normal initially | Normal | Normal | Sinus tachycardia |
| PE | Variable | Inversion V1-V4 | RBBB pattern | Normal | Sinus tachycardia |
Sources:
- Rosen's Emergency Medicine, Chapter 64 (ACS/ECG in detail)
- Goldman-Cecil Medicine, Chapter 42 (ECG fundamentals)
- Harrison's Principles of Internal Medicine 22e
- Robbins & Kumar Basic Pathology (arrhythmia mechanisms)
This is a shared conversation. Sign in to Orris to start your own chat.