
Classification of type 2 diabetes
type 2 diabetes classification insulin resistance pathogenesis diagram
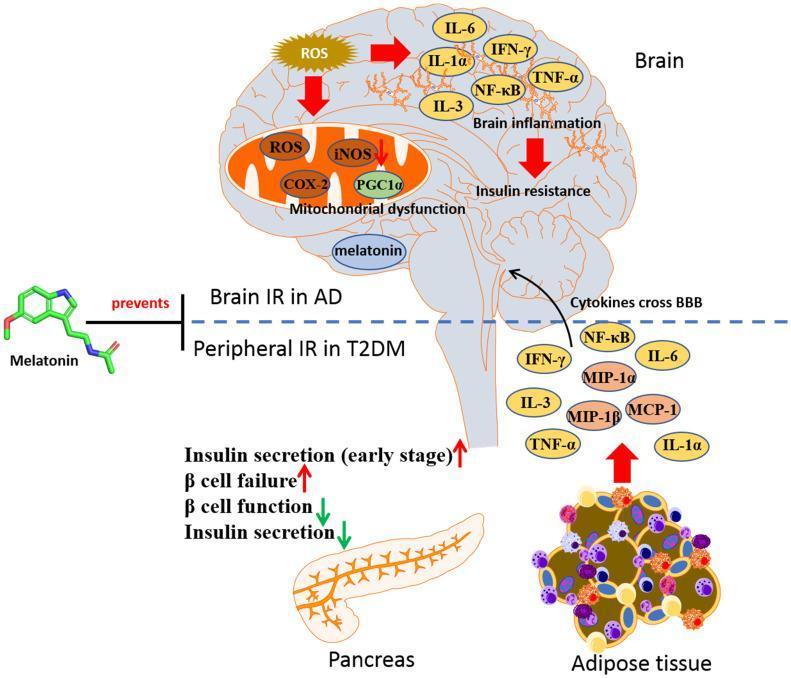
A medical pathophysiology diagram illustrating the link between peripheral insulin resistance (IR) in Type 2 Diabetes Mellitus (T2DM) and brain insulin resistance in Alzheimer's Disease (AD), highlighting the protective role of melatonin. The diagram is split into two sections by a dotted line representing the blood-brain barrier (BBB). The lower section depicts peripheral mechanisms including adipose tissue releasing pro-inflammatory cytokines (IL-1α, TNF-α, IL-3, IFN-γ, MCP-1, MIP-1α, MIP-1β, and NF-κB) and pancreatic alterations (early stage hyperinsulinemia followed by beta-cell failure and decreased insulin secretion). These peripheral cytokines are shown crossing the BBB into the brain. The upper section illustrates central effects: neuroinflammation characterized by IL-6 and TNF-α, mitochondrial dysfunction involving ROS, iNOS, COX-2, and PGC1α, and subsequent brain IR. A molecular structure of melatonin is shown on the left, indicated as an agent that 'prevents' the progression from peripheral IR to central neurodegeneration by targeting insulin signaling pathways.
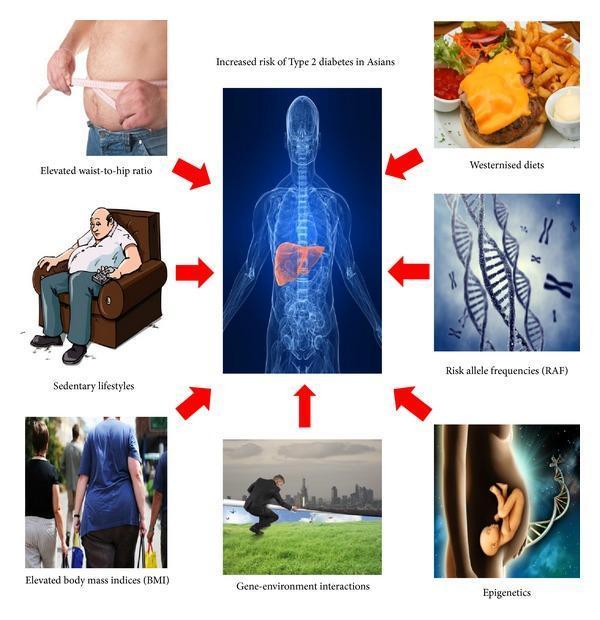
Educational infographic titled 'Increased risk of Type 2 diabetes in Asians' depicting a multifactorial model of disease pathogenesis. A central anatomical diagram of a human torso with a highlighted liver is surrounded by red arrows pointing to seven key contributing factors. The clinical and lifestyle factors include photographs and illustrations of: 'Elevated waist-to-hip ratio' (abdominal obesity measurement), 'Sedentary lifestyles' (physical inactivity), 'Elevated body mass indices (BMI)' (population overweight), and 'Westernised diets' (high-calorie processed food). The genetic and developmental components are represented by: 'Risk allele frequencies (RAF)' (DNA double-helix and chromosome imagery), 'Gene-environment interactions' (human interaction within a cityscape/natural setting), and 'Epigenetics' (maternal-fetal interaction with a DNA strand). This visual summarizes the synergy between genetic predisposition and environmental triggers in the development of insulin resistance and metabolic disease specifically within Asian populations.
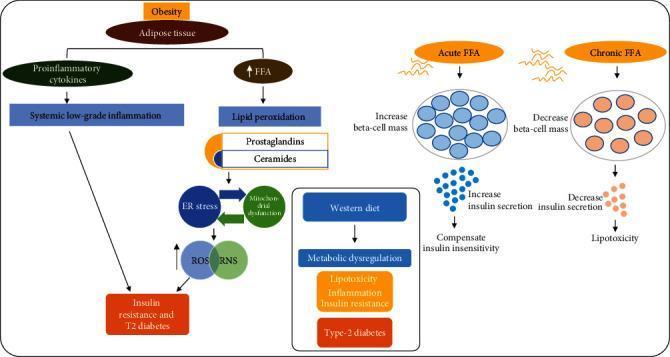
This pathophysiology diagram illustrates the metabolic pathways linking obesity, adipose tissue, and free fatty acids (FFAs) to insulin resistance and Type 2 diabetes (T2D). The flow is divided into several interconnected mechanisms. On the left, obesity-driven adipose tissue expansion releases proinflammatory cytokines leading to systemic low-grade inflammation, while elevated FFAs induce lipid peroxidation and the accumulation of prostaglandins and ceramides. These metabolites trigger a cycle of endoplasmic reticulum (ER) stress and mitochondrial dysfunction, resulting in elevated reactive oxygen species (ROS) and reactive nitrosative stress (RNS). Together, inflammation and oxidative stress culminate in insulin resistance and T2D. On the right, a comparison chart shows the differential effects of FFA exposure on pancreatic beta-cells: acute FFA exposure increases beta-cell mass and insulin secretion to compensate for insulin insensitivity, whereas chronic FFA exposure decreases beta-cell mass and insulin secretion, leading to lipotoxicity. A central inset further links a Western diet to metabolic dysregulation, encompassing lipotoxicity, inflammation, and insulin resistance as drivers of Type 2 diabetes.
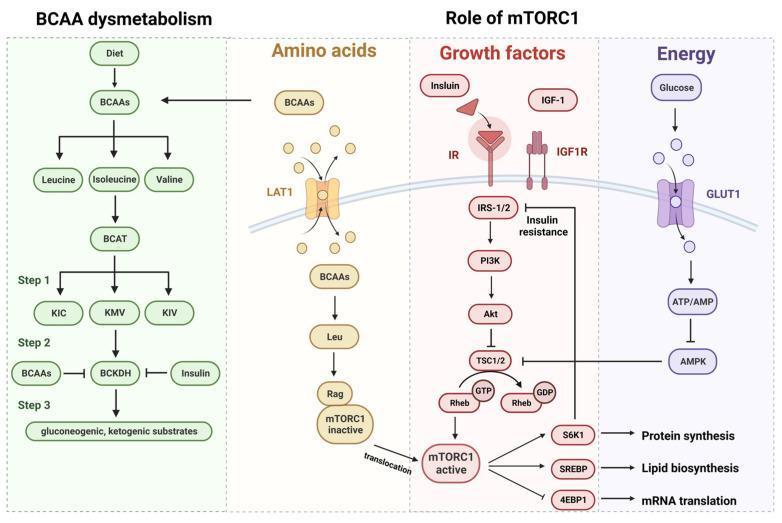
This medical illustration details the metabolic and signaling pathways linking branched-chain amino acids (BCAAs) to Type 2 Diabetes Mellitus (T2DM) and insulin resistance. The diagram is divided into four integrated sections: 'BCAA dysmetabolism', 'Amino acids', 'Growth factors', and 'Energy'. The BCAA dysmetabolism section outlines the progression from diet to the catabolism of Leucine, Isoleucine, and Valine into alpha-keto acids (KIC, KMV, KIV) via BCAT. It highlights the critical regulation point at the BCKDH complex, influenced by insulin and BCAA levels, leading to gluconeogenic and ketogenic substrates. The central portion focuses on the 'Role of mTORC1', showing how BCAAs enter the cell via LAT1 and, together with growth factors (Insulin/IR and IGF-1/IGF1R), activate the PI3K-Akt pathway. This signaling cascade inhibits TSC1/2, allowing Rheb-GTP to activate mTORC1. Active mTORC1 then drives protein synthesis (S6K1), lipid biosynthesis (SREBP), and mRNA translation (4EBP1). Notably, the diagram illustrates a feedback loop where S6K1 promotes insulin resistance by inhibiting IRS-1/2. The 'Energy' section shows glucose uptake via GLUT1 influencing the ATP/AMP ratio and AMPK, which acts as a negative regulator of the mTORC1 pathway.
Classification of Type 2 Diabetes Mellitus
1. Where T2DM Fits: The Overall Classification of Diabetes
| Category | Mechanism |
|---|---|
| Type 1 DM | Beta-cell destruction → absolute insulin deficiency (immune-mediated or idiopathic) |
| Type 2 DM | Combination of insulin resistance + beta-cell dysfunction |
| Other Specific Types | Monogenic, drug-induced, pancreatogenic, endocrinopathies, etc. |
| Gestational DM | Glucose intolerance first recognized during pregnancy |
- Robbins, Cotran & Kumar Pathologic Basis of Disease, Table 24.6
2. Definition of Type 2 DM
- Robbins, Table 24.7
3. Distinguishing Features vs. Type 1 DM
| Feature | Type 1 DM | Type 2 DM |
|---|---|---|
| Age of onset | Usually childhood/adolescence | Usually adult (but rising in youth) |
| Body habitus | Normal weight or weight loss | ~80% are obese |
| Insulin levels | Progressive decrease | Elevated early; variable late |
| Autoantibodies | Present (anti-GAD65, anti-IA2, anti-ZnT8) | Absent |
| HLA linkage | MHC class II (strong) | No HLA linkage |
| Key genes | CTLA4, PTPN22, insulin VNTR | TCF7L2, PPARG, FTO |
| Pathogenesis | Autoimmune T-cell mediated beta-cell destruction | Insulin resistance + beta-cell failure |
| Islet pathology | Insulitis (T cells, macrophages); beta-cell depletion | Amyloid deposition; mild beta-cell depletion |
| Acute complication | DKA (ketoacidosis) | Hyperosmolar non-ketotic coma |
- Robbins, Table 24.7
4. Classification of T2DM by Underlying Mechanism
a. Insulin Resistance
- Peripheral tissues (skeletal muscle, liver, adipose) fail to respond normally to insulin
- Liver: fails to suppress gluconeogenesis → elevated fasting glucose
- Skeletal muscle: impaired glucose uptake and glycogen synthesis → high postprandial glucose
- Adipose: uncontrolled lipolysis → excess free fatty acids (FFAs)
- Reduced GLUT-4 translocation to the plasma membrane is a key molecular defect
b. Beta-Cell Dysfunction
-
Initially compensatory hyperinsulinemia maintains euglycemia
-
Over time, beta cells cannot sustain the increased secretory demand
-
Result: relative insulin deficiency and chronic hyperglycemia
-
Islets show amyloid (IAPP - islet amyloid polypeptide) deposition
-
Robbins, p.1003
5. Risk Factor-Based Classification / Subtypes
Obesity-Related T2DM
- Most common form (~80% of T2DM patients)
- Visceral/central adiposity more pathogenic than subcutaneous fat
- FFAs from adipose cause lipotoxicity, ceramide accumulation, ER stress, and impair insulin signaling
Non-Obese T2DM
- Predominantly seen in Asian/Middle Eastern populations
- Primary visceral adiposity without overt obesity (normal BMI but high waist circumference)
- Same insulin resistance mechanism via visceral fat
Late-Onset Autoimmune Diabetes (LADA)
- Also called "Type 1.5" or "slowly progressive autoimmune diabetes in adults"
- Clinically resembles T2DM initially but autoantibodies are present (usually anti-GAD65)
- Progresses to absolute insulin deficiency over months to years
Metabolically Healthy Obese
- A subgroup of obese individuals with preserved insulin sensitivity
- Primarily subcutaneous (not visceral) fat distribution - area of active research
6. Other Specific Types That Must Be Distinguished from T2DM
Genetic Defects of Beta-Cell Function (MODY)
- Maturity-onset diabetes of the young - autosomal dominant, often misdiagnosed as T2DM
- MODY1: HNF4A mutation | MODY2: Glucokinase mutation | MODY3: HNF1A mutation (most common MODY)
- MODY4: PDX1 | MODY5: HNF1B | MODY6: NEUROD1
- Neonatal diabetes: KCNJ11/ABCC8 mutations
- MIDD: Mitochondrial DNA mutation (m.3243A→G) with deafness
Genetic Defects in Insulin Action
- Type A insulin resistance (receptor/post-receptor defects)
- Lipoatrophic diabetes (loss of adipose tissue)
Pancreatogenic (Type 3C) Diabetes
- Chronic pancreatitis, pancreatectomy, pancreatic cancer, cystic fibrosis, hemochromatosis, fibrocalculous pancreatopathy
- Often misclassified as T2DM; distinct management considerations
Endocrinopathy-Associated Diabetes
- Acromegaly (GH excess), Cushing syndrome (cortisol excess), hyperthyroidism, pheochromocytoma, glucagonoma
- Counter-regulatory hormone excess causes insulin resistance
Drug-Induced Diabetes
- Glucocorticoids, thiazides, nicotinic acid, beta-agonists, tacrolimus, protease inhibitors, interferon-alpha, phenytoin, pentamidine
Infections
- Cytomegalovirus, Coxsackie B virus, congenital rubella
Genetic Syndromes
-
Down syndrome, Klinefelter syndrome, Turner syndrome, Prader-Willi syndrome
-
Robbins, Table 24.6 (ADA classification, modified)
7. Pathophysiology Diagram

8. Summary
- Within the ADA framework - it is one of four major categories of DM, defined by insulin resistance + beta-cell dysfunction (not autoimmune)
- Internally - it is a heterogeneous syndrome spanning obesity-related, non-obese (visceral fat), LADA, and must be distinguished from MODY, Type 3C, and endocrinopathy-related forms that can mimic it clinically
- Robbins, Cotran & Kumar Pathologic Basis of Disease, 10th Ed., pp. 999-1005
- Harrison's Principles of Internal Medicine, 22nd Ed. (2025)
Drugs
Which aspect of drugs for Type 2 diabetes are you asking about?
Classification of drugs of diabetes
antidiabetic drugs classification oral hypoglycemic agents diagram
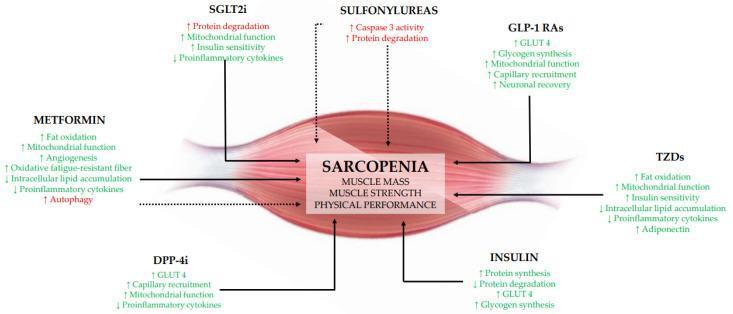
A medical infographic illustrating the complex pathophysiological relationship between various glucose-lowering medications and sarcopenia markers (muscle mass, strength, and physical performance). The central element is a skeletal muscle illustration superimposed with a box containing the key clinical outcomes of sarcopenia. Surrounding this are seven classes of antidiabetic drugs: Metformin, SGLT2 inhibitors (SGLT2i), Sulfonylureas, GLP-1 receptor agonists (GLP-1 RAs), DPP-4 inhibitors (DPP-4i), Thiazolidinediones (TZDs), and Insulin. Each drug is mapped to specific cellular and metabolic effects—such as mitochondrial function, protein synthesis/degradation, fat oxidation, and proinflammatory cytokines—using arrows to indicate increase or decrease. Solid black lines and green text signify beneficial mechanistic pathways (e.g., increased angiogenesis, GLUT4, and glycogen synthesis), while dotted lines and red text denote detrimental pathways (e.g., increased autophagy, protein degradation, and caspase-3 activity). The diagram highlights the mixed effects of agents like Metformin and SGLT2i versus the primarily beneficial profile of GLP-1 RAs and TZDs, and the purely catabolic indicators associated with Sulfonylureas in this specific clinical context.
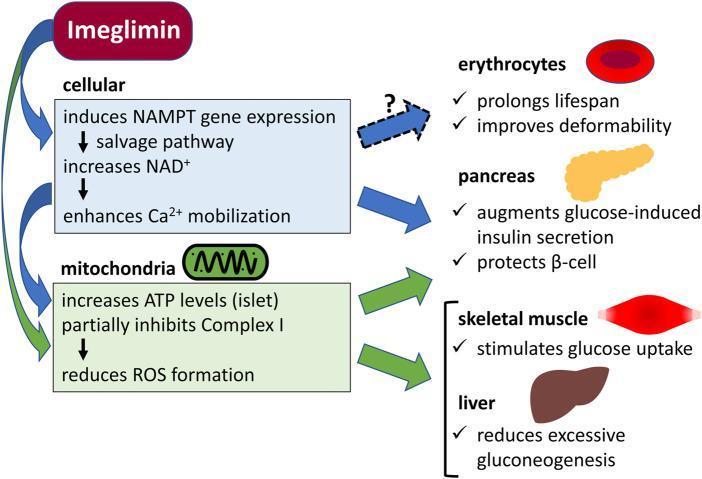
This pathophysiology diagram illustrates the multi-organ mechanism of action of Imeglimin, a novel oral antidiabetic agent. The visual is divided into two primary functional pathways: cellular and mitochondrial. The cellular pathway (blue box) shows Imeglimin inducing NAMPT gene expression, activating the NAD+ salvage pathway, and enhancing Ca2+ mobilization. The mitochondrial pathway (green box) highlights increased ATP production in pancreatic islets, partial inhibition of mitochondrial respiratory chain Complex I, and subsequent reduction in Reactive Oxygen Species (ROS) formation. These mechanisms lead to specific clinical outcomes across four organ systems: in erythrocytes, it is hypothesized to prolong lifespan and improve deformability; in the pancreas, it augments glucose-induced insulin secretion and protects beta cells; in skeletal muscle, it stimulates glucose uptake; and in the liver, it reduces excessive gluconeogenesis. The diagram effectively synthesizes pharmacological signaling with systemic metabolic benefits for type 2 diabetes management.
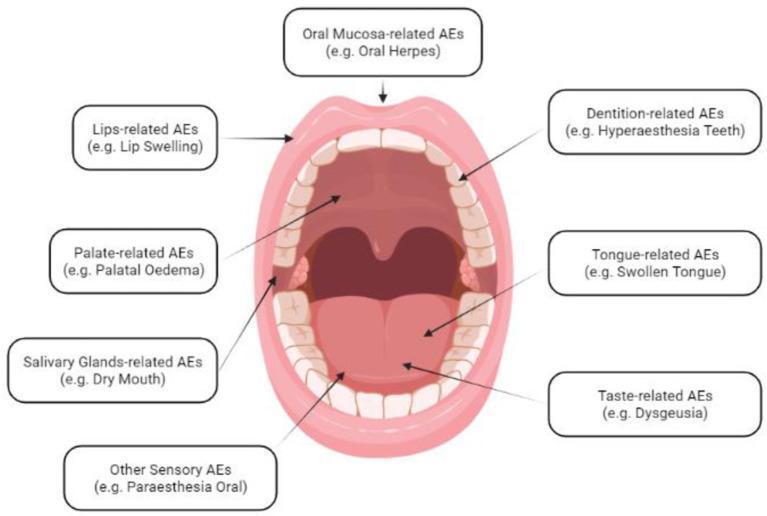
This medical anatomical diagram provides an anatomo-physiological scheme of Oral Adverse Events Following Immunization (AEFI). The central illustration is a simplified, frontal view of an open human oral cavity, featuring labels that categorize adverse events (AEs) by specific anatomical regions and functions. Key regions identified include the oral mucosa (linked to oral herpes), the lips (lip swelling), the palate (palatal oedema), the salivary glands (dry mouth), and the dentition (hyperaesthesia teeth). Additionally, the diagram highlights functional adverse events related to the tongue (swollen tongue), taste (dysgeusia), and other sensory modalities (oral paraesthesia). This educational visual serves as a de novo classification tool to help clinicians and researchers identify and categorize various vaccine-related oral symptoms that are otherwise dispersed across different levels of the MedDRA hierarchy. It is designed for medical professionals and students to facilitate systematic clinical assessment of oral health changes post-vaccination.
Classification of Antidiabetic Drugs
CLASS I: INSULIN
| Type | Examples | Onset | Peak | Duration | Use |
|---|---|---|---|---|---|
| Rapid-acting analogues | Lispro, Aspart, Glulisine | 5-15 min | 1-2 h | 3-5 h | Prandial (mealtime) |
| Short-acting (Regular) | Regular human insulin | 30-60 min | 2-4 h | 6-8 h | Prandial; IV infusions |
| Intermediate-acting | NPH (Isophane) | 1-4 h | 4-10 h | 12-18 h | Basal |
| Long-acting analogues | Glargine (U-100, U-300), Detemir | 1-2 h | Peakless | 20-24 h | Basal (once daily) |
| Ultra-long-acting | Degludec | 1 h | Peakless | >42 h | Basal (once daily) |
| Premixed | 70/30 NPH/Regular; 75/25 lispro protamine/lispro | - | - | - | Combined basal-bolus |
| Inhaled insulin | Technosphere insulin (Afrezza) | Rapid | ~30 min | ~3 h | Prandial |
- Basal only - background glucose control (fasting)
- Basal-bolus - physiologic replacement; most intensive
- Basal-plus - basal insulin + one prandial dose (transitional)
- Premixed - convenient but less flexible
CLASS II: NON-INSULIN ANTIDIABETIC AGENTS
1. Biguanides
- Drug: Metformin (first-line for T2DM)
- Mechanism: Activates AMPK → reduces hepatic gluconeogenesis; improves peripheral insulin sensitivity; decreases intestinal glucose absorption
- Key features: Does NOT cause hypoglycemia; weight neutral/modest weight loss; cardioprotective; cheap
- Caution: Hold in renal impairment (eGFR <30), contrast procedures, surgery
2. Sulfonylureas (SUs)
- 1st generation: Tolbutamide, Chlorpropamide, Tolazamide
- 2nd generation: Glibenclamide (Glyburide), Glipizide, Glimepiride, Gliclazide
- Mechanism: Bind SUR1 subunit of K-ATP channel on beta cells → channel closure → depolarization → Ca²⁺ influx → insulin secretion (glucose-independent)
- Key features: Effective HbA1c lowering; low cost
- Risks: Hypoglycemia (most important), weight gain; avoid in renal/hepatic impairment
3. Meglitinides (Glinides) - "Short-acting Secretagogues"
- Drugs: Repaglinide, Nateglinide
- Mechanism: Same K-ATP channel as SUs but bind different site; rapid, short action
- Key features: Taken with meals; target postprandial glucose; lower hypoglycemia risk than SUs
- Caution: Hepatic impairment; renal dose adjustment
4. Thiazolidinediones (TZDs / Glitazones)
- Drugs: Pioglitazone, Rosiglitazone (restricted use)
- Mechanism: Agonists of PPAR-gamma nuclear receptor → improve insulin sensitivity in adipose tissue, muscle, and liver (insulin sensitizers)
- Key features: Reduce insulin resistance; pioglitazone has favorable lipid profile; slow HbA1c lowering (weeks to months)
- Risks: Weight gain, fluid retention, heart failure exacerbation, increased fracture risk, bladder cancer risk (pioglitazone with long-term use)
5. Alpha-Glucosidase Inhibitors
- Drugs: Acarbose, Miglitol, Voglibose
- Mechanism: Competitively inhibit intestinal alpha-glucosidases → delay carbohydrate digestion and absorption → blunt postprandial glucose rise
- Key features: Target postprandial hyperglycemia; no hypoglycemia; weight neutral
- Adverse effects: Flatulence, diarrhea, abdominal bloating (limit compliance)
6. DPP-4 Inhibitors ("Gliptins")
- Drugs: Sitagliptin, Saxagliptin, Vildagliptin, Alogliptin, Linagliptin
- Mechanism: Inhibit dipeptidyl peptidase-4 enzyme → prevent degradation of endogenous GLP-1 and GIP → increased insulin secretion and decreased glucagon (glucose-dependent)
- Key features: No hypoglycemia; weight neutral; well tolerated; once daily
- Caution: Dose reduce in renal impairment (except linagliptin - hepatic elimination); risk of pancreatitis, heart failure (saxagliptin)
7. GLP-1 Receptor Agonists (Incretin Mimetics)
- Short-acting (meal-related): Exenatide (twice daily), Lixisenatide
- Long-acting (daily): Liraglutide, Albiglutide
- Once-weekly: Exenatide XR, Dulaglutide, Semaglutide (SC); Oral semaglutide (first oral GLP-1 RA)
- Mechanism: Mimic GLP-1 → glucose-dependent insulin secretion, glucagon suppression, delayed gastric emptying, central satiety
- Key features: Significant weight loss; proven cardiovascular benefit (liraglutide, semaglutide, dulaglutide); renal protection; low hypoglycemia risk
- Adverse effects: Nausea, vomiting (especially on initiation); pancreatitis; injection site reactions; contraindicated in personal/family history of medullary thyroid carcinoma
8. SGLT-2 Inhibitors (Gliflozins)
- Drugs: Empagliflozin, Dapagliflozin, Canagliflozin, Ertugliflozin
- Mechanism: Inhibit sodium-glucose co-transporter 2 (SGLT-2) in the proximal renal tubule → prevent glucose reabsorption → glucosuria (urinary glucose excretion ~70g/day)
- Key features: Weight loss; blood pressure reduction; proven cardiovascular benefit (empagliflozin, canagliflozin); renal protection; heart failure benefit (reduced hospitalizations)
- Adverse effects: Genital mycotic infections (UTI/yeast), DKA (euglycemic), Fournier's gangrene, lower limb amputation (canagliflozin), polyuria
- Avoid: eGFR <45 (glucose-lowering effect lost; some can continue for cardiac/renal benefit)
9. Amylin Analogues
- Drug: Pramlintide (injectable)
- Mechanism: Mimics amylin (co-secreted with insulin from beta cells) → slows gastric emptying, suppresses glucagon, reduces postprandial glucose
- Use: Add-on to mealtime insulin in T1DM and T2DM
- Adverse effects: Nausea, hypoglycemia (requires insulin dose reduction)
10. Dopamine Agonist
- Drug: Bromocriptine QR (quick-release formulation)
- Mechanism: Activates dopamine D2 receptors in hypothalamus → resets circadian neuroendocrine dysregulation → reduces insulin resistance
- Key features: Modest HbA1c lowering; cardiovascular safety signal; taken within 2 hours of waking
- Can be continued when basal insulin is added
11. Bile Acid Sequestrants
- Drug: Colesevelam
- Mechanism: Not fully understood - binds bile acids in gut → may reduce hepatic glucose production and alter incretin signaling
- Key features: Also lowers LDL; no hypoglycemia; useful in patients with both diabetes and dyslipidemia
- Adverse effects: Constipation, hypertriglyceridemia, drug interactions (reduces absorption of many drugs)
Summary Classification Table
| Class | Mechanism | Hypoglycemia | Weight Effect | CVD Benefit |
|---|---|---|---|---|
| Insulin | Direct insulin replacement | Yes (dose-dependent) | Gain | Neutral |
| Biguanides | ↓ hepatic glucose output, ↑ insulin sensitivity | No | Neutral/↓ | Cardioprotective |
| Sulfonylureas | ↑ insulin secretion (K-ATP blockade) | Yes | Gain | Neutral |
| Meglitinides | ↑ insulin secretion (rapid/short) | Low risk | Neutral/slight gain | Neutral |
| TZDs | PPAR-gamma agonism → insulin sensitizer | No | Gain | Mixed |
| Alpha-glucosidase inhibitors | ↓ carb absorption | No | Neutral | Neutral |
| DPP-4 inhibitors | ↑ endogenous GLP-1/GIP | No | Neutral | Neutral (some HF risk) |
| GLP-1 receptor agonists | Incretin mimicry | No | ↓↓ | Yes (liraglutide, semaglutide, dulaglutide) |
| SGLT-2 inhibitors | ↑ urinary glucose excretion | No | ↓ | Yes (empagliflozin, canagliflozin, dapagliflozin) |
| Amylin analogues | Amylin mimicry | Low (with insulin) | ↓ | Neutral |
| Dopamine agonists | CNS dopamine signaling | No | Neutral/↓ | Possible benefit |
| Bile acid sequestrants | Altered bile acid/incretin signaling | No | Neutral | LDL ↓ |
Clinical Priority (ADA/AACE)
- Metformin - universal first-line (unless contraindicated)
- Add GLP-1 RA or SGLT-2 inhibitor if:
- Established CVD or high CV risk → GLP-1 RA (liraglutide, semaglutide) or SGLT-2i
- Heart failure or CKD → SGLT-2 inhibitor preferred
- Weight loss needed → GLP-1 RA preferred
- Insulin - when A1C >8.5% with symptoms, or >9% regardless
- Textbook of Family Medicine, 9th Ed., Table 34-15
- Robbins, Cotran & Kumar Pathologic Basis of Disease, 10th Ed.
- Katzung's Basic and Clinical Pharmacology, 16th Ed.