
Extplain relation between cardiac output and right atrial pressure
The cardiac output (CO) and right atrial pressure (RAP) are linked through two key physiological curves: the cardiac function curve and the venous return curve. Their intersection determines the actual operating point of the cardiovascular system.
Searching sources...
Reading File
Finding Sources
Finding Sources
Reading File
Reading File
Reading File
Loading Image
Now let me fetch the Guyton diagram and also read more about how clinical changes shift these curves.
Loading Image
Loading Image
I now have everything needed for a thorough, well-illustrated answer. Let me compile the full explanation.
Cardiac Output and Right Atrial Pressure
The relationship between cardiac output (CO) and right atrial pressure (RAP) is one of the most foundational concepts in cardiovascular physiology. It is best understood through two curves that, when combined, govern the actual steady-state operation of the circulation.
Why RAP is the Bridge
RAP is the filling pressure of the right atrium. It determines:
- End-diastolic volume of the right (and indirectly left) ventricle
- Venous return - the pressure gradient driving blood back from the periphery to the heart
Because CO depends on end-diastolic volume (Frank-Starling law), and venous return depends on the RAP, both relationships converge on RAP as the common axis.
"Left ventricular end-diastolic volume depends on venous return, which also determines right atrial pressure. Thus there is not only a relationship between cardiac output and end-diastolic volume but also a relationship between cardiac output and right atrial pressure." - Costanzo Physiology, 7th Edition
1. The Cardiac Function Curve (CO vs. RAP)
This curve shows how the heart responds to changes in RAP:
- As RAP rises → end-diastolic volume increases → greater fiber stretch → stronger contraction (Frank-Starling) → CO increases
- The curve rises steeply at first, then plateaus at approximately RAP ~4 mm Hg, where CO reaches a maximum of ~9 L/min (the heart can no longer respond to further preload increases)
- CO is directly proportional to RAP (positive slope) on this curve
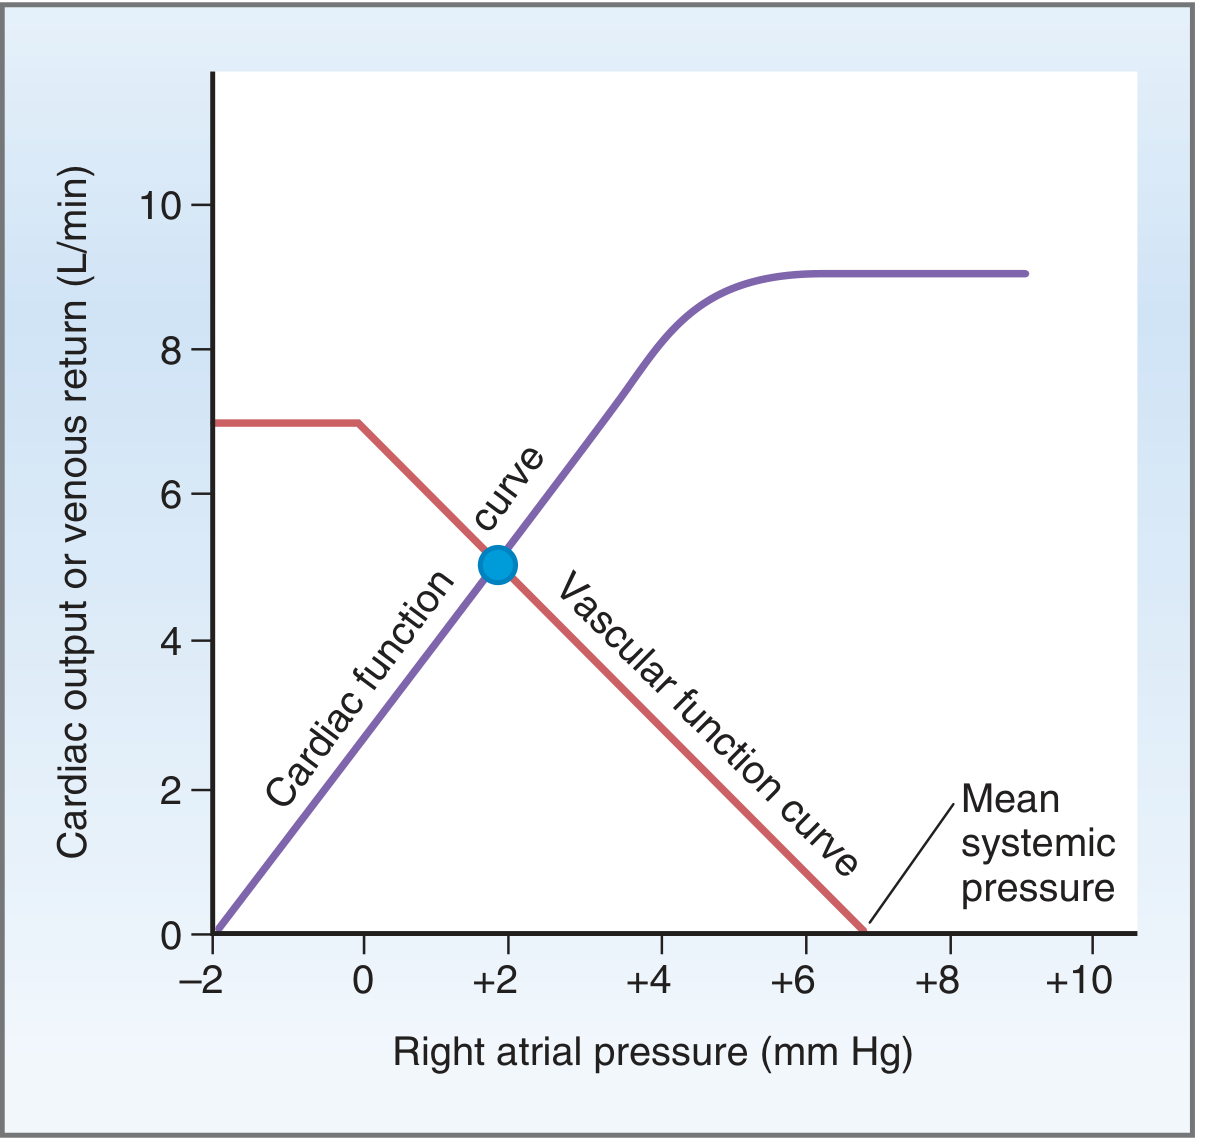
Cardiac function curve (purple, rising) and vascular function curve (red, falling) intersect at the steady-state operating point (blue circle), RAP ~+2 mm Hg, CO ~5 L/min. - Costanzo Physiology 7th Ed.
2. The Vascular Function Curve (Venous Return vs. RAP)
This curve shows how the peripheral vasculature responds to RAP:
- As RAP falls → pressure gradient between mean systemic filling pressure (Psf ~7 mm Hg) and the right atrium increases → venous return increases
- As RAP rises toward Psf → gradient narrows → venous return approaches zero
- Venous return is inversely proportional to RAP (negative slope)
- At very negative RAP values, veins collapse and venous return plateaus (the flat "knee" of the curve)
3. The Equilibrium Point - Where They Intersect
The cardiac and vascular curves have opposite relationships with RAP. This seeming paradox resolves at the single intersection point - the equilibrium (operating) point:
| Parameter | Normal value |
|---|---|
| Cardiac output | ~5 L/min |
| Venous return | ~5 L/min (equal to CO) |
| Right atrial pressure | ~0 mm Hg |
At this one RAP value, both the heart's demand and the vasculature's supply are simultaneously satisfied. CO always equals venous return in steady state.
"There is only one point on the graph, point A, at which the venous return equals the cardiac output and at which the right atrial pressure is the same for both the heart and systemic circulation." - Guyton and Hall Medical Physiology
4. How Clinical Changes Shift the System
The power of this framework is in predicting changes:
A. Increased Blood Volume (e.g., transfusion)
- Psf rises (e.g., from 7 to 16 mm Hg) → vascular curve shifts right
- New intersection (point B) = CO ~13 L/min, RAP ~+8 mm Hg
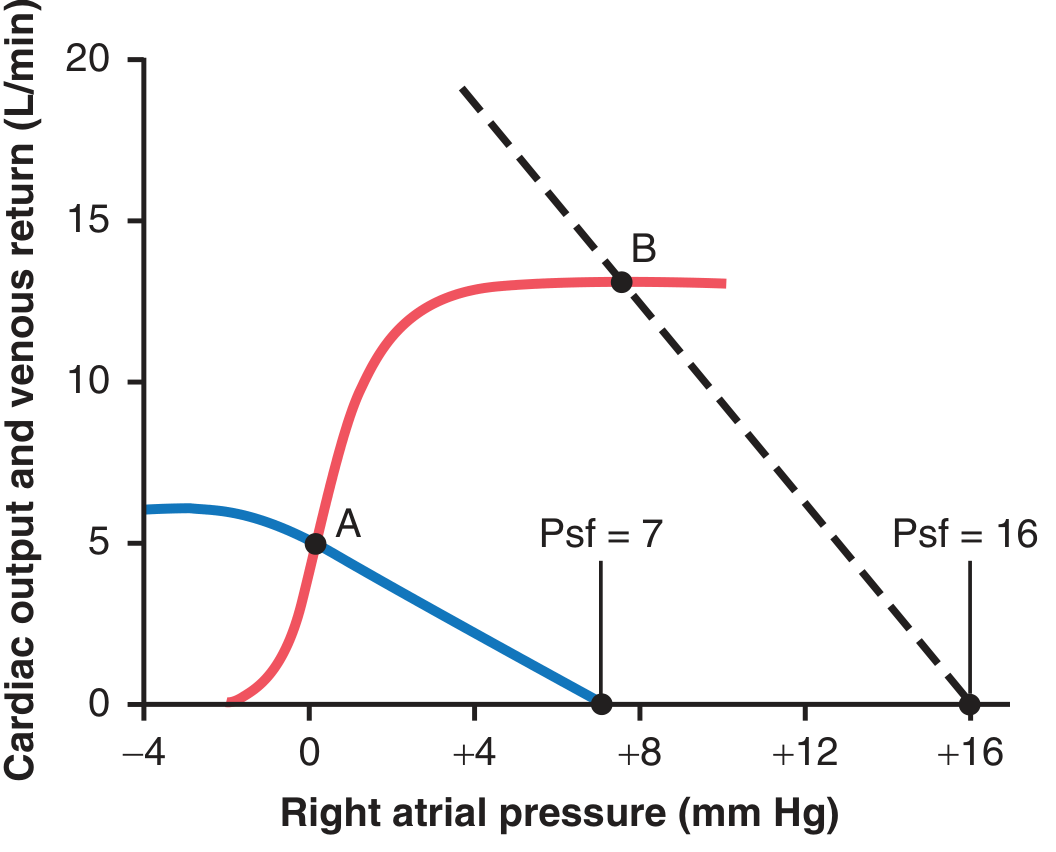
Transfusion of 20% blood volume shifts the venous return curve (dashed), moving the equilibrium from point A to point B - CO and RAP both rise. - Guyton & Hall
B. Heart Failure
- Failing heart has reduced contractility → cardiac function curve shifts downward
- At the same Psf, the new equilibrium has lower CO and higher RAP
- Compensatory fluid retention raises Psf, partially restoring CO (at the cost of even higher RAP and congestion)
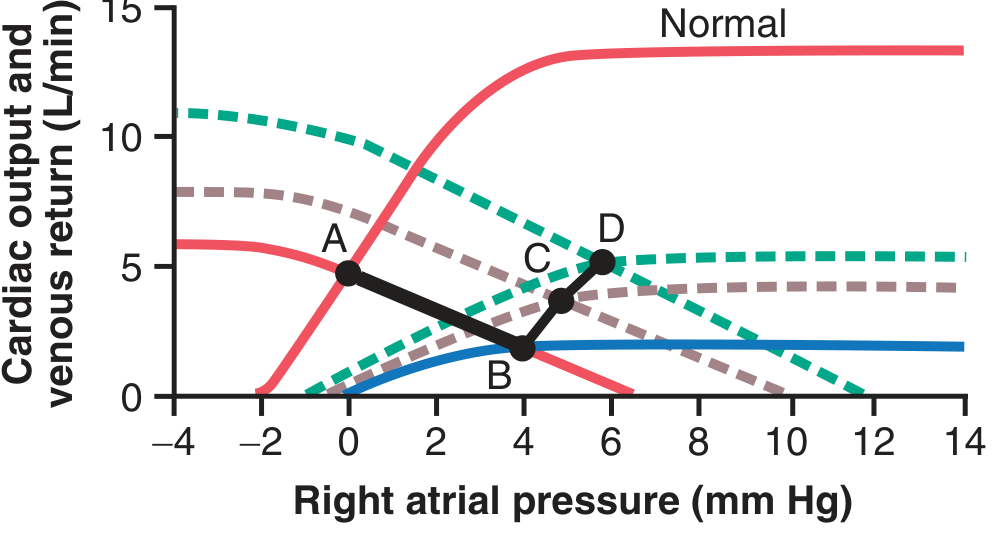
Progressive heart failure (points A→B→C→D): the depressed cardiac output curve intersects at lower CO and progressively higher RAP as the disease worsens. - Guyton & Hall
C. Positive Inotropes (e.g., digoxin, dobutamine)
- Increase contractility → cardiac function curve shifts upward
- New equilibrium: higher CO, lower RAP
D. Decreased Total Peripheral Resistance (e.g., exercise, sepsis)
- Blood flows more easily from arteries to veins → vascular curve rotates clockwise (increases at any RAP)
- New equilibrium: higher CO, slightly lower RAP
E. Hemorrhage/Hypovolemia
- Psf falls → vascular curve shifts left
- New equilibrium: lower CO, lower RAP
Summary Table
| Change | Cardiac Curve | Vascular Curve | Result (CO / RAP) |
|---|---|---|---|
| Positive inotrope | Shifts up | Unchanged | CO ↑ / RAP ↓ |
| Negative inotrope / HF | Shifts down | Unchanged | CO ↓ / RAP ↑ |
| Volume overload | Unchanged | Shifts right | CO ↑ / RAP ↑ |
| Hemorrhage | Unchanged | Shifts left | CO ↓ / RAP ↓ |
| ↓ TPR (vasodilation) | Unchanged | Rotates clockwise | CO ↑ / RAP slightly ↓ |
| ↑ TPR (vasoconstriction) | Unchanged | Rotates counterclockwise | CO ↓ / RAP slightly ↑ |
Key Takeaways
- The cardiac function curve shows CO rising with RAP (Frank-Starling).
- The vascular function curve shows venous return falling as RAP rises.
- Their intersection defines the operating point - the unique RAP where CO = venous return.
- In heart failure, the depressed cardiac curve intersects at high RAP and low CO - this is the physiological basis for congestion plus low output.
- RAP is both a consequence of venous return and a determinant of cardiac output, making it the central variable linking the heart and the periphery.
Sources: Costanzo Physiology 7th Ed., pp. 162-166; Guyton and Hall Textbook of Medical Physiology, pp. 259-262.
Explain relation between cardiac output and right atrial pressure
The relationship between cardiac output (CO) and right atrial pressure (RAP) is explained through two opposing curves - the cardiac function curve and the vascular function curve - whose intersection defines the steady-state operating point of the circulation.
Searching sources...
Finding Sources
Reading File
Loading Image
Reading File
Reading File
Reading File
Loading Image
Loading Image
I now have all the content needed for a thorough, textbook-backed explanation. Here is the full answer:
Relation Between Cardiac Output and Right Atrial Pressure
Why RAP is the Central Variable
Right atrial pressure (RAP) is the filling pressure of the right atrium. It reflects the volume of blood returning to the heart (venous return) and, via its effect on end-diastolic volume, determines how hard the ventricles contract (Frank-Starling law). This makes RAP the single variable that links the heart's pumping capacity to the peripheral circulation.
"Left ventricular end-diastolic volume depends on venous return, which also determines right atrial pressure. Thus there is not only a relationship between cardiac output and end-diastolic volume but also a relationship between cardiac output and right atrial pressure." - Costanzo Physiology, 7th Ed.
The Two Curves
Both the heart and the vasculature have independent relationships with RAP, and these are represented as two separate curves plotted on the same axes.
1. Cardiac Function Curve (CO rises with RAP)
This curve represents how the heart responds to changes in RAP:
- RAP rises → venous return increases → right atrial filling increases → end-diastolic volume and fiber stretch increase → stronger contraction (Frank-Starling) → CO increases
- The curve has a positive slope - CO is directly proportional to RAP
- Above ~4 mm Hg, the heart reaches its maximum output (~9 L/min) and the curve plateaus - the Frank-Starling mechanism is saturated
2. Vascular Function Curve (Venous Return falls with RAP)
This curve represents how the peripheral vasculature responds to RAP:
- Venous return is driven by the pressure gradient: Mean Systemic Pressure (Psf ~7 mm Hg) minus RAP
- As RAP rises → gradient narrows → venous return falls (negative slope)
- When RAP equals Psf, venous return = 0 (the x-intercept of the curve)
- At very negative RAP values, the veins collapse and venous return plateaus at a maximum - this is the flat "knee" at the top-left of the curve
3. The Equilibrium Point - Where They Intersect
Fig. 4.26 from Costanzo Physiology 7th Ed. - Cardiac function curve (purple, rising) and vascular function curve (red, falling). The blue dot marks the equilibrium operating point.
The two curves slope in opposite directions but must intersect at one unique point. This intersection is the steady-state equilibrium where:
| Parameter | Normal value |
|---|---|
| Cardiac output | ~5 L/min |
| Venous return | ~5 L/min (always equal to CO) |
| Right atrial pressure | ~0 mm Hg |
"There is only one point on the graph, point A, at which venous return equals cardiac output and at which the right atrial pressure is the same for both the heart and systemic circulation." - Guyton and Hall Medical Physiology
This resolves the apparent paradox: the curves go in opposite directions, yet CO always equals venous return - because they are only equal at that one RAP value where both are simultaneously satisfied.
How Clinical Changes Shift the System
The real value of this framework is predicting what happens when physiology changes. Any disturbance moves the equilibrium point to a new CO and RAP.
A. Increased Blood Volume (e.g., transfusion, fluid overload)
- More blood fills the stressed vasculature → Psf rises (e.g., 7 to 16 mm Hg)
- Vascular function curve shifts right
- New equilibrium: CO rises, RAP rises
Figure 20.15 from Guyton & Hall - 20% blood volume transfusion (dashed curve) shifts equilibrium from point A to point B.
B. Hemorrhage / Hypovolemia
- Psf falls → vascular function curve shifts left
- New equilibrium: CO falls, RAP falls
C. Positive Inotrope (e.g., digoxin, dobutamine)
- Contractility increases → cardiac function curve shifts upward
- For the same RAP, more blood is ejected → RAP actually falls as the heart empties better
- New equilibrium: CO rises, RAP falls
D. Negative Inotrope / Heart Failure
- Contractility falls → cardiac function curve shifts downward
- Heart cannot keep up → blood dams back into the venous system
- New equilibrium: CO falls, RAP rises (the basis for congestion)
Figure 22.5 from Guyton & Hall - Progressive heart failure showing A (normal) → B (acute failure, low CO, rising RAP) → C and D (partial compensation)
E. Vasodilation (decreased TPR, e.g., exercise, sepsis)
- Arteriolar resistance falls → blood flows more easily to the venous side → vascular curve rotates clockwise (higher venous return at any RAP)
- Also slightly lowers ventricular afterload, improving CO
- New equilibrium: CO rises, RAP slightly falls
F. Venoconstriction
- Venous compliance decreases → blood shifts from unstressed (venous) to stressed (arterial) volume → Psf rises → vascular curve shifts right
- New equilibrium: CO rises, RAP rises
Summary Table
| Condition | Cardiac Curve | Vascular Curve | CO | RAP |
|---|---|---|---|---|
| Positive inotrope | Shifts up | Unchanged | ↑ | ↓ |
| Heart failure / negative inotrope | Shifts down | Unchanged | ↓ | ↑ |
| Volume overload / transfusion | Unchanged | Shifts right | ↑ | ↑ |
| Hemorrhage | Unchanged | Shifts left | ↓ | ↓ |
| Vasodilation / ↓ TPR | Unchanged | Rotates clockwise | ↑ | ↓ (slight) |
| Venoconstriction | Unchanged | Shifts right | ↑ | ↑ |
Key Takeaway
RAP acts as the "hinge" variable between the heart and the vasculature:
- The heart "wants" high RAP - more filling, more output (Frank-Starling)
- The vasculature "wants" low RAP - lower back-pressure means more venous return
- The system settles at the one RAP where both demands are simultaneously satisfied - the equilibrium point
This framework, originally developed by Guyton, is the physiological foundation for understanding states like heart failure (low CO + high RAP = congestion), hemorrhagic shock (low CO + low RAP), and the response to inotropes and fluids.
Sources: Costanzo Physiology 7th Ed., pp. 162-166; Guyton and Hall Textbook of Medical Physiology, pp. 258-262.
This is a shared conversation. Sign in to Orris to start your own chat.