
*Enumerate methods of assessing nutritional status of a community. How will you assess the nutritional status of preschool children by using anthropometric measurements I want this essay question answer for university exams of spm subject from standard textbook include the flowcharts and diagrams and tables where ever needed and how to present it in the exam In which part of the chapter it is there. And page numbers
Reading File
Now let me search the library for this topic - nutritional status assessment and anthropometric measurements for preschool children.
Finding Sources
Finding Sources
Finding Sources
Park's Textbook of Preventive and Social Medicine is the standard SPM textbook. Let me search for the nutrition chapter content.
Finding Sources
Finding Sources
Excellent! Found the key sections. Now let me read all the relevant content in parallel.
Reading File
Reading File
Excellent content found. Now let me read the detailed sections on each assessment method and anthropometry specifically.
Reading File
Now let me read the anthropometry chapter (Chapter 11) for the detailed preschool children section.
Finding Sources
Reading File
Let me search for the Chapter 11 anthropometry content in the blocks.
Finding Sources
Finding Sources
Reading File
Finding Sources
Found detailed anthropometry section in block6. Let me read those key sections now.
Reading File
Reading File
Now let me read the block8 section on growth monitoring (Chapter on Child Health) for detailed anthropometry in preschool children.
Reading File
Reading File
Now let me fetch the key flowchart image from the textbook.
Loading Image
Reading File
Excellent! I now have all the content I need. Let me also fetch the ICDS growth chart image.
Loading Image
I now have all the content needed. Let me compile the comprehensive exam answer.
ASSESSMENT OF NUTRITIONAL STATUS OF A COMMUNITY & ANTHROPOMETRIC ASSESSMENT OF PRESCHOOL CHILDREN
Source: Park's Textbook of Preventive and Social Medicine (SPM) - Chapter on Nutrition
Chapter Location: Chapter 11 - Nutrition, Section: "Assessment of Nutritional Status" (Pages 743-748) and Annexure I (Page 759)
HOW TO PRESENT THIS IN THE EXAM
Marks allocation: This is a 10-15 mark long essay question.
Ideal structure:
- Introduction (2-3 lines)
- Part 1 - Methods of assessment with a numbered list + brief description of each
- Flowchart from Park's (copy into answer)
- Part 2 - Anthropometry in preschool children in detail
- Classification tables
- Conclusion (2-3 lines)
INTRODUCTION
The nutritional status of an individual is the result of many interrelated factors - adequacy of food intake in terms of quality and quantity, and physical health of the individual. The nutritional status of a community is the sum total of nutritional status of the individuals forming that community. A comprehensive nutritional survey aims to:
- Obtain information on prevalence and geographic distribution of nutritional problems
- Identify individuals/population groups "at risk" or in greatest need
- Develop health care programmes based on assessment findings
Park's, p. 743
PART 1: METHODS OF ASSESSING NUTRITIONAL STATUS OF A COMMUNITY
The different methods are not mutually exclusive - they are complementary to each other. They cover all stages in the natural history of nutritional disease.
FLOWCHART: Methods of Nutritional Assessment and Their Relationship to Natural History of Disease
(Fig. 5, Park's p. 744)
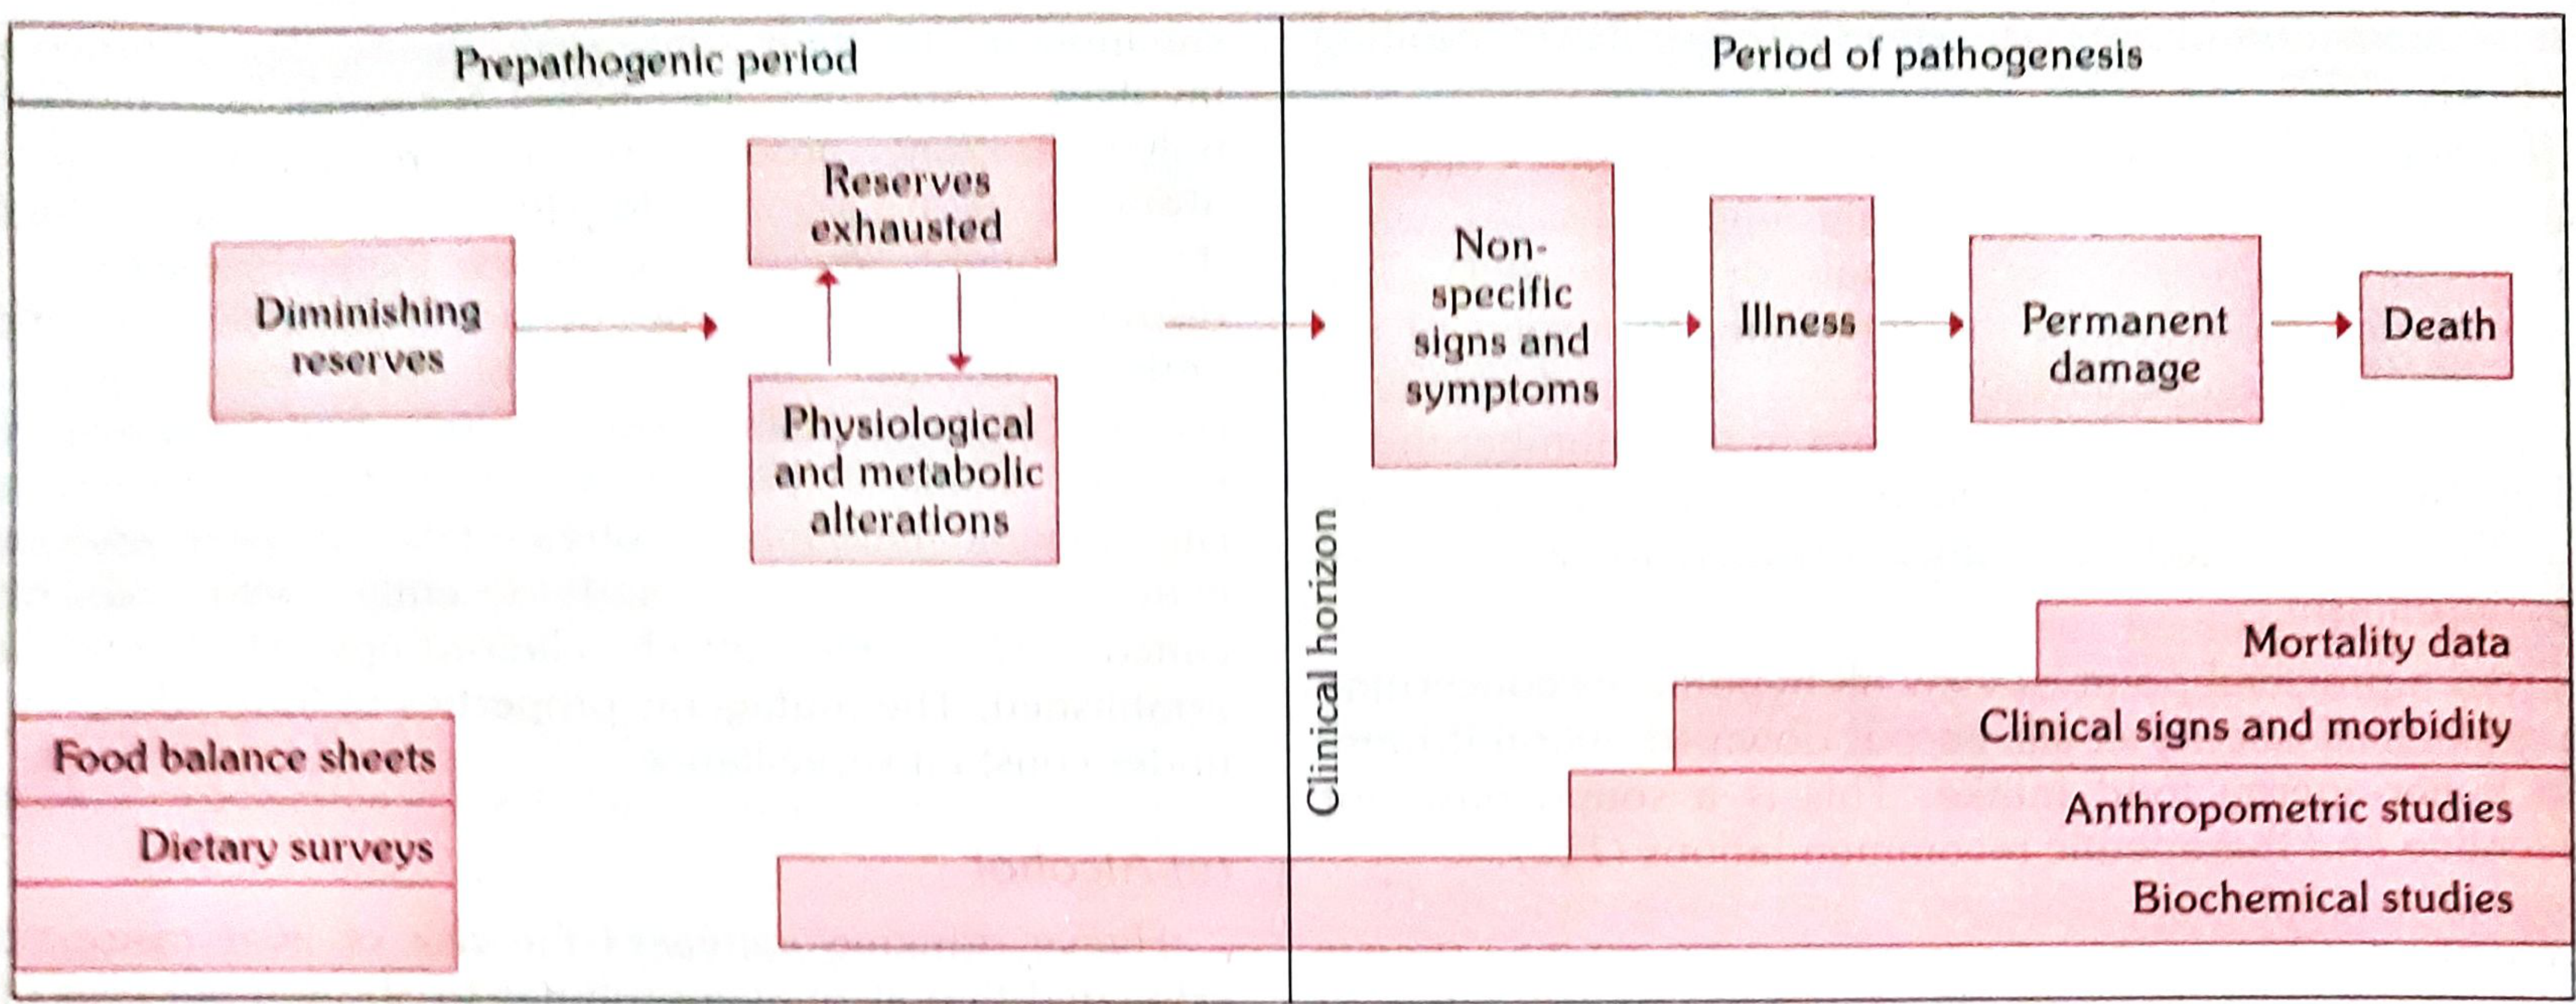
The 7 methods are:
1. CLINICAL EXAMINATION (p. 744)
- Simplest and most practical method
- Assesses physical signs associated with malnutrition
- WHO classified clinical signs into 3 categories:
| Category | Examples |
|---|---|
| Not related to nutrition | Alopecia, pyorrhoea, pterygium |
| Need further investigation | Malar pigmentation, corneal vascularization, geographic tongue |
| Known to be of value | Angular stomatitis, Bitot's spots, calf tenderness, absent knee jerks (beri-beri), thyroid enlargement (goitre) |
Drawbacks of clinical signs:
- Malnutrition cannot be quantified on clinical signs alone
- Many deficiencies are unaccompanied by physical signs
- Lack of specificity and subjective nature
2. ANTHROPOMETRY (p. 744)
- Height, weight, skinfold thickness, arm circumference
- In young children: head circumference and chest circumference also measured
- Can be collected by non-medical personnel after training
- (Discussed in detail in Part 2 below)
3. LABORATORY AND BIOCHEMICAL ASSESSMENT (p. 744-745)
(a) Laboratory Tests:
- Haemoglobin estimation - most important test; useful index of overall nutrition
- RBC count and haematocrit
- Stool examination - intestinal parasites
- Urine - albumin, sugar
(b) Biochemical Tests:
| Nutrient | Method | Normal Value |
|---|---|---|
| Vitamin A | Serum retinol | 20 mcg/dl |
| Thiamine | TPP stimulation of RBC transketolase | 1.00-1.23 (ratio) |
| Riboflavin | RBC glutathione reductase activity | 1.0-1.2 (ratio) |
| Folate | Serum folate | 6.0 mcg/ml |
| Vitamin B12 | Serum B12 | 160 mg/L |
| Protein | Serum albumin | 35 g/L |
(Table 33, Park's p. 745)
Note: Biochemical tests are time-consuming and expensive; cannot be applied on a large scale. Done on a subsample. Most reveal only current nutritional status.
4. FUNCTIONAL INDICATORS (p. 745)
Emerging as important diagnostic tools. Examples:
| System | Nutrients assessed |
|---|---|
| Structural integrity - Erythrocyte fragility | Vitamin E, Selenium |
| Capillary fragility | Vitamin C |
| Immune function - Lymphocyte count | Protein, Zinc |
| Muscle function - Grip strength | Protein-energy |
| Work capacity - VO2 max | Iron |
| Cognitive function | Iodine, Iron |
(Table 34, Park's p. 745)
5. ASSESSMENT OF DIETARY INTAKE (p. 745)
Methods of dietary survey:
| Method | Description |
|---|---|
| Weighment of raw foods | Most common in India; survey team visits households, weighs all food; duration 7 days (one dietary cycle) |
| Weighment of cooked foods | Foods analyzed as normally consumed; not easily acceptable |
| Oral questionnaire (24-hour recall) | Retrospective inquiry on food eaten in previous 24-48 hours; useful for large populations |
Data collected is expressed as:
- Mean intake (grams) of food groups
- Mean intake of nutrients per "consumption unit"
- Reference: ICMR publication "Nutritive Value of Indian Foods"
6. VITAL AND HEALTH STATISTICS (p. 746)
Analysis of mortality and morbidity data to identify high-risk groups.
- Mortality in age group 1-4 years is particularly related to malnutrition
- In developing countries, this may be 20 times that in developed countries
Rates used as nutritional indices:
- Infant mortality rate (IMR)
- Second-year mortality rate
- Rate of low birth-weight babies
- Life expectancy
- Morbidity data: PEM, anaemia, xerophthalmia, endemic goitre, diarrhoea
7. ECOLOGICAL STUDIES / ASSESSMENT OF ECOLOGICAL FACTORS (p. 746)
Ecological diagnosis of factors influencing nutrition in the community:
| Factor | Details |
|---|---|
| Food Balance Sheet | Indirect method; relates food supplies to census population to derive per capita supply; cheaper but conceals regional differences |
| Socio-economic factors | Family size, occupation, income, education, cultural feeding practices |
| Health and educational services | PHC services, feeding programmes, immunization |
| Conditioning influences | Parasitic, bacterial, viral infections that precipitate malnutrition |
PART 2: ASSESSMENT OF NUTRITIONAL STATUS OF PRESCHOOL CHILDREN BY ANTHROPOMETRIC MEASUREMENTS
Definition: Preschool children = children between 1-4 years of age (toddlers).
They represent ~9.7% of India's population and are a high-risk group for malnutrition.
Park's, p. 637-638
ANTHROPOMETRIC MEASUREMENTS USED IN PRESCHOOL CHILDREN
ANTHROPOMETRIC MEASUREMENTS IN PRESCHOOL CHILDREN
├── 1. Weight
├── 2. Height / Length
├── 3. Mid-Upper Arm Circumference (MUAC)
├── 4. Head Circumference
├── 5. Chest Circumference
└── 6. Skinfold Thickness
INDICES DERIVED FROM MEASUREMENTS
Three key indices used for nutritional assessment:
| Index | What it detects | When used |
|---|---|---|
| Weight-for-Age | Underweight (past + present malnutrition combined) | When age is KNOWN |
| Height-for-Age | Stunting (chronic/past malnutrition) | When age is KNOWN |
| Weight-for-Height | Wasting (acute/current malnutrition) | When age is UNKNOWN |
INDICATORS BY POPULATION GROUP (Table 36, Park's p. 747)
| Phenomenon | Indicator Used |
|---|---|
| Maternal nutrition | Birth weight |
| Infant and preschool child nutrition | Proportion breastfed and on weaning foods (by age in months) |
| Mortality rates in children aged 1,2,3,4 years (emphasis on 2-year-olds) | |
| If age known: Height-for-age; Weight-for-age | |
| If age unknown: Weight-for-height; Arm circumference; Clinical signs | |
| School child nutrition | Height-for-age and weight-for-height at 7 years or school admission; clinical signs |
CLASSIFICATION OF MALNUTRITION (Gomez Classification)
The most widely used classification for weight-for-age in children is:
| Grade | Weight as % of standard (50th percentile) |
|---|---|
| Normal | >90% |
| Grade I (Mild) | 75-90% |
| Grade II (Moderate) | 60-74% |
| Grade III (Severe) | <60% |
MID-UPPER ARM CIRCUMFERENCE (MUAC)
Particularly useful when age is unknown (common in developing countries). It is independent of age between 1-5 years.
| MUAC (cm) | Nutritional Status |
|---|---|
| >13.5 cm | Normal (Green zone) |
| 12.5-13.5 cm | At risk (Yellow zone) |
| <12.5 cm | Malnourished (Red zone) |
Advantage: Simple, quick, needs only a tape measure, can be done by paramedical staff.
GROWTH MONITORING AND GROWTH CHART
The Road-to-Health Card (growth chart) is described as "a passport to child health care" and is a standard method of monitoring children's nutritional status.
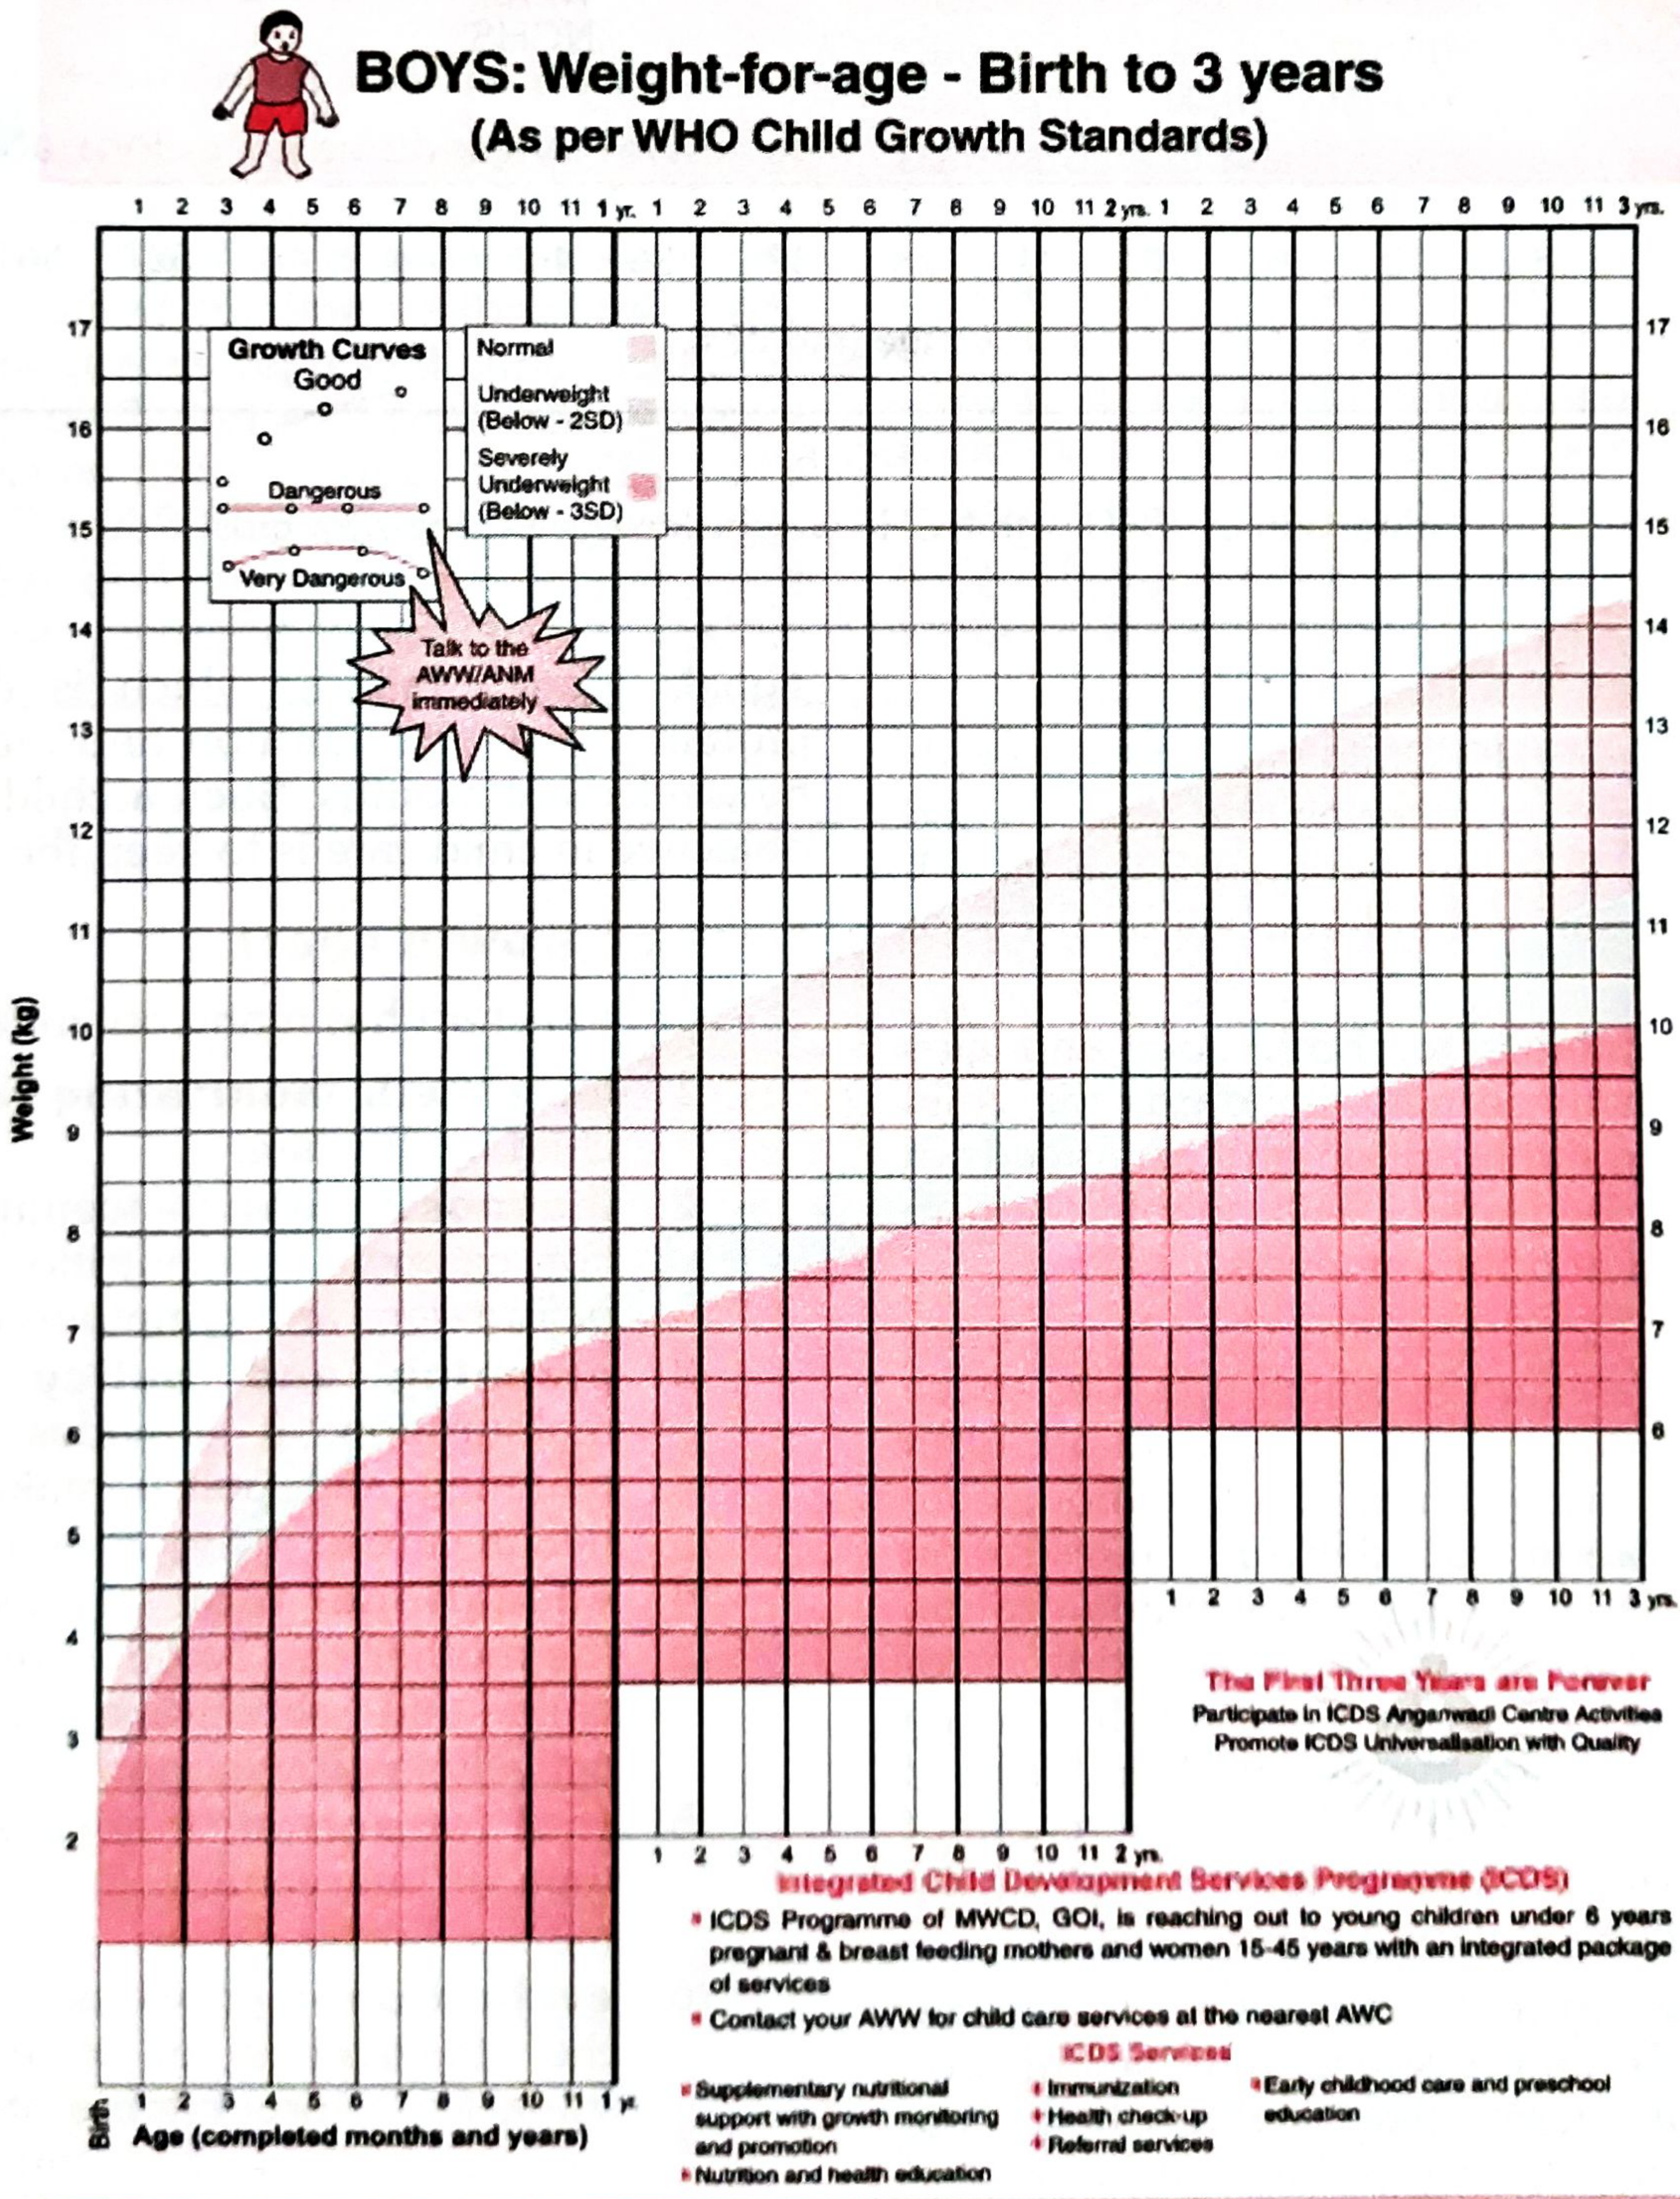
(ICDS Growth Chart as per WHO Child Growth Standards - Fig. 7, Park's p. 638)
How to interpret: Plot weight monthly. A child whose weight curve:
- Rises parallel to reference = growing well (Good/Normal)
- Flattens = growth faltering (early warning)
- Falls = danger (Underweight / Severely underweight below -2SD/-3SD)
NUTRITIONAL SURVEILLANCE vs GROWTH MONITORING
(Table 35, Park's p. 747)
| Factor | Growth Monitoring | Nutritional Surveillance |
|---|---|---|
| Strategy | Preservation of normal growth | Detection of undernutrition |
| Approach | Education and support | Epidemiological data collection |
| Target | Individual child | Community/population sample |
| Frequency | Monthly (from <6 months age) | Periodic representative sampling |
| Use | Track individual child's health | Compare villages; detect deterioration |
ALTERNATIVE ANTHROPOMETRIC METHODS
(Park's p. 638)
- Height-for-age - reflects chronic/long-term nutritional status; detects stunting
- Weight-for-height - reflects acute nutritional status; detects wasting; independent of age (very useful when age unknown)
- Arm circumference - independent of age, simple, does not require weighing scale
EXAMINATION ANSWER STRATEGY
How to present this question in the exam:
- Write a 2-line intro about what nutritional status means and what a nutritional survey aims to achieve
- Draw Fig. 5 (the flowchart) - this earns extra marks - it shows methods along the natural history of disease
- List and describe all 7 methods using headers - examiners look for all 7 points
- For Part 2, use the heading "Anthropometric Assessment of Preschool Children"
- Include the MUAC table and Gomez classification table - these are frequently asked
- Mention the Growth Chart and ideally draw a small sketch of it
- Mention indicators table (if age known vs unknown)
- End with a brief note on growth monitoring vs nutritional surveillance
CHAPTER LOCATION IN PARK'S
| Topic | Chapter | Pages |
|---|---|---|
| Assessment of Nutritional Status (all 7 methods) | Chapter 11 - Nutrition | Pages 743-746 |
| Nutritional Surveillance | Chapter 11 - Nutrition | Page 747 |
| Nutritional Status Indicators (Table 36) | Chapter 11 - Nutrition | Page 747 |
| Growth Monitoring and Growth Chart | Chapter 12 - Child Health | Pages 637-638 |
| Fig. 5 (Natural History Flowchart) | Chapter 11 - Nutrition | Page 744 |
| Anthropometric Assessment Schedule (Annexure I) | Chapter 11 - Nutrition | Page 759 |
| BMI classification (adults) | Chapter 11 - Nutrition | Page (block 6 - Obesity section) |
SUMMARY FLOWCHART TO DRAW IN EXAM
METHODS OF ASSESSING NUTRITIONAL STATUS
              |
    ┌─────────┴──────────┐
    |                    |
DIRECT METHODS     INDIRECT METHODS
    |                    |
    ├─ 1. Clinical        ├─ 6. Vital statistics
    |    examination      |   (mortality/morbidity)
    |                    |
    ├─ 2. Anthropometry  └─ 7. Ecological studies
    |   (height, weight,       (food balance sheets,
    |    MUAC, skinfold)       socioeconomic factors)
    |
    ├─ 3. Biochemical
    |   (Hb, serum
    |    nutrients)
    |
    ├─ 4. Functional
    |   indicators
    |
    └─ 5. Dietary intake
         (weighment,
          24-hr recall)
Source: All content above is directly from Park's Textbook of Preventive and Social Medicine (the standard SPM textbook for MBBS and community medicine exams), Chapter 11 (Nutrition), pp. 743-748, and Chapter 12 (Child Health), pp. 637-638, with Annexure I at p. 759.
This is a shared conversation. Sign in to Orris to start your own chat.