
All about dexa scan - function, principal, machine,it's parts , how it works, principal of dexa machine, use , radiology aspect,bmd, techniques, interpretation, other use of dexa fat percentage,other information that dexa scan provide, all about dexa , include more images also--
DEXA scan machine dual energy x-ray absorptiometry bone density
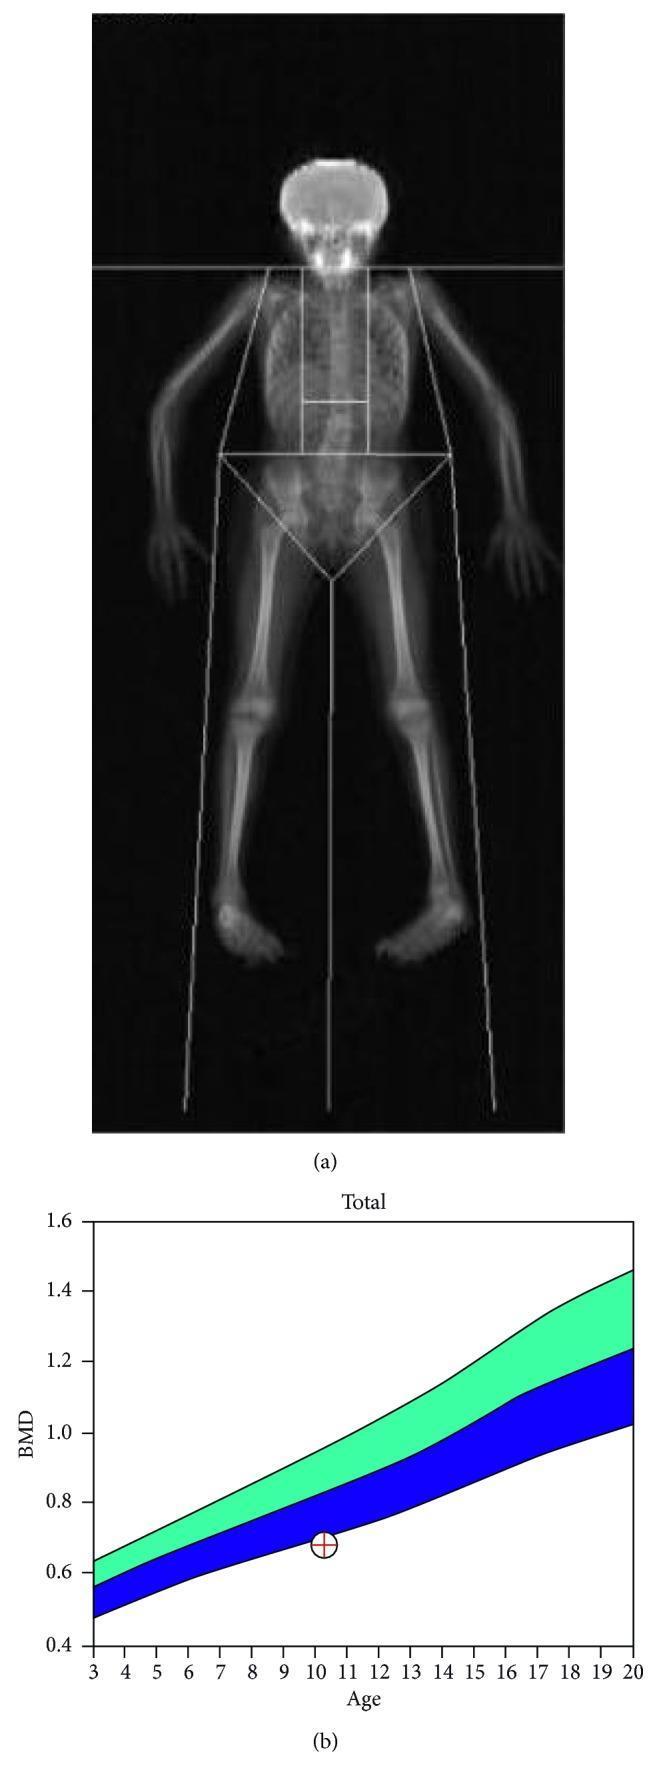
This dual-energy X-ray absorptiometry (DEXA) scan report includes a whole-body skeletal image and a corresponding bone mineral density (BMD) graph. (a) The clinical image displays a full-body scan of a pediatric patient in the anterior-posterior view, with white geometric boundaries delineating standard regions of interest for density measurement, including the head, trunk, and extremities. The bones are visualized in grayscale, where varying intensities correspond to mineral content. (b) The lower panel presents a quantitative BMD graph for total body evaluation. The x-axis represents age (3–20 years) and the y-axis represents BMD (g/cm²). Color-coded percentile bands (green and blue) denote the age-matched reference range for a healthy population. A specific data point, marked by a crosshair at approximately age 11, sits significantly below the expected mean, correlating with a Z-score of -2.4. This diagnostic finding is characteristic of secondary osteoporosis, potentially related to chronic corticosteroid use or systemic conditions such as psoriasis. This educational material is suitable for understanding bone densitometry interpretation and pediatric metabolic bone disease.
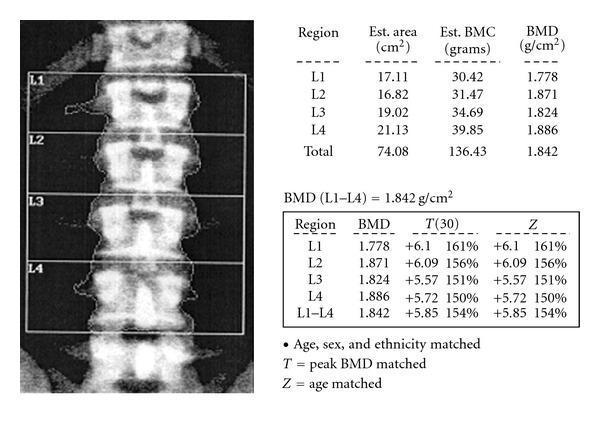
This diagnostic image and data summary illustrate a Dual-energy X-ray Absorptiometry (DEXA) scan of the lumbar spine (L1-L4) used for bone mineral density (BMD) assessment. The visual component features a posterior-anterior (PA) view of the lumbar vertebrae, where each vertebral body (L1, L2, L3, L4) is segmented and delineated by rectangular regions of interest (ROI). Accompanying tables provide quantitative data including estimated area (cm²), Bone Mineral Content (BMC in grams), and BMD (g/cm²). The total BMD for L1-L4 is reported as 1.842 g/cm², with significantly elevated T-scores and Z-scores reaching +5.85. This clinical finding indicates abnormally high bone density, which is essential for diagnosing conditions like osteopetrosis or sclerosing bone dysplasias in endocrinology and orthopedics. The educational focus is on the interpretation of DEXA scan outputs and the recognition of supra-normal bone density values.
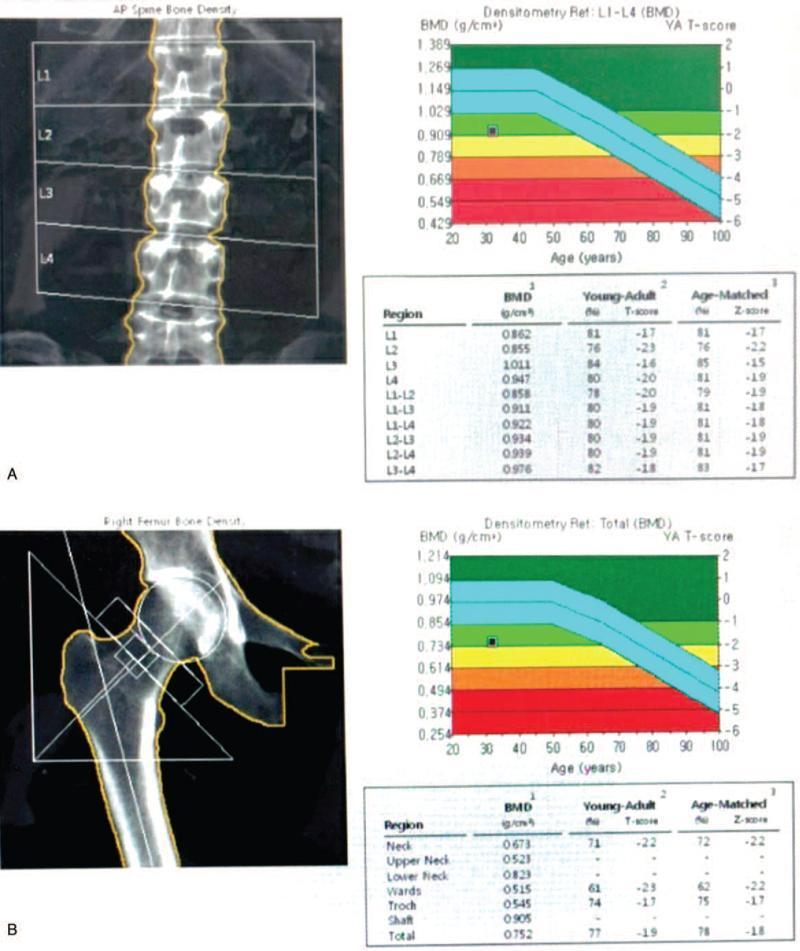
This diagnostic visual presents the results of a Dual-Energy X-ray Absorptiometry (DEXA) scan used for assessing bone mineral density (BMD) in the lumbar spine and femur. Section A depicts the Anteroposterior (AP) spine bone density for L1–L4, showing segmented vertebrae with corresponding BMD measurements (g/cm²), T-scores, and Z-scores in a tabular format. A reference graph plots the patient’s BMD against age-matched norms, using color-coded zones to categorize bone health (e.g., green for normal, yellow for osteopenia, and red for osteoporosis). Section B shows a similar analysis for the right proximal femur, highlighting the femoral neck, Ward’s triangle, and trochanter. Overlaid geometric regions on the femoral radiograph indicate the specific areas of interest for measurement. This content serves as a clinical assessment tool in endocrinology and orthopedics for diagnosing conditions like osteoporosis or monitoring treatment response in patients with metabolic bone disease.
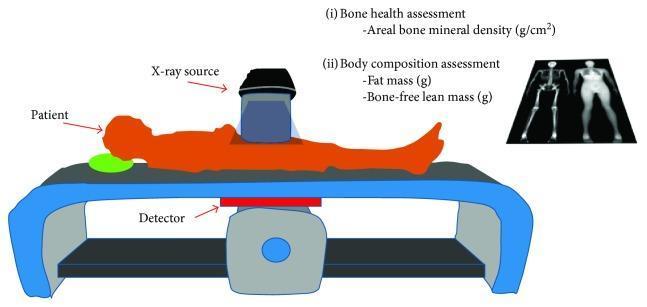
This medical illustration depicts a Dual-Energy X-ray Absorptiometry (DEXA) scanner setup and its clinical applications. The central diagram shows a patient in the supine position on a scanning table. Key instrumental components are identified: an X-ray source positioned above the patient and a detector located directly beneath the table, illustrating the transmission of X-ray beams through the body. Textual annotations outline the dual utility of the modality: (i) Bone health assessment, which measures areal bone mineral density (g/cm²), and (ii) Body composition assessment, which quantifies fat mass (g) and bone-free lean mass (g). To the right, representative diagnostic images from a DEXA scan are displayed, including a skeletal view and a soft tissue body composition map. This visual serves as an educational summary of how DEXA scans utilize high- and low-energy X-ray beams to accurately differentiate and measure various body tissues for metabolic and musculoskeletal health evaluations.
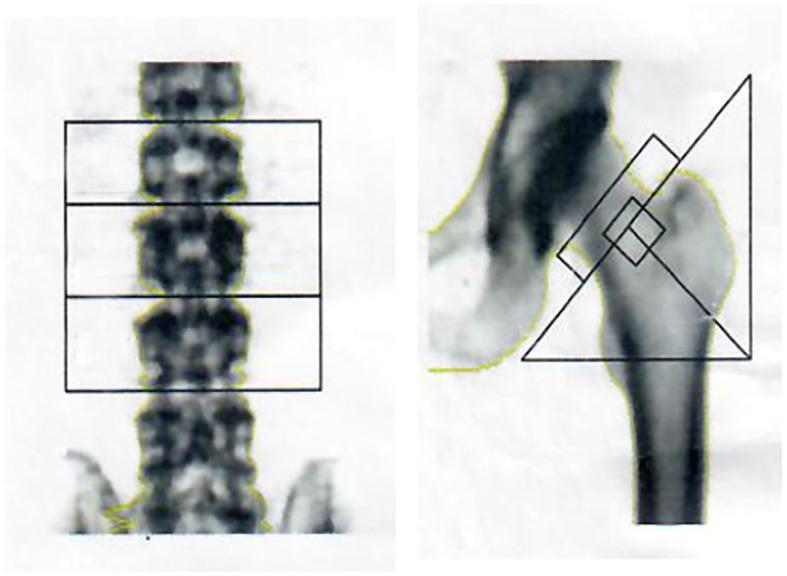
This diagnostic image displays dual-energy X-ray absorptiometry (DEXA) scans used for Bone Mineral Density (BMD) assessment. The visual is divided into two clinical views: an anteroposterior (AP) view of the lumbar spine and a proximal femur scan. In the lumbar spine image, horizontal rectangular Regions of Interest (ROIs) are demarcated over the L2, L3, and L4 vertebrae to calculate specific density values. The right image shows the proximal hip, featuring geometric overlays that isolate the femoral neck, Ward's triangle, and the greater trochanter for analysis. These scans are critical in diagnosing metabolic bone diseases such as osteopenia, osteoporosis, or osteomalacia, which in this clinical context relates to drug-induced renal impairment and hypophosphatemia. The grayscale variations within the skeletal structures represent the relative mineral density, where higher-density cortical bone appears darker compared to more lucent trabecular areas.
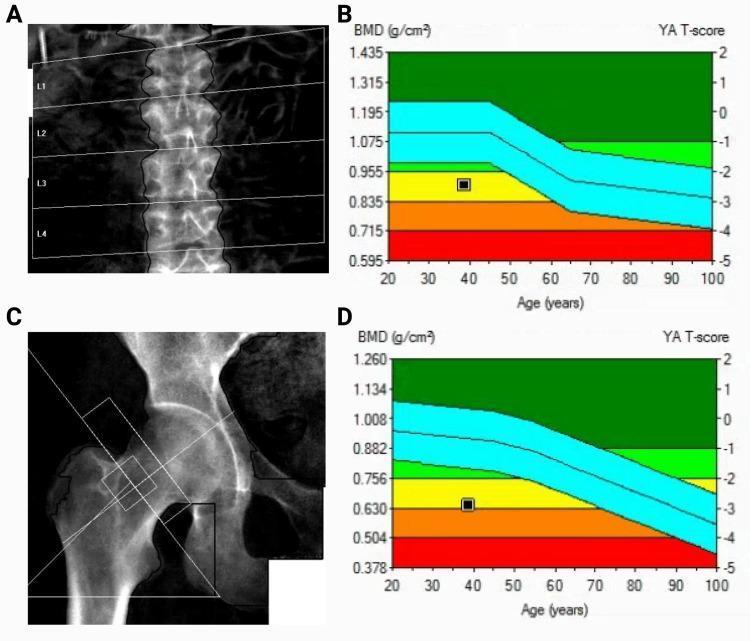
A multi-panel figure illustrating a Dual-Energy X-ray Absorptiometry (DEXA) scan. Panel A displays a clinical X-ray of the lumbar spine (L1-L4) with segmented ROI (Region of Interest) boxes and vertebral outlines. Panel C shows an X-ray of the proximal femur, including the femoral neck and total hip, with standardized geometric boxes positioned for density measurement. Panels B and D provide the corresponding densitometry plots for the spine and hip, respectively. The graphs plot Bone Mineral Density (BMD in g/cm²) on the left y-axis against age in years on the x-axis, with Young Adult (YA) T-scores on the right y-axis. The plots feature a color-coded reference range: green (normal, T-score > -1), yellow (osteopenia, T-score -1 to -2.5), and red (osteoporosis, T-score < -2.5). In both graphs, a black square marker indicates the patient's data point, situated within the yellow/orange transition zone, signifying low bone mineral density and clinically significant osteopenia.
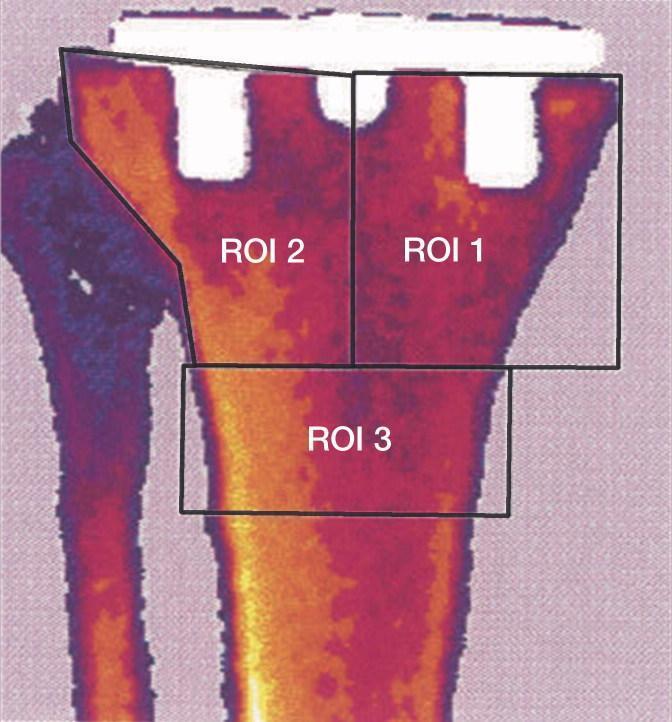
A pseudocolor Dual-Energy X-ray Absorptiometry (DEXA) scan of a proximal tibia in the anterior-posterior (AP) projection, demonstrating a periprosthetic bone mineral density (BMD) analysis after total knee arthroplasty. The image features three distinct Regions of Interest (ROIs) used to quantify bone remodeling around a tibial prosthesis. ROI 1 (medial) and ROI 2 (lateral) are 4 cm long rectangular boxes positioned immediately distal to the tibial component tray, spanning from the central axis to the respective cortical margins. ROI 3 is a 2 cm long rectangular area located immediately distal to ROI 1 and 2, spanning the full width of the tibial shaft. The color scale indicates BMD levels: yellow and orange represent higher bone density, while red and purple signify lower density. This visualization is used in orthopedic research to monitor stress shielding, bone resorption, or osseointegration adjacent to orthopedic implants over time.
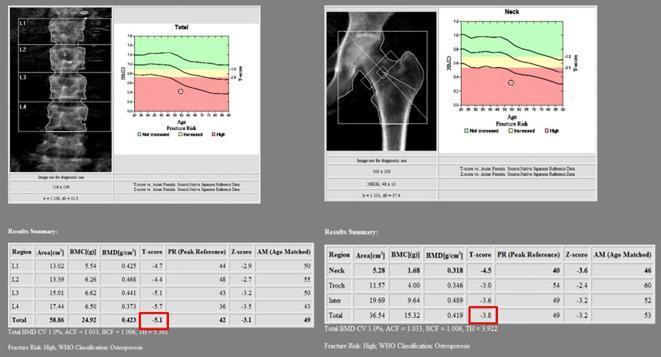
Dual-energy X-ray absorptiometry (DEXA) scan report presenting bone mineral density (BMD) analysis of the lumbar spine and proximal femur. The image is divided into two clinical diagnostic panels. The left panel shows the lumbar spine (L1–L4) with segmented vertebral regions, an associated fracture risk graph plotting BMD against age, and a quantitative 'Results Summary' table. The highlighted total T-score of -5.1 for the lumbar spine is significantly below the -2.5 threshold, indicating severe osteoporosis. The right panel displays the proximal femur (hip) with demarcated regions for the femoral neck, trochanter, and intertrochanteric area. Its corresponding fracture risk graph shows a data point deep within the red 'High Risk' zone. The summary table for the femur highlights a total T-score of -3.8, confirming a diagnosis of osteoporosis. Both panels include Z-scores, peak reference percentages (PR), and age-matched percentages (AM). This comparison chart illustrates diagnostic imaging and metabolic bone disease assessment for clinical education on osteoporosis classification and fracture risk stratification.
DEXA scan principle machine parts how it works BMD interpretation fat percentage 2024
DEXA body composition scan fat mass lean muscle visceral adipose tissue
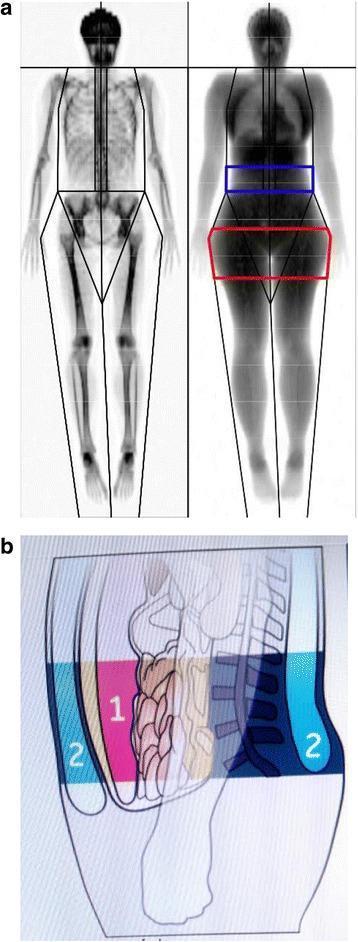
This dual-panel image demonstrates body composition analysis using Dual-Energy X-ray Absorptiometry (DEXA). Figure 1a displays two total-body DEXA scans illustrating different phenotypes: a lean individual on the left with high bone-to-soft-tissue contrast, and an individual with higher fat mass on the right where soft tissue obscuration reduces bone clarity. Color-coded Regions of Interest (ROI) are highlighted on the right-hand figure: a blue rectangular box designates the android region (abdominal/L1–L4 area), and a red trapezoidal box indicates the gynoid region (hip and upper thigh area). Figure 1b provides a cross-sectional anatomical diagram of the android region to differentiate adipose tissue compartments. It distinguishes visceral adipose tissue (labeled 1), depicted as pink internal masses located deep within the abdominal cavity near the viscera and spine, from subcutaneous adipose tissue (labeled 2), shown as a peripheral blue/yellow layer situated immediately beneath the skin. This visual illustrates clinical methods for assessing regional fat distribution and metabolic risk markers like VAT in patients with conditions such as COPD or obesity.
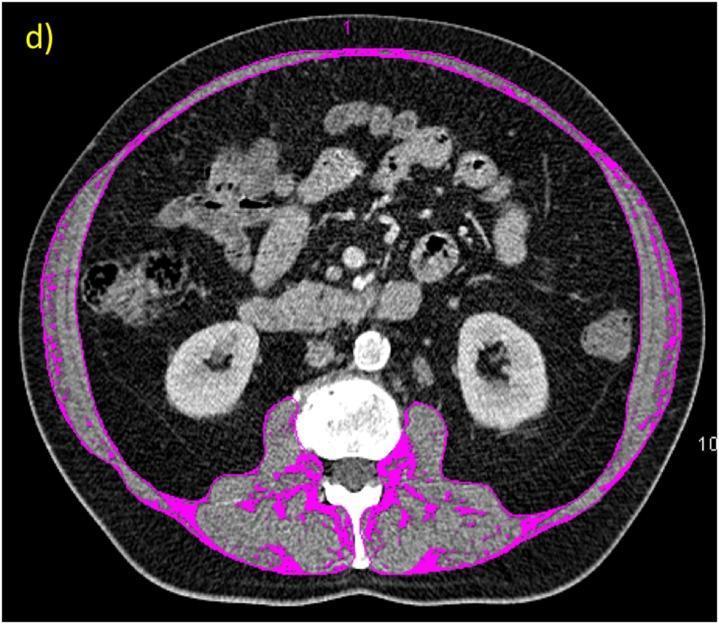
This diagnostic image is a transverse axial CT scan of the abdomen at the L3/L4 lumbar level, demonstrating densitometric quantification for body composition analysis. The image shows a cross-section of abdominal viscera, including the kidneys, intestines, and the lumbar spine. A specific region of interest (ROI) has been processed using thresholding (-190 to -30 Hounsfield Units) to identify adipose tissue. Areas highlighted in pink represent the Inter-Muscular Fat Area (IMFA) and subcutaneous adipose boundaries. These pink markings are visible within the posterior muscle compartments (including the erector spinae and psoas muscles) and along the inner fascia of the abdominal wall. This quantitative imaging technique is used in clinical research to assess muscle quality, myosteatosis, and overall metabolic health by isolating fat deposits within skeletal muscle groups, which are distinguished from lean muscle mass and visceral fat.
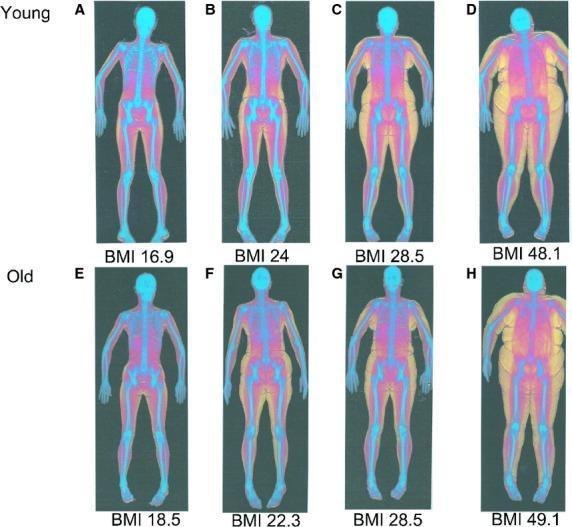
This diagnostic image display consists of eight whole-body dual-energy X-ray absorptiometry (DEXA) scans categorized by age (Young vs. Old) and Body Mass Index (BMI). The series illustrates variations in body composition across a spectrum ranging from underweight to obese. A standardized color-coding system is used to visualize tissue types: blue represents bone mineral density, red indicates lean soft tissue (muscle), and yellow signifies adipose (fat) tissue. The 'Young' cohort (A-D) shows a progression from a predominance of red and blue with minimal truncal yellow in the underweight scan (BMI 16.9) to extensive, diffuse yellow adipose deposition throughout the trunk and extremities in the obese scan (BMI 48.1). The 'Old' cohort (E-H) demonstrates similar adiposity trends but visually reflects age-related changes, such as potential sarcopenia and altered fat distribution. These scans are used in clinical and educational settings to assess metabolic health, sarcopenic obesity, and the impact of aging on musculoskeletal integrity. The visuals provide a clear comparison of how BMI and chronological age influence the ratio and anatomical distribution of fat, lean mass, and bone.
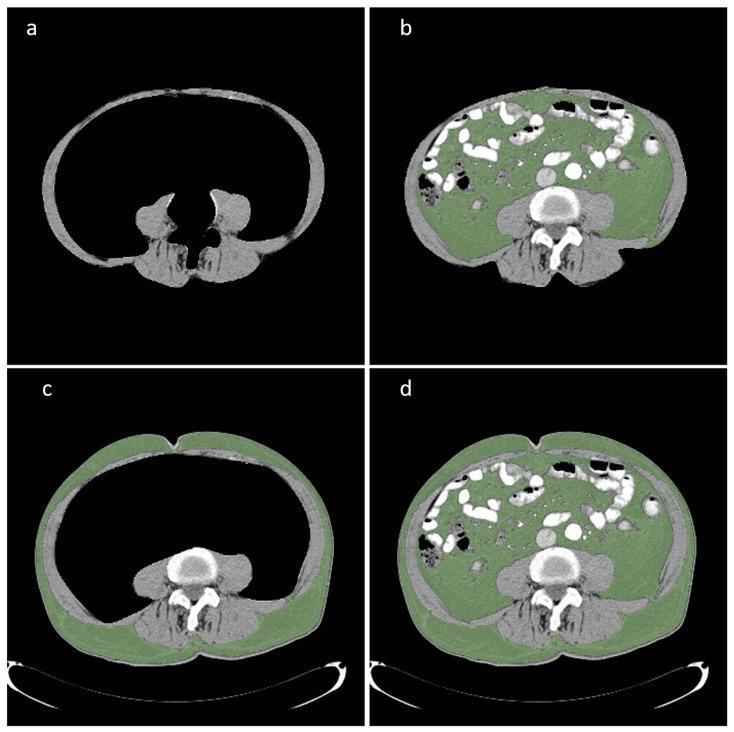
Diagnostic axial CT scans of the abdomen at the level of the umbilicus, demonstrating body composition segmentation for clinical analysis. The four-panel image (a-d) illustrates different adipose and lean tissue compartments highlighted using Hounsfield unit (HU) thresholding. Panel (a) shows the isolated skeletal muscle mass (SMA), including the abdominal wall and paraspinal muscles. Panel (b) highlights the visceral fat area (VFA) in green, located within the abdominal cavity and surrounding the internal organs. Panel (c) highlights the subcutaneous fat area (SFA) in green, representing the adipose tissue layer directly beneath the skin. Panel (d) shows the total fat area (TFA), combining both visceral and subcutaneous compartments. This radiological segmentation is used to calculate indices like the skeletal muscle index (SMI) and to assess for conditions such as sarcopenia, obesity, or sarcopenic obesity, which serve as prognostic markers in surgical and oncological contexts.
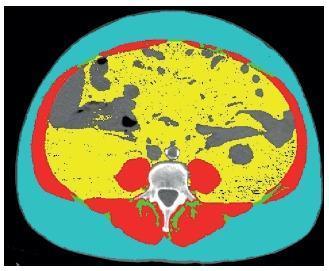
This diagnostic image is an axial CT scan of the abdomen at the L3 vertebral level, processed using sliceOmatic® software for body composition analysis. The image utilizes a pseudocolor segmentation scheme to differentiate tissue types: teal/blue represents subcutaneous adipose tissue (SAT) forming the outer peripheral layer; red indicates skeletal muscle (SM) including the abdominal wall and paraspinal muscles; yellow identifies visceral adipose tissue (VAT) distributed within the abdominal cavity; and green highlights intramuscular adipose tissue (IMAT) located within the muscle boundaries. The L3 vertebral body is visible posteriorly in grayscale. The image serves as an educational tool for quantifying fat and lean mass, often used in clinical research to study metabolic health, obesity, and systemic inflammation (e.g., CRP correlation). The spatial distribution clearly delineates the anatomical boundaries between external fat, the muscular envelope, and internal organ-associated fat.
https://www.radiologyinfo.org/en/info/dexa
DEXA scan T-score Z-score graph osteoporosis osteopenia interpretation
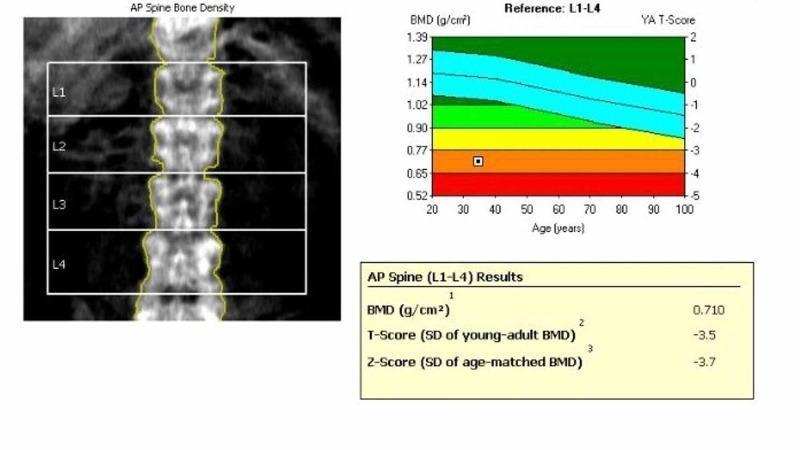
This diagnostic report displays a dual-energy X-ray absorptiometry (DEXA) scan of the lumbar spine (L1-L4) and its corresponding analytical data. The visual includes an anteroposterior (AP) bone mineral density (BMD) image showing the vertebral bodies L1 through L4, each segmented by rectangular regions of interest for quantitative analysis. To the right, a reference graph plots the patient's BMD (0.710 g/cm²) against age-matched and young-adult (YA) population norms. The graph features color-coded zones: green for normal, yellow for osteopenia, and orange/red for osteoporosis. The patient's data point is notably positioned in the orange zone, indicating significantly reduced bone density. Below the graph, a results table summarizes the findings: a BMD of 0.710 g/cm², a T-score of -3.5 (standard deviations below the YA mean), and a Z-score of -3.7 (standard deviations below the age-matched mean). These findings are clinically indicative of severe osteoporosis or metabolic bone diseases such as osteomalacia, highlighting a high risk for insufficiency and compression fractures.
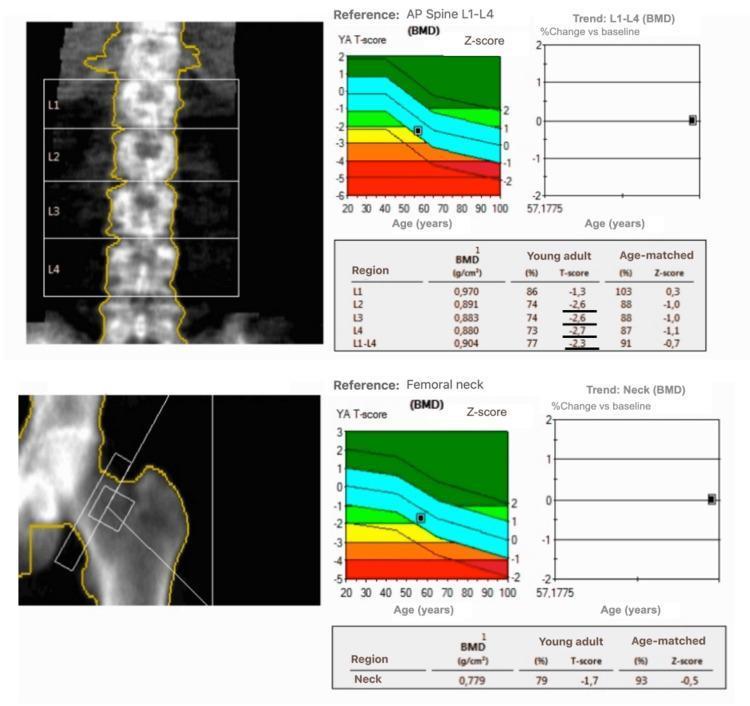
This diagnostic report presents results from a dual-energy X-ray absorptiometry (DEXA) scan used for bone mineral density (BMD) assessment. The report is divided into two main sections: the Anteroposterior (AP) Lumbar Spine (L1-L4) and the Femoral Neck. Each section includes a localized scan image with defined regions of interest, a color-coded reference graph, a longitudinal trend plot, and a data table. The color-coded reference graphs plot the patient's YA T-score and Z-score against age-matched reference ranges, with green representing normal density, yellow/orange for osteopenia, and red for osteoporosis. For the AP Spine, the table indicates a combined L1-L4 T-score of -2.3 and a BMD of 0.904 g/cm², while the Femoral Neck shows a T-score of -1.7 and a BMD of 0.779 g/cm². These findings are clinically significant for the diagnosis of osteopenia, approaching the threshold for osteoporosis in the lumbar region. The longitudinal 'Trend' graphs track the percentage change vs baseline over time, serving as a tool for monitoring disease progression or treatment efficacy in skeletal health management.
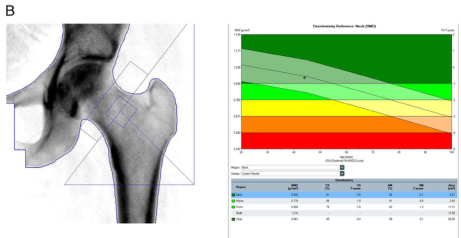
Summary : This figure presents a dual-energy X-ray absorptiometry (DEXA) scan analysis of the proximal femur (hip), including both the scan image and a corresponding bone mineral density (BMD) T-score chart for osteoporosis assessment. photo and data plot: # Scan Image : • Left panel shows a grayscale DEXA scan of the proximal femur (hip joint and upper femur). • Anatomical landmarks (femoral neck, head, and shaft) are visible. • Blue rectangular regions of interest (ROIs) are overlaid, demarcating analysis zones (neck, total hip, etc.). • Additional blue lines outline the femoral contours and analysis boundaries. # BMD T-score Chart : • Right panel displays a color-coded reference chart for "Osteometry Reference: Neck (NH)". • Y-axis: "BMD (g/cm²)" with values from approximately 0.4 to 1.7. • X-axis: "Age (years)" with values from 20 to 90. • Colored bands: – Green (normal BMD) – Yellow (osteopenia) – Orange/red (osteoporosis) • A black data point with error bars marks the patient's BMD value and age. • Table below the chart lists: – Region (e.g., "Neck", "Total", "Troch", "Inter", "Ward's", "Shaft") – BMD (g/cm²), T-score, Z-score, %YAM, %YAM (L), %YAM (R), and other metrics for each region. # Design Encodings : • Color bands indicate diagnostic thresholds (green = normal, yellow = osteopenia, orange/red = osteoporosis). • Black point and error bars show the patient's measurement and uncertainty. • Blue overlays on the scan image highlight analysis regions. # Analysis : • The patient's BMD value is plotted within the color-coded reference, allowing visual assessment of osteoporosis risk. • The scan and chart together enable anatomical localization and quantitative evaluation. • The table provides detailed BMD and T-score values for multiple femoral regions, supporting clinical interpretation.
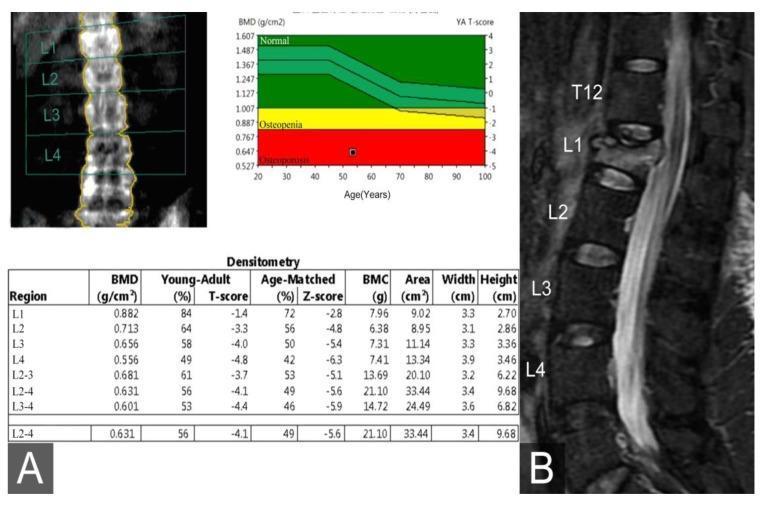
Educational medical composite image illustrating diagnostic findings of osteoporosis and an associated vertebral compression fracture. Panel A displays a Dual-Energy X-ray Absorptiometry (DEXA) report including a coronal lumbar spine scan (L1-L4), a densitometry table showing a critical T-score of -4.8 at L4, and a corresponding bone mineral density (BMD) graph. The graph plots BMD (g/cm²) against age, with color-coded reference ranges: green for normal, yellow for osteopenia, and red for osteoporosis; the patient's data point falls significantly within the osteoporosis range. Panel B presents a sagittal view MRI of the lumbar spine using a Short Tau Inversion Recovery (STIR) sequence. The MRI reveals a wedge-shaped deformity and hyperintense signal at the L1 vertebral body, characteristic of bone marrow edema from an acute osteoporotic compression fracture. Normal rectangular morphology is maintained in T12 and L2-L4. This visual set demonstrates the correlation between quantitative bone density measurements and clinical pathology in geriatric orthopedics.
DEXA / DXA Scan - Complete Guide
1. What is DEXA?
- Simple, quick, painless, and non-invasive
- Very low radiation dose: 1-6 μSv for BMD measurement (comparable to a few hours of background radiation); up to 50 μSv when performed with Vertebral Fracture Assessment (VFA)
- Typical scan time: 10-30 minutes
- (Grainger & Allison's Diagnostic Radiology)
2. Physical Principle
- Two X-ray beams are emitted at two distinct energy peaks: low energy (30-50 keV) and high energy (>70 keV)
- The low-energy beam is absorbed mainly by bone AND soft tissue
- The high-energy beam passes through soft tissue more easily
- By mathematically subtracting the soft-tissue contribution from the total attenuation, the system isolates the bone signal
- What remains after soft-tissue subtraction = patient's bone mineral density (BMD), expressed as g/cm² (areal BMD)
"The DXA machine sends a thin, invisible beam of low-dose x-rays with two distinct energy peaks through the bones being examined. One peak is absorbed mainly by soft tissue and the other by bone. The soft tissue amount can be subtracted from the total and what remains is a patient's bone mineral density." - RadiologyInfo.org (reviewed March 2024)
3. The DEXA Machine - Components and Parts
| Component | Description |
|---|---|
| Scanning table / patient couch | Padded, flat motorized table where the patient lies supine |
| X-ray generator / source | Positioned BELOW the patient table; emits two alternating energy X-ray beams |
| Detector array | Positioned ABOVE the patient; captures transmitted photons |
| C-arm / gantry | Connects source and detector, moves in a coordinated sweep |
| Collimator | Shapes the X-ray beam (pencil beam in older machines; fan beam in modern) |
| Computer workstation | Receives detector output, applies subtraction algorithms, calculates BMD and body composition metrics |
| Calibration phantom | A device with known composition scanned daily to ensure machine accuracy |
Pencil beam vs. Fan beam
- Older/pencil beam systems: single detector, rectilinear scan - slow
- Modern fan beam systems: bank of multiple detectors, fan-shaped beam - rapid acquisition, improved spatial resolution (0.5-1 mm), but produces some geometric magnification
4. How the Procedure Works (Step by Step)
- No special preparation needed; metal-free clothing or gown
- Avoid calcium supplements 24 hours before
- Declare if pregnant, or recent contrast/barium studies
- BMI extremes can affect accuracy
- Patient lies supine on the padded table
- For lumbar spine: legs are supported on a padded box to flatten the lumbar lordosis and pelvis
- For hip: the foot is placed in a brace that rotates the hip inward (standardizes femoral neck position)
- The detector arm passes slowly over the area, sweeping head-to-toe or region-by-region
- Software automatically segments regions of interest (ROIs): L1-L4 vertebrae, femoral neck, Ward's triangle, trochanter, intertrochanteric area
- Operator checks and corrects automated segmentation
- Output: BMD in g/cm², T-scores, Z-scores, and graphs
- The finger, hand, forearm, or foot is placed in a small portable device
- Faster; used as a pre-screen where central DXA is unavailable
- Correlates less well with central DXA; cannot substitute for FRAX calculation
5. Skeletal Sites Measured
| Site | Region of Interest | Clinical Use |
|---|---|---|
| Lumbar spine | L1-L4 (PA view) | Primary site; rich trabecular bone |
| Proximal femur | Femoral neck, total hip, trochanter, Ward's triangle | WHO osteoporosis diagnosis; FRAX tool |
| Distal radius (1/3 site) | 1/3 radius ROI | Hyperparathyroidism; secondary causes |
| Total body | Whole skeleton | Body composition, pediatrics |
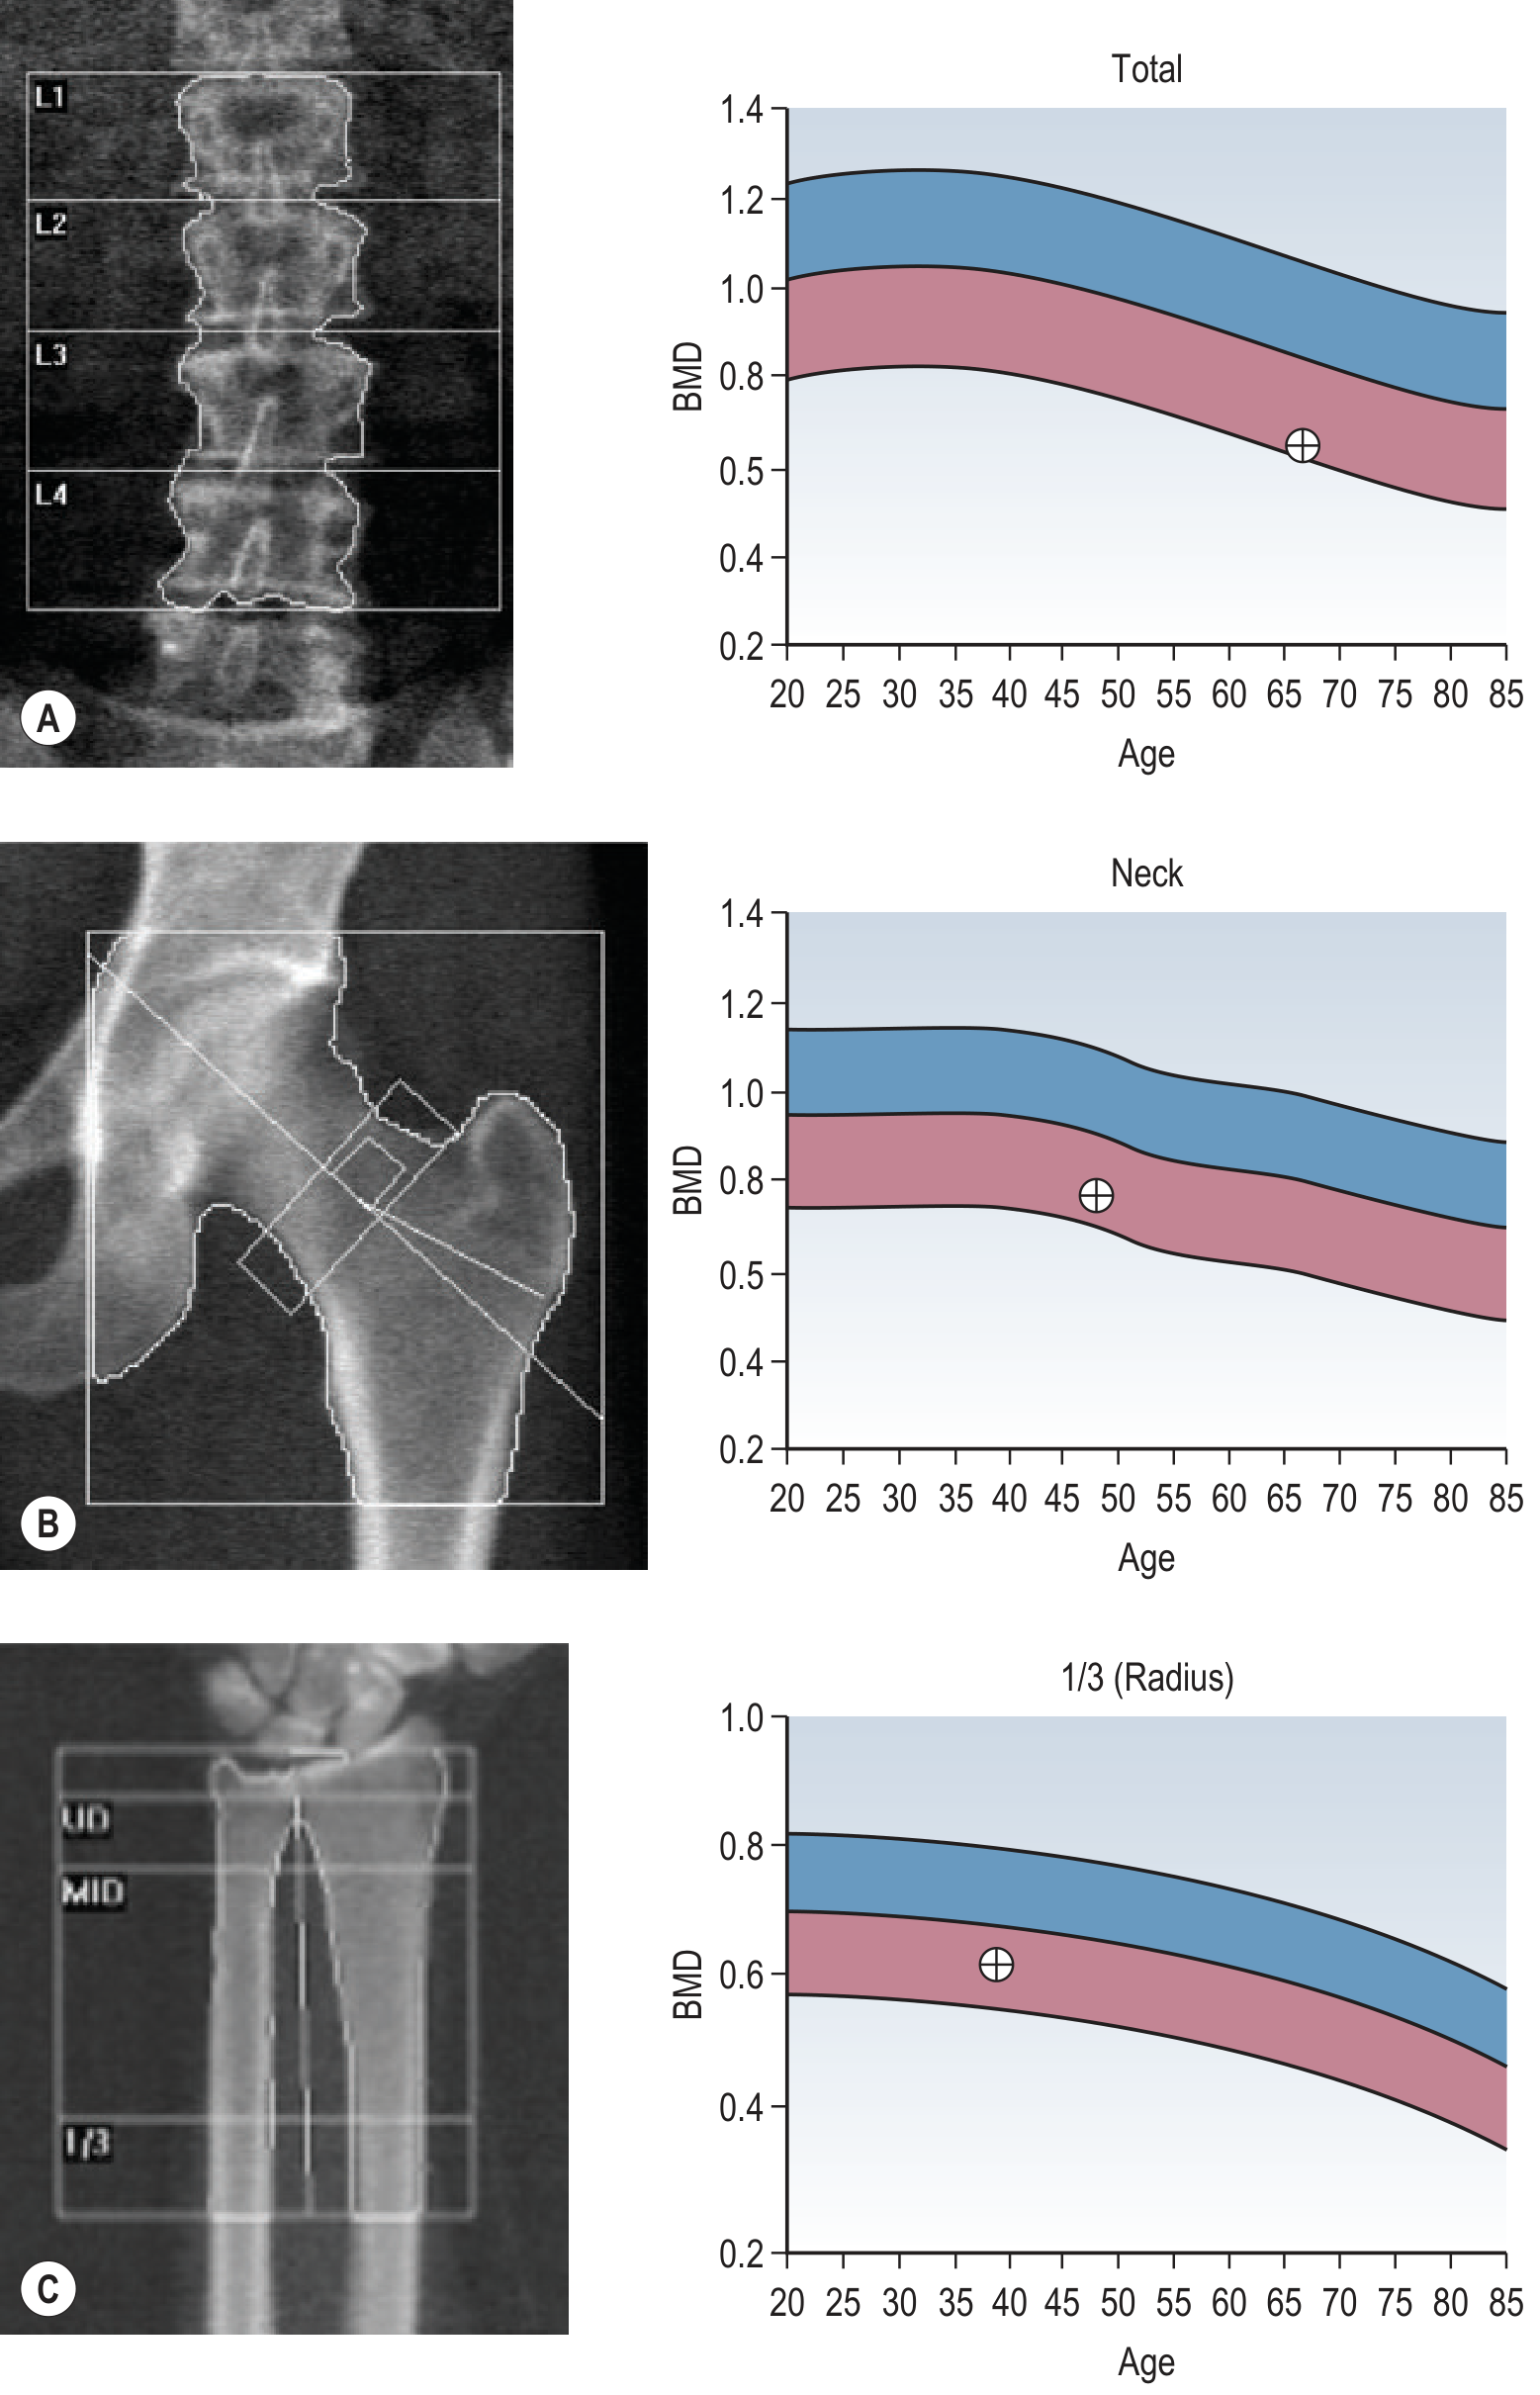
6. Bone Mineral Density (BMD)
- BMD = Bone Mineral Content (BMC, in grams) ÷ Bone Area (cm²)
- Unit: g/cm² (areal BMD - a 2D projection, not volumetric)
- Important limitation: DXA is a 2D technique; it cannot estimate bone depth. Small/slim people tend to have lower apparent BMD even if bone quality is normal. Bone spurs in osteoarthritis can falsely elevate spine BMD in older patients.
7. Interpretation - T-scores and Z-scores
T-score
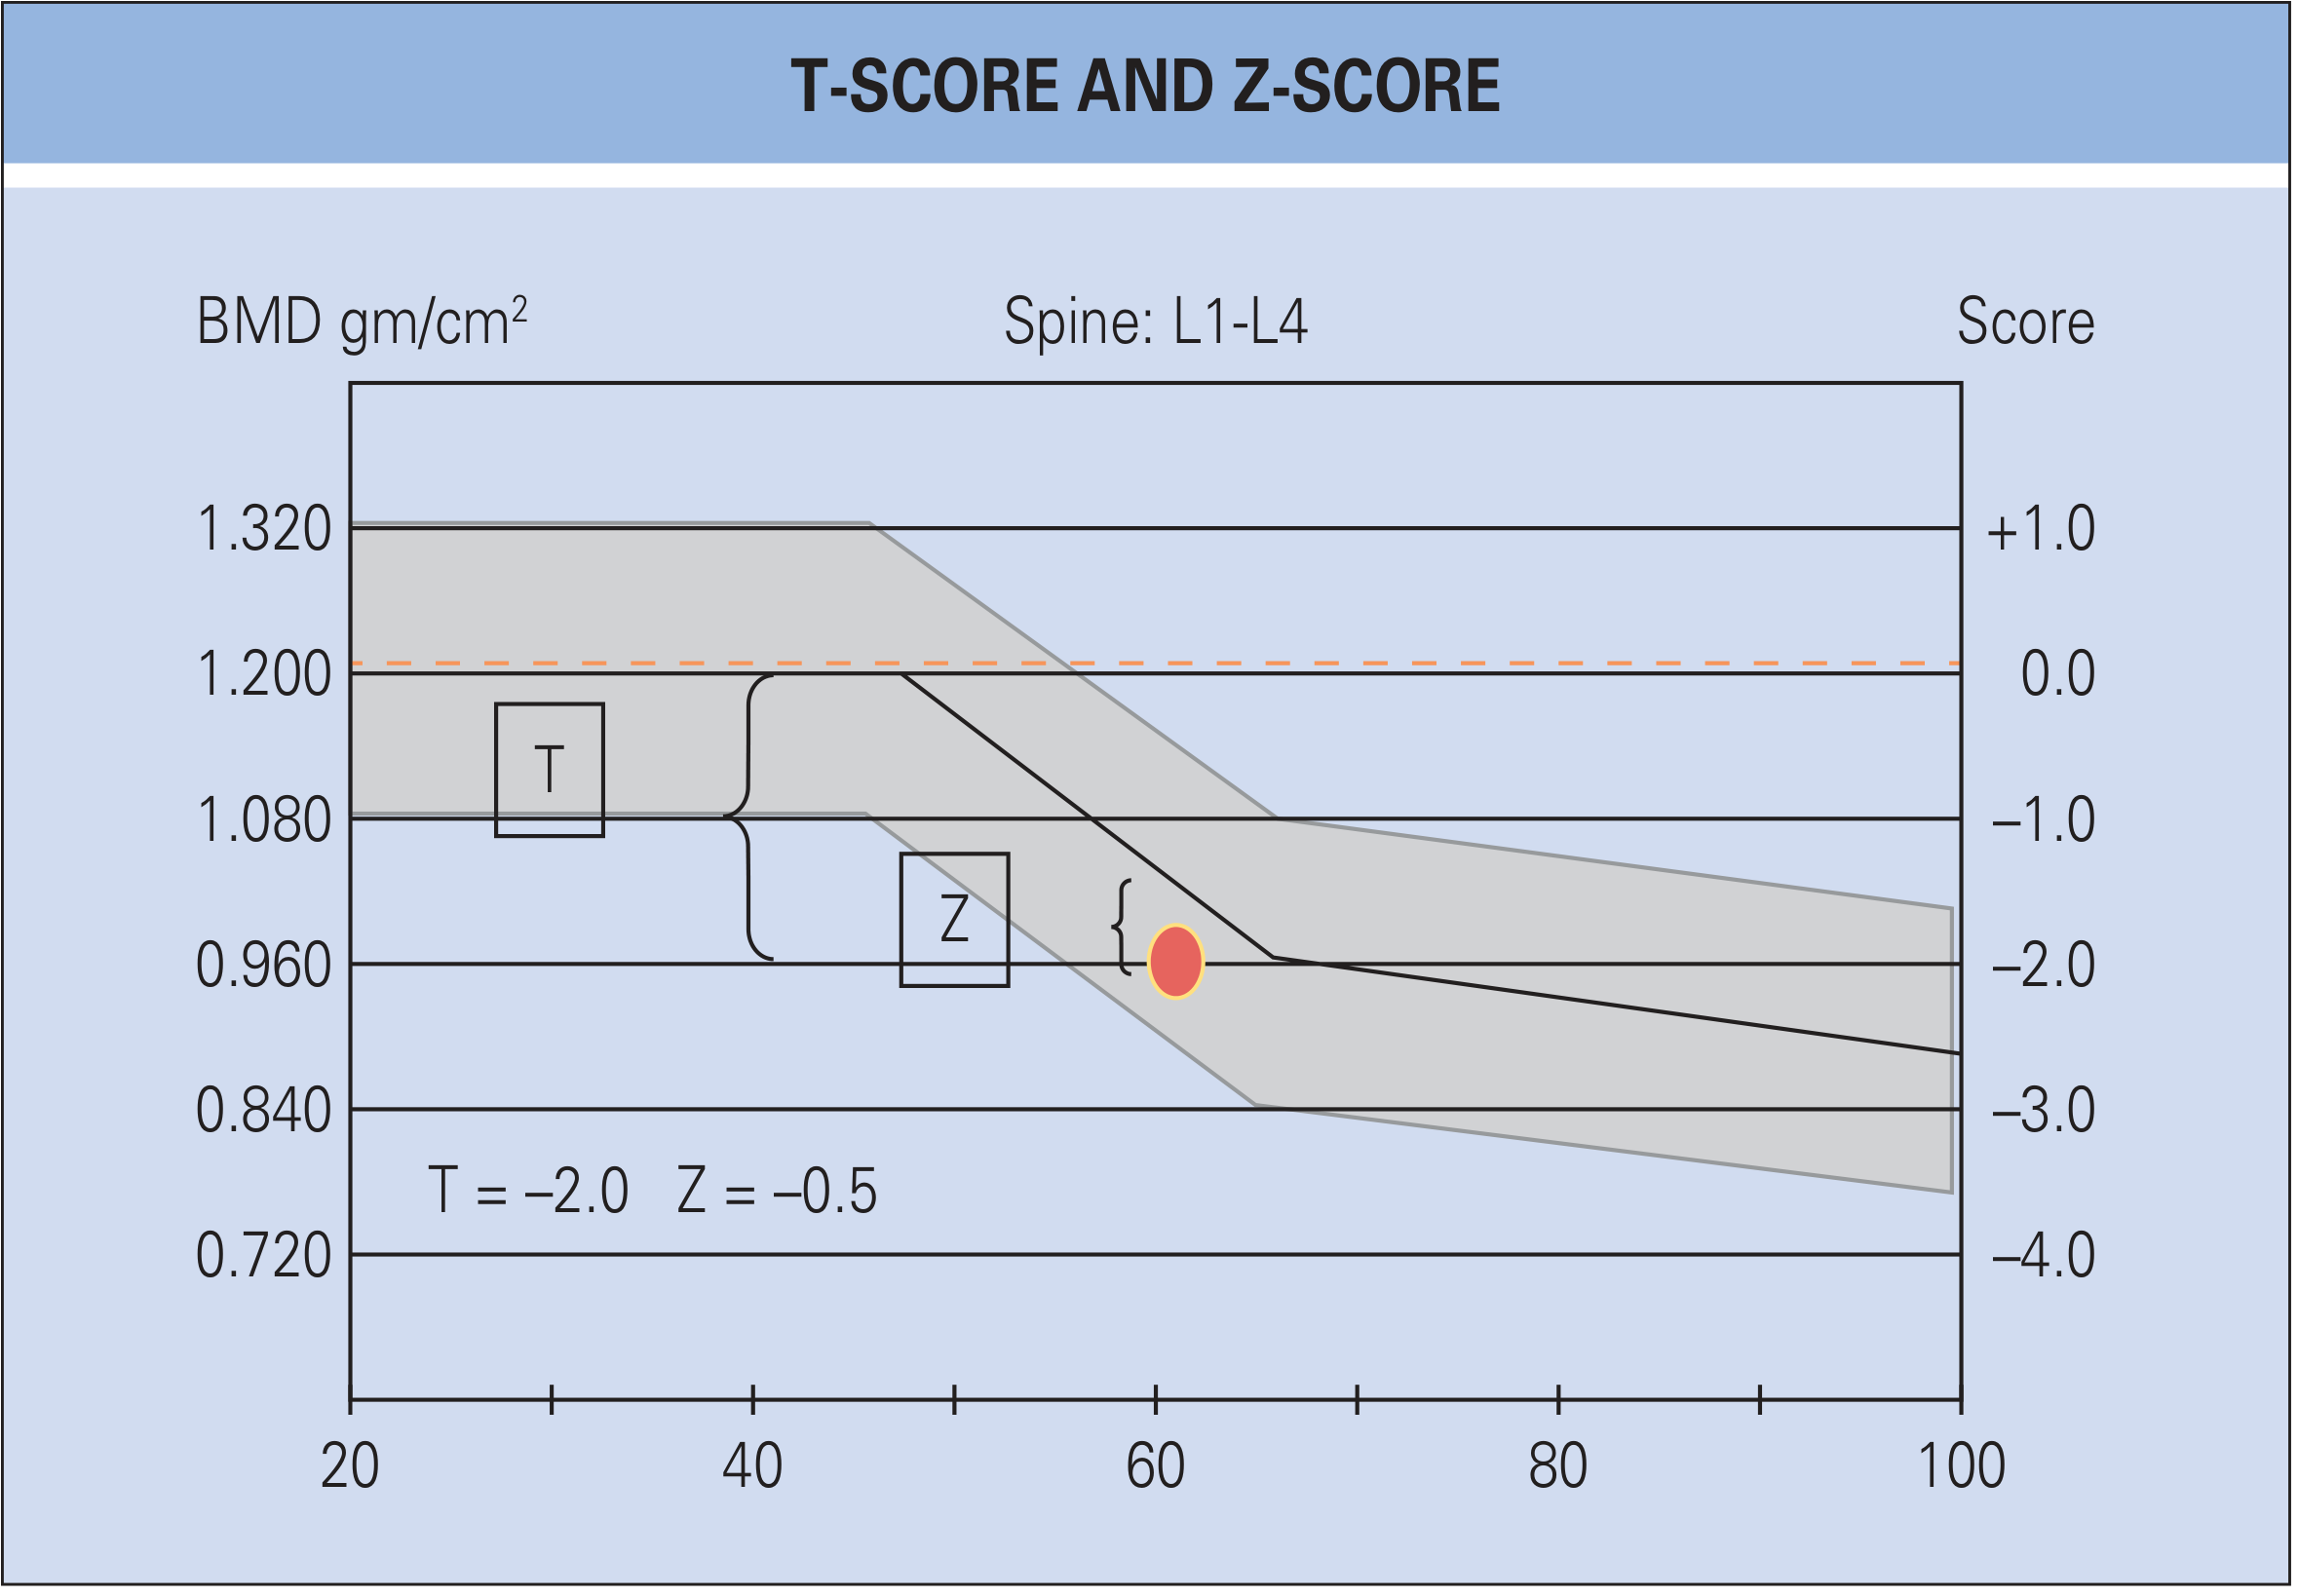
- Compares the patient's BMD to the mean BMD of a healthy young adult (30-year-old, same sex and race)
- A T-score of 0 = exactly at the young adult mean
- Range: approximately -2.5 to +2.5 SD
WHO Diagnostic Criteria (postmenopausal women and men >50)
| Category | T-score |
|---|---|
| Normal | T > -1.0 |
| Osteopenia (Low bone density) | -1.0 to -2.5 |
| Osteoporosis | T ≤ -2.5 |
| Severe osteoporosis | T ≤ -2.5 + one or more fragility fractures |
Z-score
- Compares the patient's BMD to an age-matched and sex-matched reference population
- Used in premenopausal women, men <50, and children
- A Z-score < -2.0 is defined as "below the expected range for age"
- Z-score can be misleading in postmenopausal women - a Z-score of -1 (1 SD below the age-matched mean) in a 60-year-old woman may correspond to a T-score of -2.5 (Harrison's Principles, 22nd ed.)
8. Technical Quality and Calibration
- Daily quality control (QC): A calibration phantom (with known BMD, BMC, and area - often resembling the human spine embedded in epoxy resin or submerged in water) is scanned at least 10 times at installation to define baseline values
- Precision error: Reproducibility is expressed as coefficient of variation (CV%). Short-term precision reflects repositioning error; long-term precision reflects machine drift
- The least significant change between two BMD measurements = 2.77 × precision error. Serial scans should therefore be separated by at least 18-24 months to detect meaningful biological change
- Always perform serial measurements on the same machine, same technician - different manufacturer systems give different absolute values
- Internal calibration: rotating drum/wheel checks each pixel; external calibration: phantom scan
9. Radiology Aspects and Reporting
- DEXA is a specialized X-ray technique - not standard plain radiography, CT, or MRI
- It produces projection images (like radiographs) of the measured region with overlaid ROI boundaries
- Images are grayscale with higher mineral density appearing brighter/whiter
- Software applies automated edge detection to segment vertebral bodies and femoral regions; the radiographer/operator must visually verify and correct these boundaries
- Artifacts to recognize: overlying metal (bra underwires, piercings, zips), vertebral fractures and osteophytes (falsely elevate spine BMD), extraskeletal calcifications (aortic calcification, calcium tablets), prior contrast agents (barium, gadolinium - delay scan)
- Lumbar spine BMD can be falsely elevated by degenerative disc disease, vertebral compression fractures, or aortic calcification - in these cases, hip measurement is more reliable
| Technique | Diagnostic Use | Radiation | VFx Assessment | Notes |
|---|---|---|---|---|
| DXA | +++ | Low (+) | Yes | Widely available; gold standard |
| Quantitative Ultrasound | Poor | None | No | Portable, low-cost |
| Quantitative CT (QCT) | Moderate | High (+++) | Yes | True volumetric BMD; cortical + trabecular |
| MRI | Poor | None | Yes | Fracture acuity/marrow assessment |
| HR-pQCT/FEA | Research only | Low | No | Microarchitecture; bone strength estimation |
10. Vertebral Fracture Assessment (VFA)
- An additional DXA-based technique where lateral views of the thoracic and lumbar spine are acquired during the same session
- Used to screen for vertebral deformities and compression fractures, which are often clinically silent
- Radiation dose is low and much less than a conventional lateral spine radiograph
- Adds only a few minutes to the DXA procedure
- Not as definitive as a standard radiograph for fracture characterization, but excellent as a screening tool
- Particularly recommended when: height loss >4 cm, kyphosis, or when the T-score finding changes clinical management
11. FRAX Tool - 10-Year Fracture Risk
- The Fracture Risk Assessment Tool (FRAX) integrates femoral neck BMD with clinical risk factors (age, sex, height, weight, fracture history, parental hip fracture, glucocorticoid use, rheumatoid arthritis, smoking, alcohol, secondary osteoporosis)
- Outputs: 10-year probability of major osteoporotic fracture (spine, hip, wrist, proximal humerus) and of hip fracture specifically
- Pharmacologic treatment is generally considered when: major fracture risk ≥20% or hip fracture risk ≥3% (US National Osteoporosis Foundation threshold)
- Limitation: FRAX does not include fall risk assessment (Harrison's, 22nd ed.)
- Only femoral neck BMD can be entered into FRAX; lumbar spine and distal radius cannot substitute
12. Body Composition Analysis - Fat Percentage and More
What Whole-Body DEXA Provides:
| Parameter | Description |
|---|---|
| Total body fat % | Most accurate non-invasive method for body fat measurement |
| Fat mass (g/kg) | Absolute fat mass by region |
| Lean mass / Fat-Free Mass (g) | Bone-free lean (muscle) mass |
| Bone Mineral Content (BMC) | Total skeletal weight in grams (~7 lbs in average adult) |
| Android fat % | Fat in the abdominal/trunk region (L1-L4 level) - "apple shape" |
| Gynoid fat % | Fat in the hip/thigh region - "pear shape" |
| Android:Gynoid ratio | Key metabolic risk marker |
| Visceral Adipose Tissue (VAT) | Deep abdominal fat surrounding organs (at L4-L5 level); measured and correlated with CT slices |
| Lean Mass Index (LMI) | Lean mass (kg) ÷ height² (m²) - analogous to BMI for muscle |
| Fat Mass Index (FMI) | Fat mass (kg) ÷ height² (m²) |
| Sarcopenia assessment | Low LMI indicates loss of muscle mass with age |
Clinical Significance of Body Composition Data:
- Visceral fat (VAT) is more metabolically dangerous than subcutaneous fat - associated with insulin resistance, cardiovascular disease, type 2 diabetes
- Android > gynoid fat ratio predicts cardiometabolic risk
- BMI alone misclassifies patients: a "normal BMI" person can have excess fat and low muscle (sarcopenic obesity)
- Sarcopenia (low lean mass) can be quantitatively diagnosed and monitored
- DEXA body composition is used in: sports medicine, bariatric surgery evaluation and follow-up, cancer cachexia monitoring, pediatric nutrition, HIV/lipodystrophy
13. Indications / Who Should Have a DEXA Scan
BMD Indications:
- Women ≥65 years (unconditional)
- Postmenopausal women <65 with risk factors (low body weight, early menopause, fragility fracture, glucocorticoid use, family history)
- Men ≥70 years (and younger men with risk factors)
- Anyone with a fragility fracture
- Long-term glucocorticoid therapy (≥3 months)
- Conditions: hyperparathyroidism, hyperthyroidism, hypogonadism, chronic kidney disease, malabsorption, anorexia nervosa, rheumatoid arthritis
- Monitoring treatment response (same machine, 18-24 month intervals)
- Renal osteodystrophy (CKD-MBD): DEXA Z-score < -2.5 has clinical significance (Rheumatology, Elsevier 2022)
Body Composition Indications:
- Obesity assessment (android vs. gynoid fat distribution)
- Sarcopenia screening
- Bariatric surgery pre/post evaluation
- Sports performance and athlete monitoring
- Pediatric growth and metabolic bone disease
- Cancer patients (cachexia, chemotherapy effects)
14. Additional Information DEXA Provides
- Trabecular Bone Score (TBS): a texture-based analysis of the lumbar spine DXA image that reflects bone microarchitecture quality - adds fracture risk information independent of BMD
- Hip structural analysis (HSA): geometric parameters of the femoral neck cross-section derived from DXA - estimates bone strength and fragility
- Periprosthetic BMD analysis: monitoring bone remodeling around orthopedic implants (hip/knee arthroplasty) - pseudo-color maps show BMD distribution around the prosthesis
- Pediatric DEXA: uses Z-scores against age/sex/pubertal status normative databases; total-body less head (TBLH) and lumbar spine are preferred sites
- Serial monitoring: least significant change calculation guides whether a real change in BMD has occurred vs. measurement error
15. Practical Technique Points
- Patient should lie still; may need to hold breath briefly for a few seconds during image acquisition
- Technologist operates from behind a wall/adjacent room
- Spine positioning: legs elevated on a foam block to flatten the lumbar curve
- Hip positioning: foot in a positioning device rotated ~25° internally
- Radiation dose equivalent: approximately 1/10 of a chest X-ray; negligible compared to background radiation
- Not performed in pregnancy (though dose is very low)
- Contrast media (barium, gadolinium) must clear before scanning (usually postpone 1-2 weeks)
16. Limitations and Artifacts
| Limitation | Effect |
|---|---|
| 2D projection technique | Cannot measure true volumetric BMD; small patients have falsely lower apparent BMD |
| Degenerative spinal disease | Osteophytes, endplate sclerosis falsely INCREASE lumbar spine BMD |
| Vertebral compression fractures | Falsely INCREASE BMD of affected level |
| Aortic calcification | Overlies spine ROI, falsely increases BMD |
| High body fat | Variable soft-tissue artifact affecting accuracy |
| Metal implants | Excluded from analysis; affects adjacent regions |
| Variation between manufacturers | T-scores are standardized but absolute BMD values differ; always use same machine for serial scans |
| Marrow fat | Changes in marrow fat content (with aging, steroids) can alter apparent BMD |
17. Summary Comparison DEXA vs. Other Methods
| Feature | DEXA | QCT | Ultrasound |
|---|---|---|---|
| Radiation | Very low (1-6 μSv) | High (hundreds μSv) | None |
| Cost | Moderate | High | Low |
| Availability | Widely available | Limited | Wide |
| Gold standard for osteoporosis | YES | No | No |
| True 3D volumetric BMD | No | Yes | No |
| Body composition | Yes (full body) | Partial | No |
| VFA capability | Yes | No | No |
| Reproducibility | Excellent (<1% CV) | Moderate | Poor |
Sources
- Grainger & Allison's Diagnostic Radiology - Dual Energy X-Ray Absorptiometry chapter
- Harrison's Principles of Internal Medicine, 22nd Edition (2025) - Measurement of Bone Mass, Osteoporosis
- Rheumatology 2-Volume Set (Elsevier 2022) - Skeletal Sites, T/Z-scores, FRAX, VFA
- RadiologyInfo.org - Bone Density Scan (DXA) - reviewed March 11, 2024
- kurtkuhlman.com DEXA Scan guide