
What is stroke volume
Stroke volume is the amount of blood ejected by the left ventricle with each heartbeat, typically around 70 mL at rest in a healthy adult. It is determined by three main factors: preload (the degree of ventricular filling before contraction), afterload (the resistance the ventricle must overcome to eject blood), and contractility (the intrinsic force of myocardial contraction). Cardiac output equals stroke volume multiplied by heart rate.
Searching sources...
Reading File
Finding Sources
Searching the Web
stroke volume physiology determinants normal values
Reading File
Reading File
Loading Image
Reading File
Here is a thorough explanation of stroke volume, drawn from authoritative physiology and anesthesiology textbooks.
Stroke Volume
Stroke volume (SV) is the volume of blood ejected by the left ventricle during a single contraction (systole). It is simply the difference between two ventricular volumes:
SV = End-Diastolic Volume (EDV) - End-Systolic Volume (ESV)
- End-Diastolic Volume (EDV): the amount of blood in the ventricle just before it contracts (~120 mL)
- End-Systolic Volume (ESV): the amount of blood remaining after contraction (~50 mL)
- Typical SV at rest: ~70 mL
(Costanzo Physiology 7th Edition, p. 155)
Ejection Fraction
A related measure is the ejection fraction (EF), which expresses how efficiently the ventricle ejects its contents:
EF = SV / EDV
Normally ~55-65%. A falling ejection fraction signals reduced contractility (as seen in heart failure).
Cardiac Output
Stroke volume is multiplied by heart rate to give cardiac output:
Cardiac Output = SV × Heart Rate
At rest in a 70-kg man: 70 mL × 72 beats/min ≈ 5,000 mL/min (5 L/min)
The Three Major Determinants of Stroke Volume
According to Morgan and Mikhail's Clinical Anesthesiology, stroke volume is governed by three factors:
| Factor | Definition | Effect on SV |
|---|---|---|
| Preload | Ventricular end-diastolic volume (degree of fiber stretch before contraction) | More preload → more SV (up to a limit) |
| Afterload | Resistance the ventricle must overcome to eject blood (aortic impedance / wall stress) | More afterload → less SV |
| Contractility | Intrinsic force of myocardial contraction, independent of preload and afterload | More contractility → more SV |
Additional factors that can affect SV include wall motion abnormalities and valvular dysfunction.
Preload and the Frank-Starling Law
Preload is primarily determined by venous return. As end-diastolic volume increases, cardiac muscle fibers are stretched, which increases the force of contraction and therefore SV. This is the Frank-Starling Law of the Heart - the strength of contraction depends on initial fiber length.
The graph below (from Starling's original work, as reproduced in Morgan & Mikhail) shows how cardiac output varies with ventricular end-diastolic volume under different contractile states:
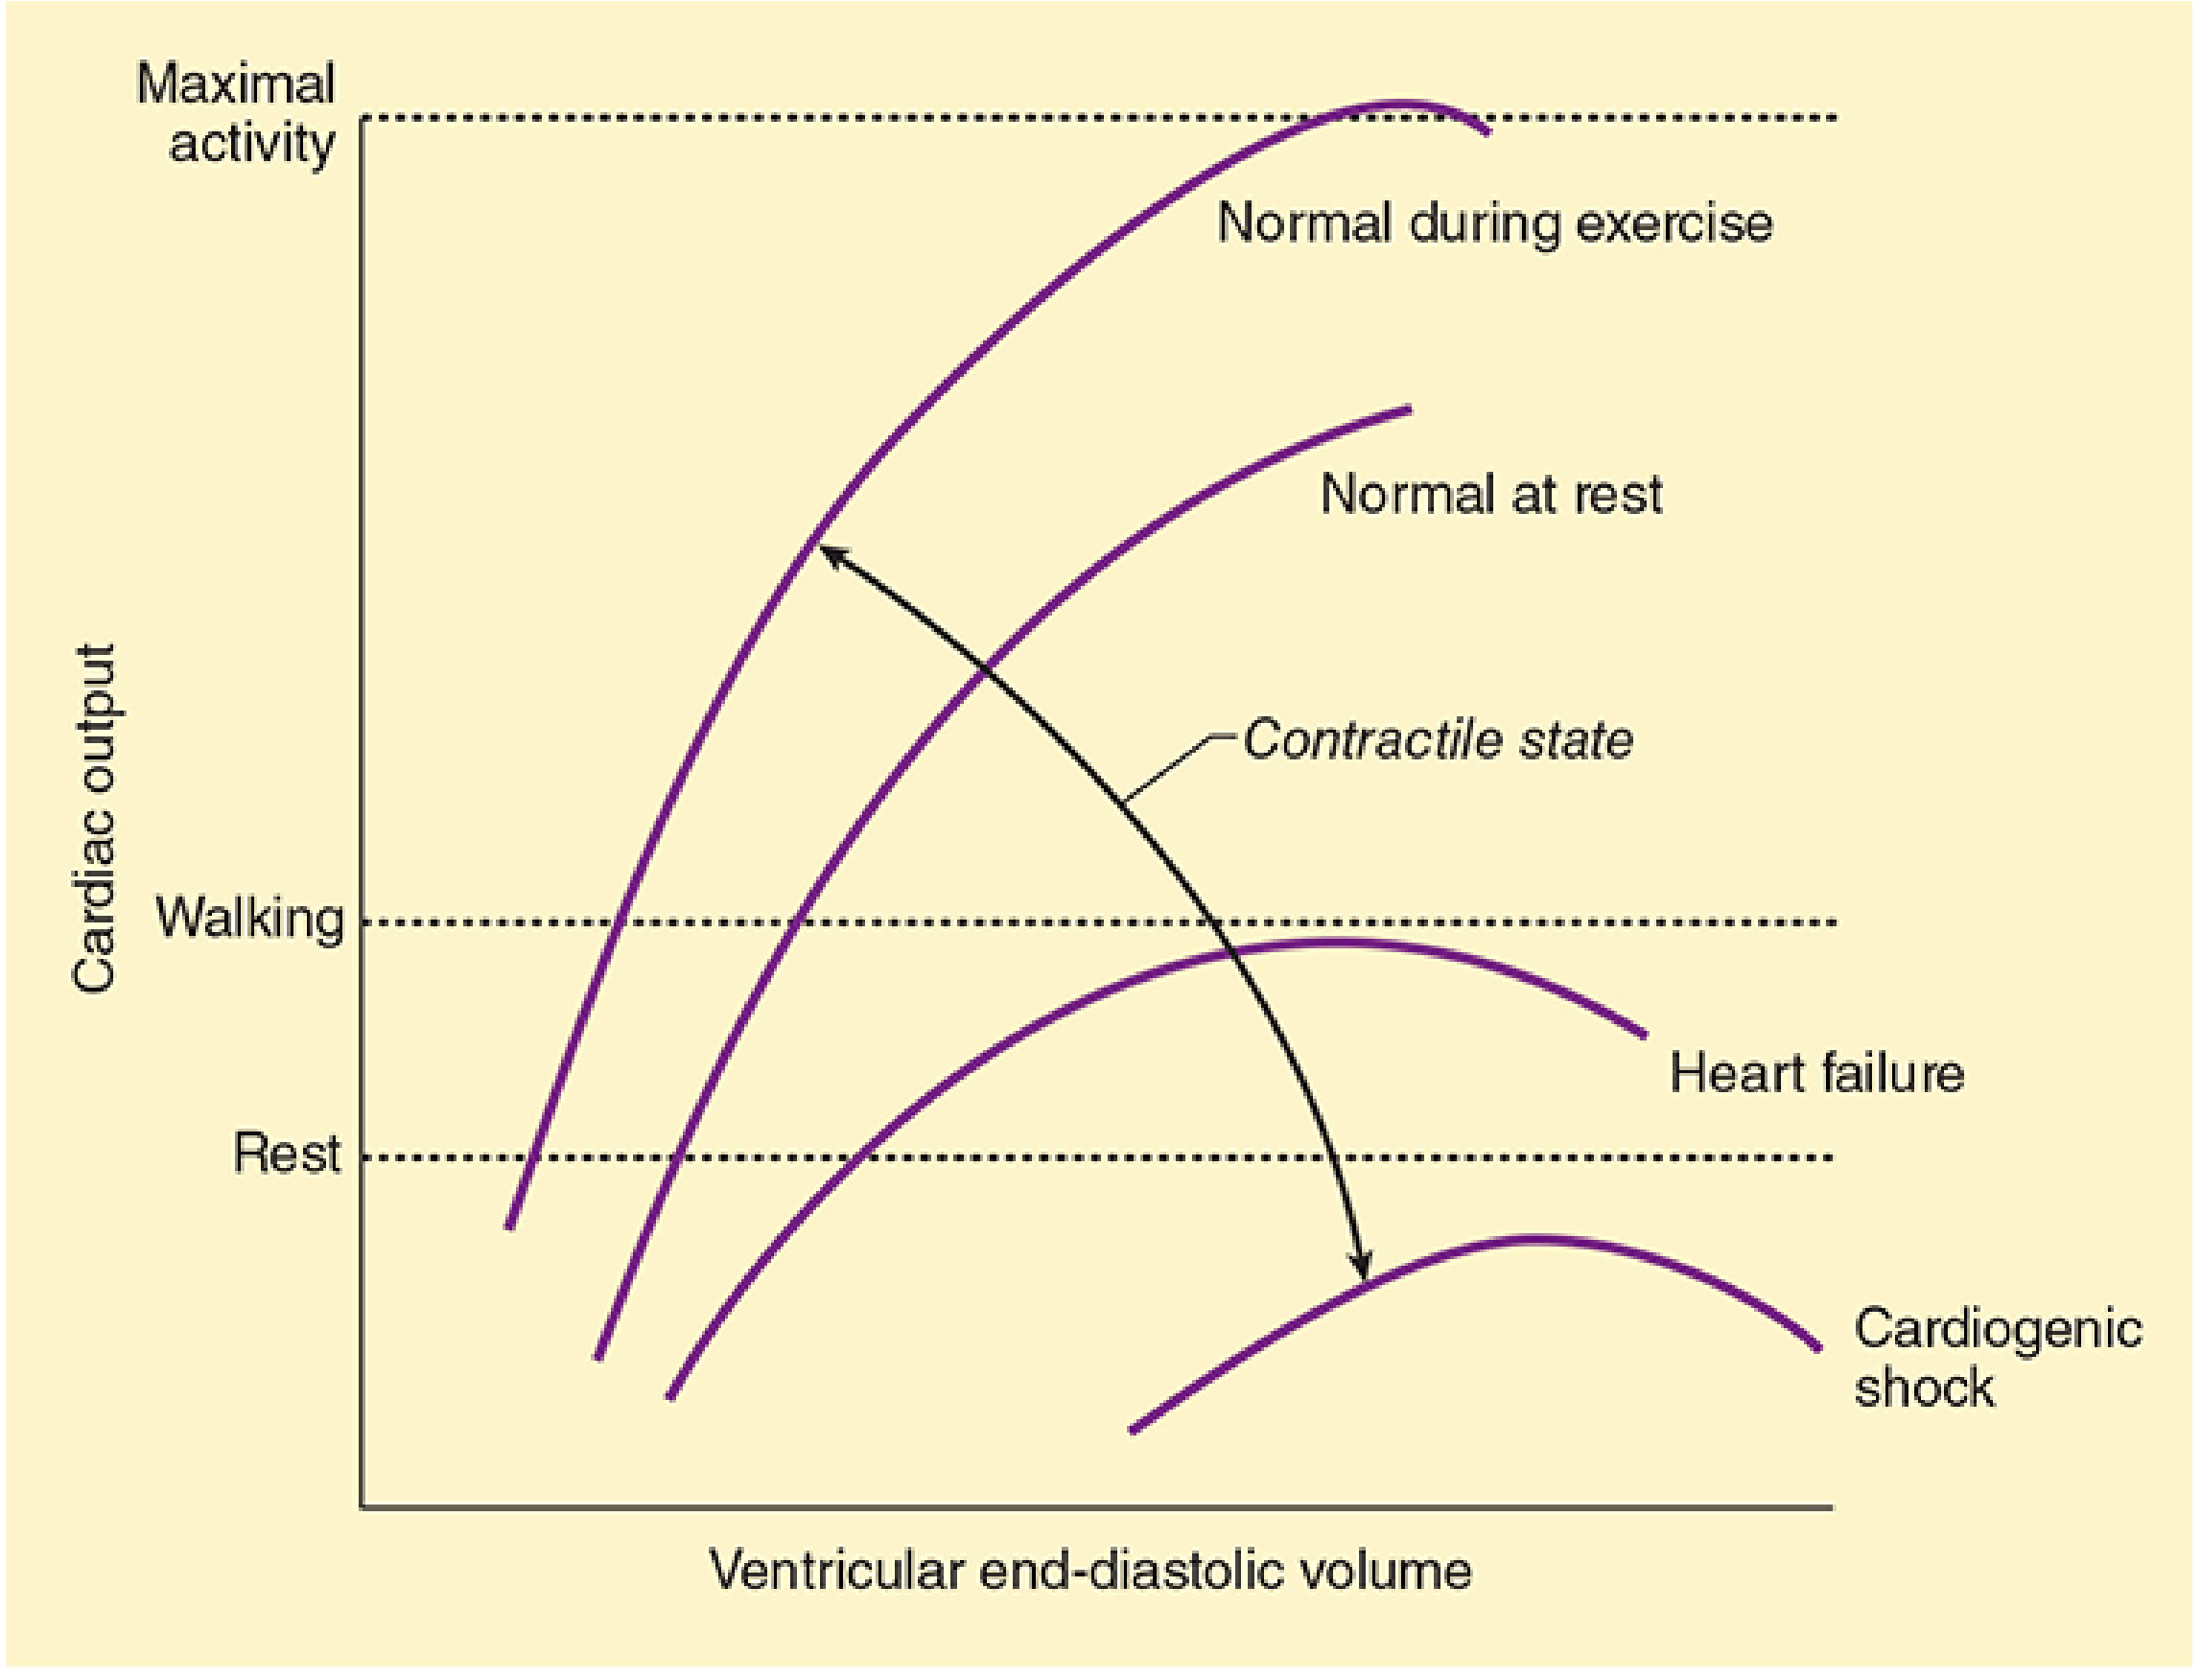
- The upper curves (exercise, normal at rest) reflect higher contractility
- The lower curves (heart failure, cardiogenic shock) reflect depressed contractility
- Each curve peaks and can decline at very high EDV (ventricular overdistension)
Factors Affecting Preload
(Morgan & Mikhail's Clinical Anesthesiology, p. 658)
- Blood volume
- Distribution of blood volume (posture, venous tone)
- Intrathoracic pressure (e.g., positive-pressure ventilation reduces venous return)
- Pericardial pressure
- Heart rate and rhythm (atrial contraction contributes 20-30% of filling)
Quick Reference: Sample Calculation
A patient with EDV = 140 mL, ESV = 70 mL, HR = 75 beats/min:
- SV = 140 - 70 = 70 mL
- Cardiac Output = 70 × 75 = 5,250 mL/min
- Ejection Fraction = 70/140 = 50%
(Costanzo Physiology 7th Edition, p. 155)
This is a shared conversation. Sign in to Orris to start your own chat.