Want to learn ECG from basics
Reading File
Finding Sources
Finding Sources
Finding Sources
Finding Sources
Finding Sources
Reading File
Finding Sources
Finding Sources
Finding Sources
Finding Sources
Reading File
Reading File
Reading File
Reading File
Reading File
Reading File
Reading File
Loading Image
Loading Image
Loading Image
Loading Image
I now have everything needed for a comprehensive, well-illustrated ECG basics guide. Let me compile it.
ECG from the Basics: A Complete Beginner's Guide
Sources: Guyton and Hall Textbook of Medical Physiology, Harrison's Principles of Internal Medicine 22E, The Harriet Lane Handbook
1. What is an ECG?
When a cardiac impulse passes through the heart, electrical current spreads into surrounding tissues all the way to the skin surface. By placing electrodes on the skin on opposite sides of the heart, these tiny electrical potentials can be recorded. This recording is the electrocardiogram (ECG or EKG).
"If electrodes are placed on the skin on opposite sides of the heart, electrical potentials generated by the current can be recorded." - Guyton and Hall Textbook of Medical Physiology
2. The ECG Waveforms
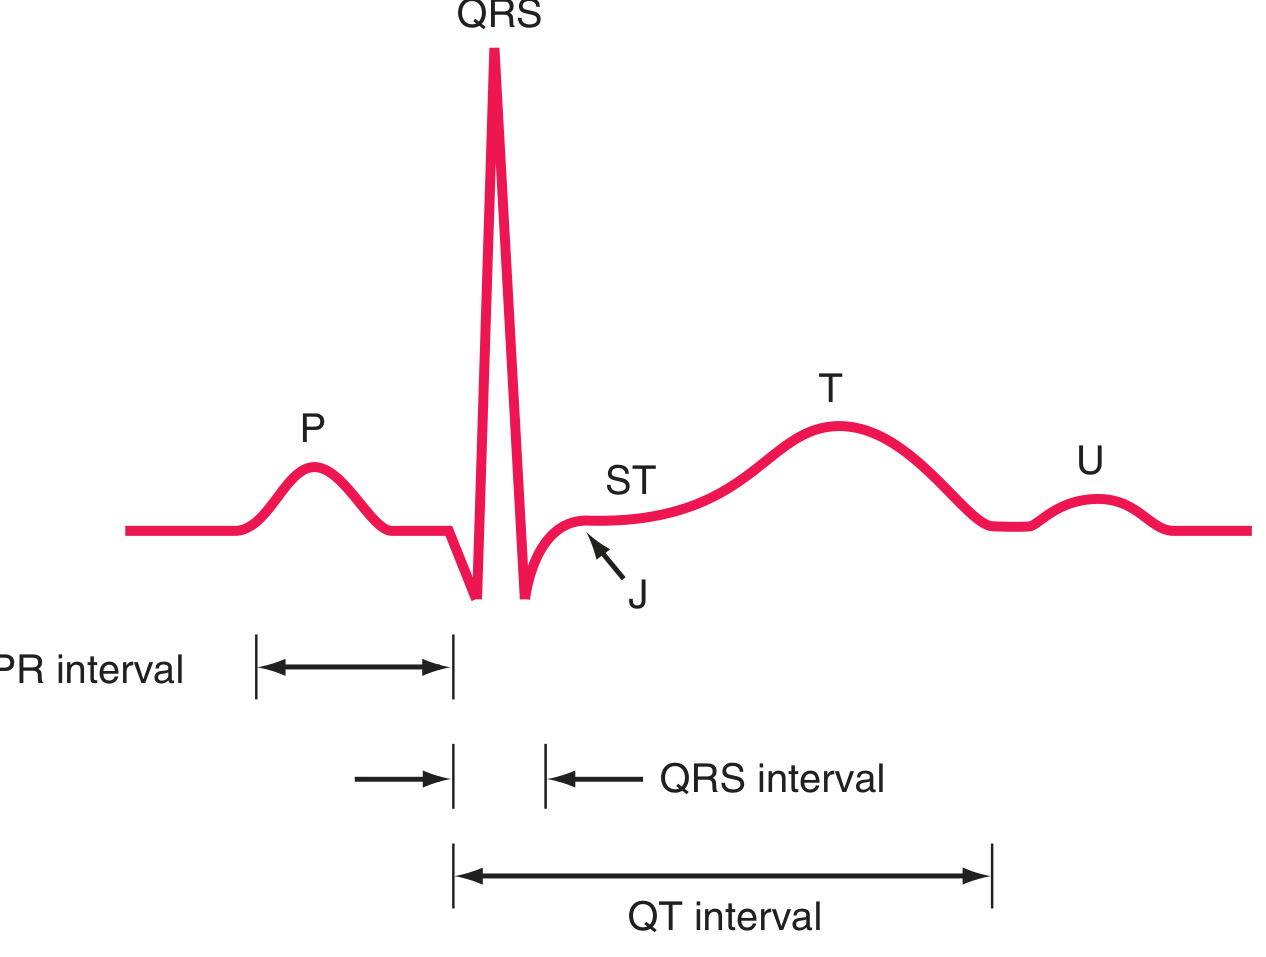
A single normal cardiac cycle on the ECG contains these components:
| Wave/Segment | What it represents | Normal values |
|---|---|---|
| P wave | Atrial depolarization (atria contract after this) | Amplitude 0.1-0.3 mV; duration <0.12 s |
| PR interval | Time from atrial depolarization to ventricular depolarization (includes AV node delay) | 120-200 ms (0.12-0.20 s) |
| QRS complex | Ventricular depolarization (ventricles contract after this) | Duration ≤100-110 ms; amplitude 1.0-1.5 mV |
| ST segment | Period between ventricular depolarization and repolarization (isoelectric at rest) | Should be at baseline |
| T wave | Ventricular repolarization | Broad, slightly asymmetric positive wave |
| QT interval | Total ventricular depolarization + repolarization | QTc ≤440-460 ms (rate-corrected) |
| U wave | Late repolarization of Purkinje fibers / M cells | Small, <1 mm, same polarity as T wave |
Why is the T wave in the same direction as QRS?
Repolarization normally travels in the reverse direction (epicardium to endocardium), which is the opposite of depolarization (endocardium to epicardium). Because both the vector and the process are reversed, the T wave ends up concordant with the QRS. - Harrison's Principles of Internal Medicine 22E
The atrial T wave - where is it?
The atria do repolarize, but the atrial T wave is buried inside the QRS complex (which occurs at the same time) and is never seen on a normal ECG. - Guyton and Hall
The U wave
A U wave is a small positive deflection after the T wave. It is enhanced by hypokalemia and drugs like amiodarone, sotalol, and quinidine. Prominent U waves can predispose to torsades de pointes.
3. ECG Paper: The Grid Explained
Understanding the paper is essential for measuring everything:
- Paper speed: 25 mm/second
- 1 small square = 1 mm = 0.04 seconds (horizontal) = 0.1 mV (vertical)
- 1 large square = 5 mm = 0.20 seconds (horizontal) = 0.5 mV (vertical)
- Standard calibration: 10 mm = 1 mV (you'll see a calibration box at the start of an ECG strip)
4. Heart Rate Calculation
Two quick methods:
- 300 rule: Count the number of large boxes between two R waves → HR = 300 ÷ number of large boxes
- 1 box = 300 bpm, 2 boxes = 150 bpm, 3 boxes = 100 bpm, 4 boxes = 75 bpm, 5 boxes = 60 bpm
- Precise: HR (bpm) = 60 ÷ R-R interval (in seconds)
5. The 12 ECG Leads
The 12-lead ECG is like 12 camera angles looking at the same electrical events from different directions.
Limb Leads (Frontal Plane)
- Lead I: Right arm (-) to Left arm (+) → 0°
- Lead II: Right arm (-) to Left foot (+) → +60°
- Lead III: Left arm (-) to Left foot (+) → +120°
- aVR: Augmented vector Right → -150°
- aVL: Augmented vector Left → -30°
- aVF: Augmented vector Foot → +90°
Precordial (Chest) Leads (Horizontal Plane)
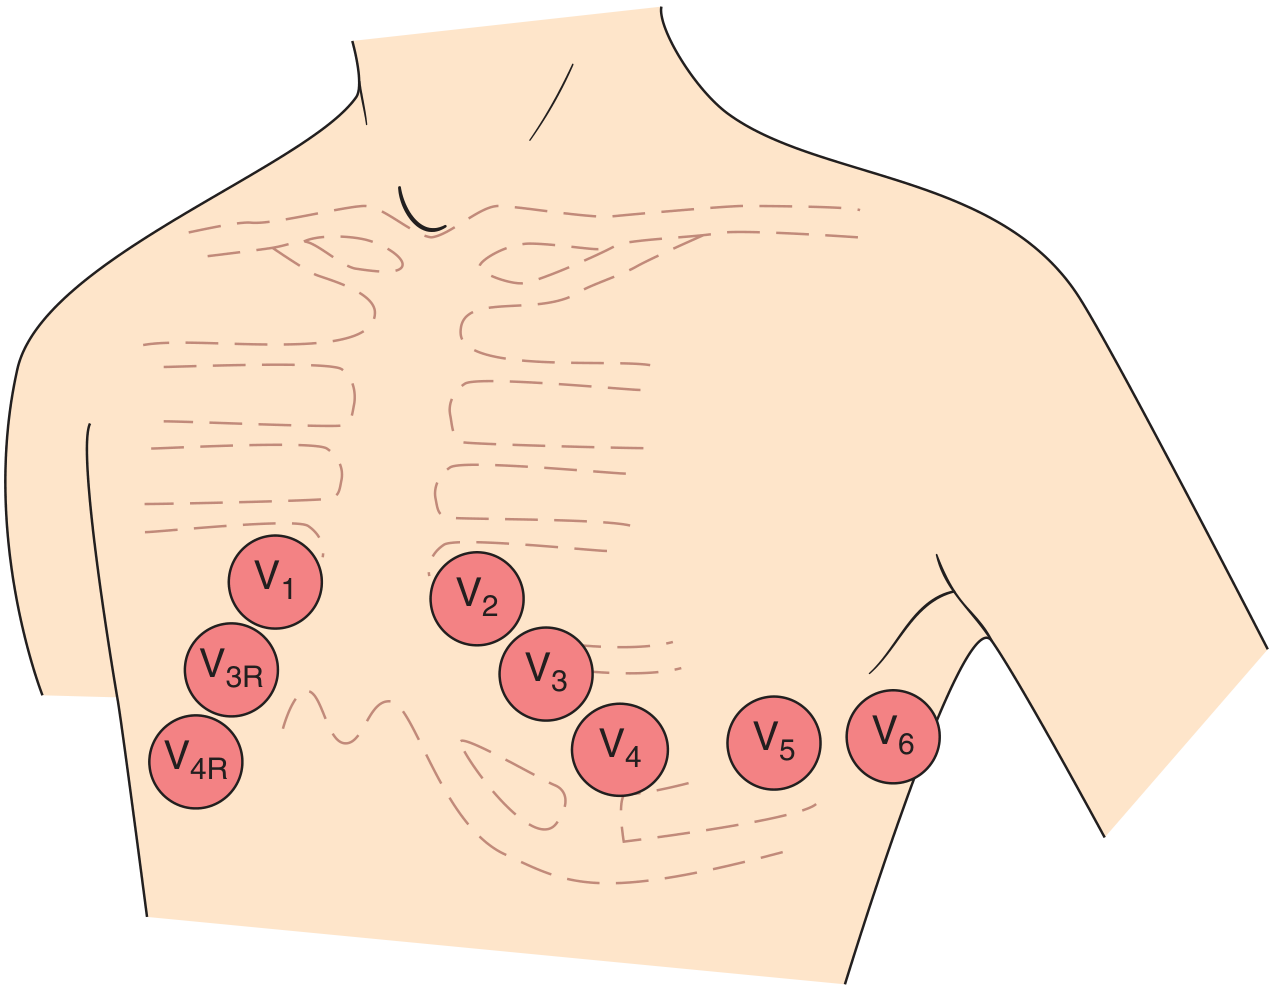
| Lead | Position |
|---|---|
| V1 | 4th intercostal space, right sternal border |
| V2 | 4th intercostal space, left sternal border |
| V3 | Between V2 and V4 |
| V4 | 5th intercostal space, midclavicular line |
| V5 | Anterior axillary line, same level as V4 |
| V6 | Midaxillary line, same level as V4-V5 |
Key rule: A positive (upright) deflection is recorded in a lead when a depolarization wave spreads toward its positive pole. Negative deflection when it spreads away from the positive pole.
6. Genesis of the QRS Complex
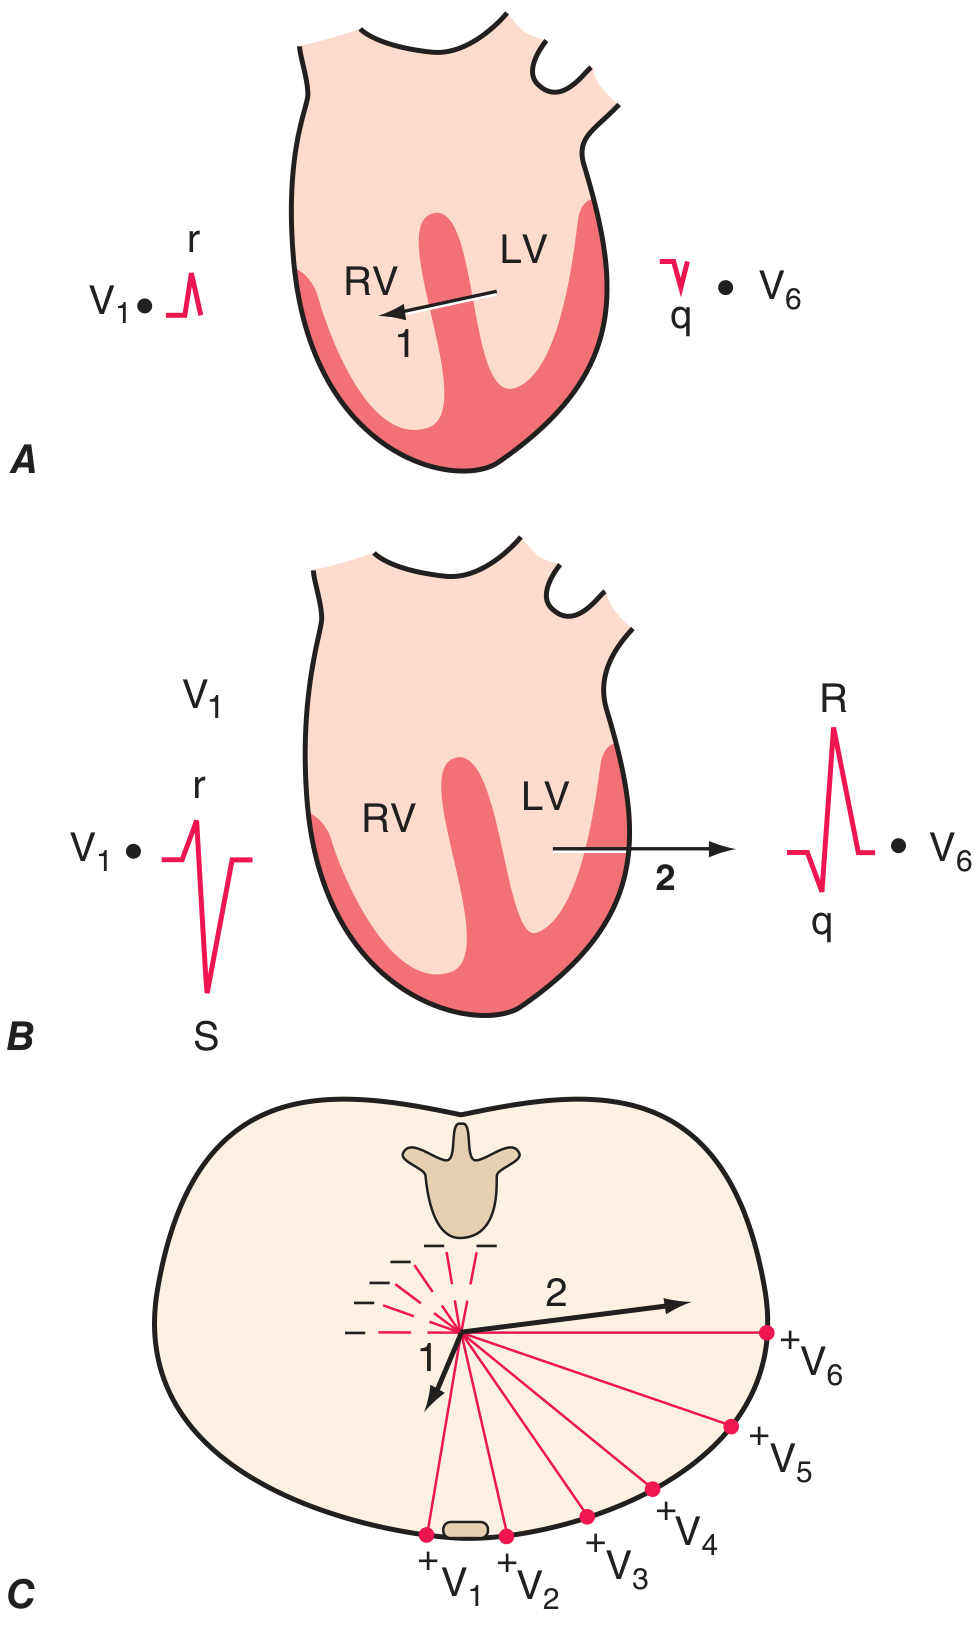
Ventricular depolarization happens in two phases:
Phase 1 - Septal depolarization:
- Travels left → right and anteriorly
- Produces a small r wave in V1 and a small q wave in V6
Phase 2 - Free wall depolarization:
- Left ventricle dominates (it's much thicker)
- Vector points left and posteriorly
- Produces a deep S wave in V1 and a tall R wave in V6
This explains R-wave progression across the chest leads - R waves get taller from V1 to V5/V6, while S waves diminish. The point where R = S is the transition zone (normally V3 or V4).
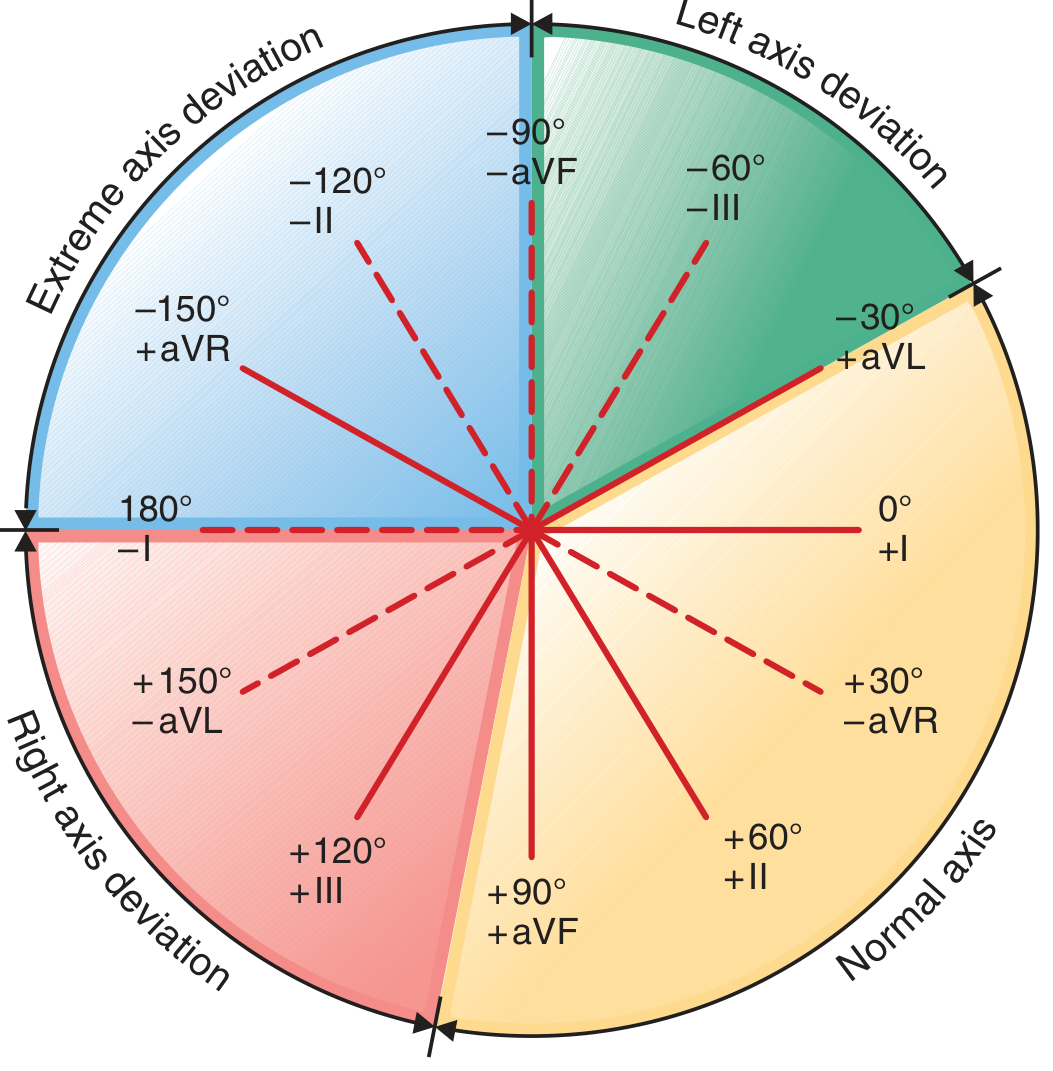
7. The Electrical Axis
The QRS axis is the mean direction of ventricular depolarization in the frontal plane.
| Axis | Range | Causes if abnormal |
|---|---|---|
| Normal | -30° to +90° (some say +100°) | - |
| Left axis deviation (LAD) | More negative than -30° | LV hypertrophy, left anterior fascicular block, inferior MI |
| Right axis deviation (RAD) | More positive than +90° to +100° | RV overload, lateral MI, left posterior fascicular block, normal in children |
| Extreme ("northwest") | -90° to ±180° | Severe disease, electrode reversal |
Quick bedside method: Look at leads I and aVF:
- Both positive → Normal axis
- I positive, aVF negative → Check aVL (LAD if positive)
- I negative, aVF positive → RAD
8. P Wave: What it Tells You
- Normal sinus P wave: Upright in lead II, inverted in aVR (because atrial depolarization travels down and left, toward lead II positive pole)
- Retrograde P wave (negative in II, positive in aVR): Pacemaker coming from AV junction or lower atrium
- V1 may show a biphasic P wave: small positive component (right atrium) followed by a small negative component (left atrium, normal if <1 mm²)
9. Systematic Approach to Reading Any ECG
Use this step-by-step approach every time (from Harriet Lane Handbook):
- Rate - Calculate using 300 rule or R-R interval
- Rhythm - Is there a P before every QRS? Is P upright in I and aVF? Is R-R regular?
- Sinus rhythm = every QRS preceded by a P wave + P axis normal (upright in I and aVF)
- Axis - Normal, LAD, or RAD?
- Intervals - Measure PR, QRS duration, QTc
- P wave morphology - Size, shape, biphasic in V1?
- QRS morphology - R-wave progression, abnormal Q waves, bundle branch block?
- ST segment and T waves - Elevation, depression, inversion?
- U waves - Present? Prominent?
10. Key Normal Values at a Glance
| Parameter | Normal |
|---|---|
| Heart rate | 60-100 bpm |
| PR interval | 120-200 ms (3-5 small squares) |
| QRS duration | <100-110 ms (<2.5 small squares) |
| QTc (men) | ≤450 ms |
| QTc (women) | ≤460 ms |
| P wave height | <2.5 mm |
| P wave duration | <120 ms |
| QRS axis | -30° to +90° |
What's Next?
Once you're comfortable with these basics, you can build toward:
- Bundle branch blocks (LBBB vs RBBB)
- Chamber hypertrophy (LVH, RVH criteria)
- Ischemia and infarction (ST changes, Q waves, lead groupings by territory)
- Arrhythmias (atrial fibrillation, SVT, VT, heart blocks)
- Electrolyte abnormalities on ECG (hyper/hypokalemia, hypercalcemia)
Want me to continue with any of these next topics?
This is a shared conversation. Sign in to Orris to start your own chat.