
Divide all glomerulonephrits into nephrotic and nephritic
- Nephrotic: MCD, FSGS, Membranous, Diabetic nephropathy, Amyloidosis
- Nephritic: Post-streptococcal GN, IgA nephropathy, MPGN, Lupus nephritis, Anti-GBM disease, ANCA vasculitis
glomerulonephritis nephrotic nephritic classification comparison table
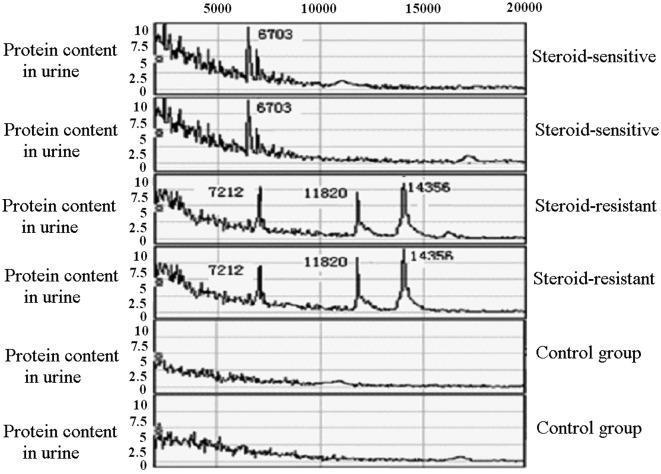
A comparison chart of mass spectra illustrating differentially expressed urinary protein profiles in children with primary nephrotic syndrome (PNS). The image displays six spectral plots categorized into three groups: Steroid-sensitive (SSNS), Steroid-resistant (SRNS), and a healthy Control group. The x-axis represents the mass-to-charge ratio (m/e) ranging from 5,000 to 20,000, while the y-axis indicates protein intensity. The Steroid-sensitive group shows a dominant diagnostic peak at m/e 6703. In contrast, the Steroid-resistant group is characterized by a distinct proteomic signature with three prominent peaks at m/e 7212, 11820, and 14356. The Control group exhibits a relatively flat baseline with negligible peak expression at these specific values. This diagnostic visual serves to identify potential protein biomarkers for differentiating between steroid treatment responses in pediatric nephrology, facilitating the classification of steroid-resistant vs. steroid-sensitive nephrotic syndrome based on urinary proteomic analysis.
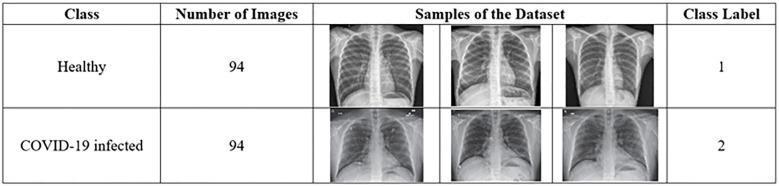
A comparison chart and diagnostic image summary detailing a dataset for automated respiratory disease classification. The table is divided into two primary categories: 'Healthy' (Class Label 1) and 'COVID-19 infected' (Class Label 2), each containing 94 images for a total of 188 chest X-rays. The 'Samples of the Dataset' column provides a side-by-side visual comparison of posterior-anterior (PA) chest radiographs. The 'Healthy' images demonstrate clear lung fields with distinct costophrenic angles and normal bronchovascular markings. In contrast, the 'COVID-19 infected' samples exhibit characteristic radiological abnormalities, including increased pulmonary opacity, hazy ground-glass opacities, and patchy consolidation across the lung parenchyma, which are hallmark signs of viral pneumonia. This visual representation serves to illustrate the feature differences utilized in machine learning models for detecting COVID-19 manifestations in clinical imaging.
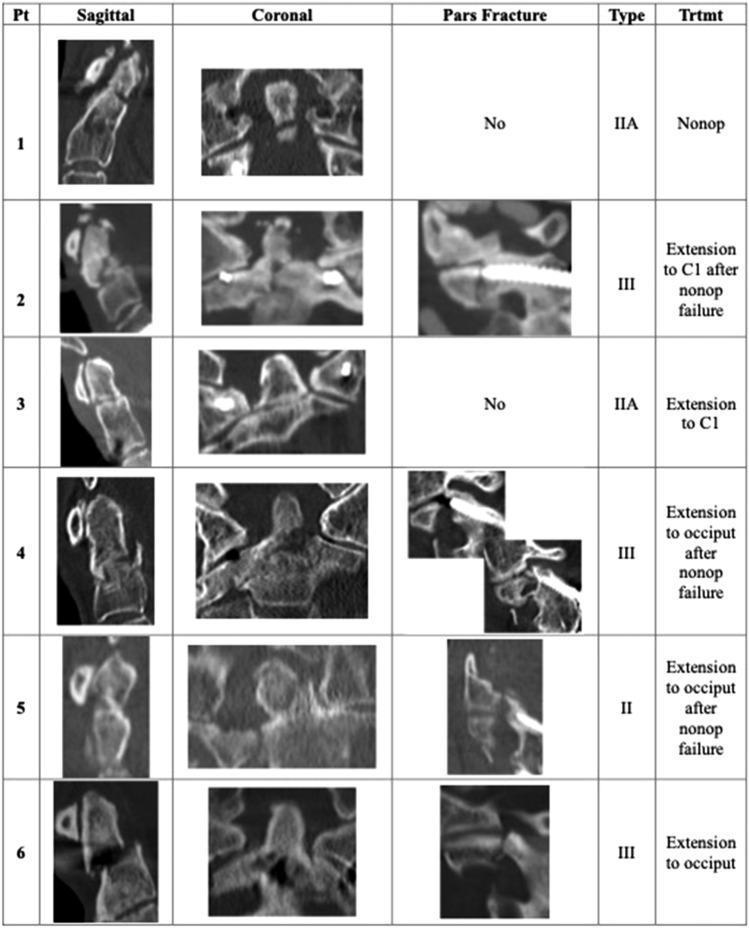
A composite clinical comparison chart showing CT scan images and classification data for proximal junctional dens fractures in six patients (Pt 1–6). The table is organized into five columns: sagittal imaging, coronal imaging, pars fracture status, fracture type, and treatment (Trtmt). The sagittal and coronal CT slices illustrate various C2 odontoid and body fracture morphologies, including some with pre-existing posterior spinal instrumentation. The 'Pars Fracture' column uses both text and focused CT images to indicate the presence or absence of a C2 pars fracture. The 'Type' column categorizes injuries according to a classification system (Type II, IIA, and III), while the 'Trtmt' column details clinical management, such as non-operative care (Nonop) or surgical extension to C1 or the occiput, often following non-operative failure. This visual resource serves as an educational tool for neuroradiology and orthopedic spine surgery, demonstrating the relationship between fracture morphology, classification, and management strategies in the context of adult spinal deformity.
Glomerulonephritis: Nephrotic vs. Nephritic Classification
The Core Distinction
NEPHROTIC SYNDROME - Primary GN Causes
1. Minimal Change Disease (MCD)
- Most common nephrotic syndrome in children (peak age 1-7 years)
- Glomeruli appear normal on light microscopy - no immune deposits on immunofluorescence
- EM: diffuse effacement (fusion) of podocyte foot processes
- Selective proteinuria (mainly albumin)
- Pathogenesis: circulating factors injure podocytes; possible antibodies against slit diaphragm proteins
- Excellent steroid response in children (>90%); slower and more relapsing in adults
- Robbins Basic Pathology, p. 504-505
2. Focal Segmental Glomerulosclerosis (FSGS)
- Sclerosis affects some glomeruli (focal) and only part of each affected glomerulus (segmental)
- Most common primary GN progressing to end-stage renal disease in the US
- Forms: primary (idiopathic, ~30% of adult nephrotic syndrome), secondary (HIV, heroin, obesity, nephron loss, genetic mutations in nephrin/podocin)
- Proteinuria is non-selective; poor steroid response
- Recurrence after transplant suggests a circulating permeability factor
- Robbins Basic Pathology, p. 505-507
3. Membranous Nephropathy (MGN)
- Leading cause of nephrotic syndrome in middle-aged adults
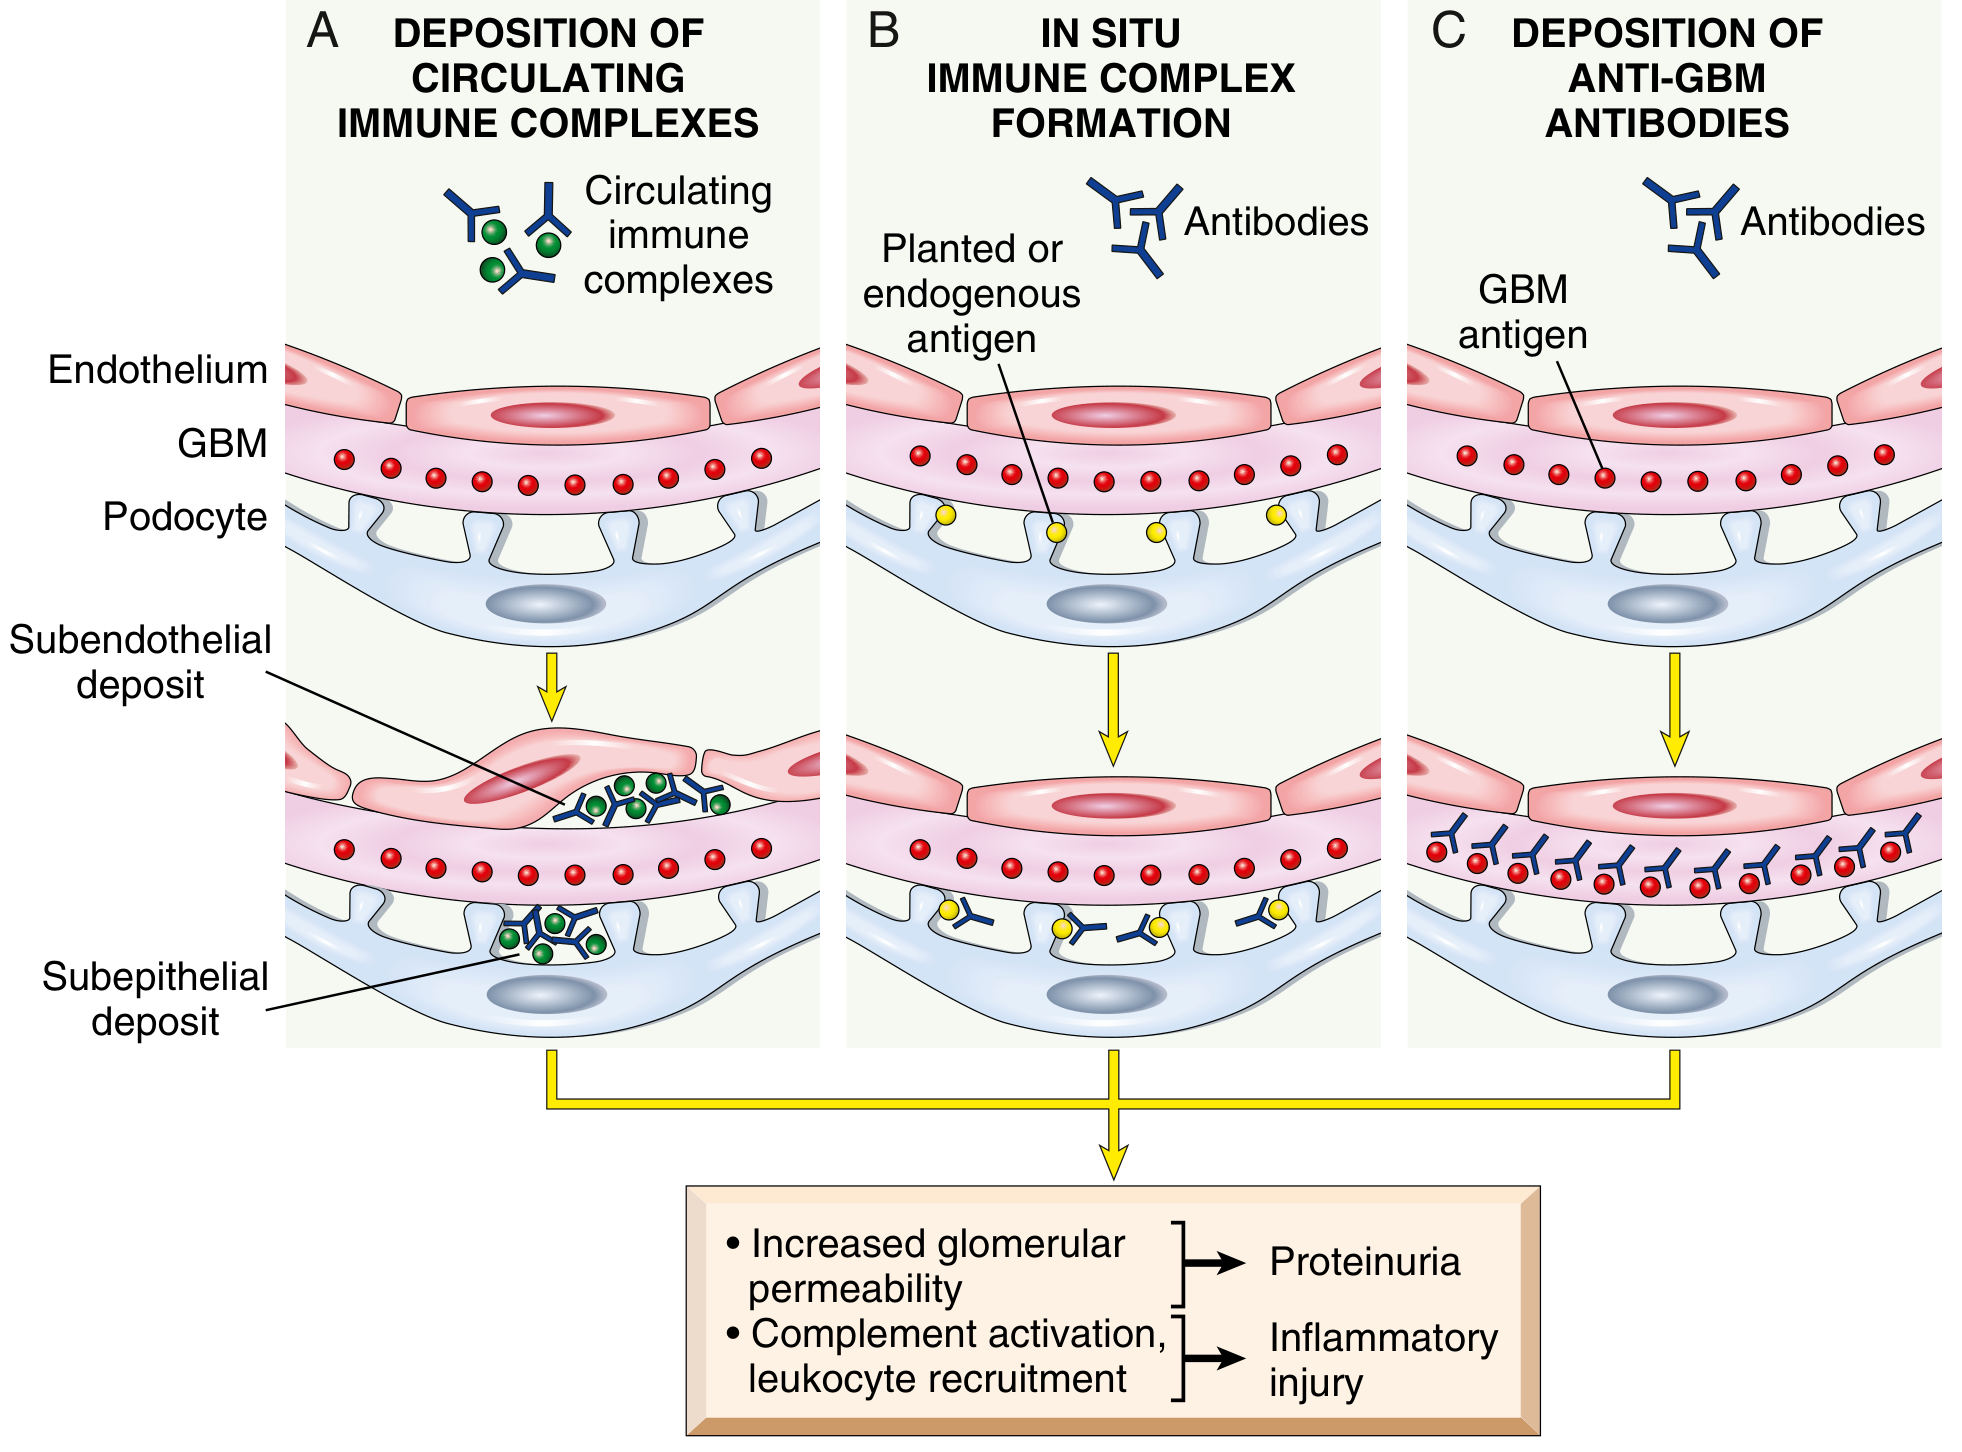
- Mechanism: in situ immune complex formation - antibodies (most often anti-PLA2R antibody in primary form) bind to podocyte surface antigens
- LM: diffuse thickening of the GBM; EM: subepithelial "spike and dome" deposits
- IF: granular IgG and C3 along capillary loops
- Secondary causes: SLE, HBV/HCV, malignancy (lung, colon), drugs (gold, penicillamine)
- ~30-40% progress to renal failure over decades
- Robbins Basic Pathology, p. 507-508
4. Membranoproliferative GN (MPGN)
- Characterized by GBM thickening AND mesangial hypercellularity ("tram-track" double contour on LM)
- Type I: immune complex-mediated (HCV, SLE, cryoglobulinemia) - subendothelial deposits
- Type II (Dense Deposit Disease): dysregulated alternative complement pathway (C3 nephritic factor); intramembranous deposits
- Clinical presentation: can be either nephrotic or nephritic, making it the classic "overlap" disease
- Progressive course; poor prognosis without treatment
- Robbins Basic Pathology, p. 508
5. C3 Glomerulopathy
- Subset of MPGN characterized by dysregulated complement activation (C3 deposits with little/no immunoglobulin)
- Includes Dense Deposit Disease (MPGN type II)
- Caused by C3 nephritic factor, CFH mutations, or other complement regulatory defects
Secondary Causes of Nephrotic Syndrome (not primary GN)
| Condition | Mechanism |
|---|---|
| Diabetic nephropathy | Mesangial expansion, GBM thickening (Kimmelstiel-Wilson nodules); most common cause of CKD in the US |
| Amyloidosis | Amyloid fibrils deposited in mesangium and capillary walls; Congo red positive |
| Lupus nephritis (Class V - membranous) | Immune complex deposition on subepithelial aspect |
NEPHRITIC SYNDROME - Primary GN Causes
1. Acute Postinfectious (Post-Streptococcal) GN
- Classic cause: nephritogenic strains of Group A beta-hemolytic streptococci (pharynx or skin); 1-4 weeks after infection
- Also: staphylococcal, pneumococcal, HBV, HCV, mumps
- Mechanism: glomerular deposition of immune complexes (streptococcal antigens + antibodies) → complement activation → neutrophilic inflammation
- LM: diffuse hypercellularity (endothelial and mesangial proliferation + neutrophil infiltration)
- EM: subepithelial "humps" (electron-dense deposits)
- IF: granular IgG and C3 ("starry sky" pattern)
- Clinical: hematuria, oliguria, hypertension, mild proteinuria; hypocomplementemia (low C3)
- Prognosis: excellent in children (>95% recover); more guarded in adults
- Robbins Basic Pathology, p. 509-510
2. Rapidly Progressive (Crescentic) GN (RPGN)
- Most severe form of nephritic syndrome - renal failure in weeks to months if untreated
- Crescents = parietal epithelial cell proliferation + monocyte/macrophage migration filling Bowman's space
- Three immunopathologic types:
- Type I (Anti-GBM, ~20%): Linear IgG on IF; Goodpasture syndrome if pulmonary hemorrhage co-exists
- Type II (Immune complex, ~25%): Granular IF; secondary to post-infectious GN, lupus, IgA nephropathy
- Type III (Pauci-immune, ~55%): No/scanty IF; ANCA-positive (MPO or PR3); associated with GPA/MPA
- Treatment: immunosuppression (steroids + cyclophosphamide) ± plasmapheresis
- Robbins Basic Pathology, p. 510-511
3. IgA Nephropathy (Berger's Disease)
- Most common primary GN worldwide
- Mechanism: poorly glycosylated IgA1 complexes (IgA + anti-IgA IgG) deposit in the mesangium → complement activation
- Triggered or worsened by mucosal infections (respiratory, GI) - "synpharyngitic" hematuria
- LM: mesangial widening and hypercellularity
- IF: dominant mesangial IgA deposits (C3 + properdin by alternative pathway)
- Clinical: recurrent episodes of gross hematuria (often concurrent with URIs), persistent microscopic hematuria; nephrotic syndrome in <10%
- Course: 25-50% reach ESRD over 20 years
- Robbins Basic Pathology, p. 512-513
4. Lupus Nephritis (Proliferative Classes)
- Classes III (focal) and IV (diffuse) present as nephritic syndrome with sub/nephrotic range proteinuria
- Class IV most severe: diffuse proliferative GN with "wire-loop" capillary changes on LM
- "Full-house" immunofluorescence (IgG, IgA, IgM, C3, C1q)
- Hypocomplementemia (both C3 and C4 low - classical pathway activation)
- Class V (membranous lupus) presents as nephrotic syndrome
- Robbins Basic Pathology, p. 511-512
5. Anti-GBM (Goodpasture) Disease
- Autoantibodies to the NC1 domain of the α3 chain of type IV collagen → linear IgG on GBM
- If lung involvement: alveolar hemorrhage = Goodpasture syndrome
- Isolated renal involvement = anti-GBM GN
- Clinically presents as RPGN
- Robbins Basic Pathology, p. 510
Summary Comparison Table
| Feature | Nephrotic | Nephritic |
|---|---|---|
| Proteinuria | >3.5 g/day (massive) | <3.5 g/day (mild-moderate) |
| Hematuria | Absent or mild | Prominent; RBC casts |
| Edema | Massive (periorbital, dependent) | Mild (due to fluid retention) |
| Hypertension | Absent or mild | Common |
| Azotemia | Absent early | Present (oliguria) |
| GFR | Normal early | Reduced |
| Core mechanism | Podocyte/BM injury → protein leak | Inflammatory proliferation → capillary wall damage |
| Histology | Podocyte foot process effacement; no proliferation | Hypercellularity, crescents, inflammatory infiltrate |
Diseases That Can Cause Both
- MPGN - often mixed nephrotic-nephritic
- Lupus nephritis - Class III/IV (nephritic) vs. Class V (nephrotic)
- IgA nephropathy - usually nephritic, but can rarely be nephrotic
- RPGN - nephritic with occasional nephrotic-range proteinuria
Lumpy dumpy deposit glomerulonephrits in membrnous
"Lumpy-Bumpy" Deposits in Glomerulonephritis
What the Term Means
Why Deposits Are Granular (The Mechanism)
- Circulating immune complexes that deposit in the GBM (subendothelial or subepithelial)
- In situ immune complex formation - antibodies binding to planted or intrinsic antigens in the GBM in a patchy distribution
Lumpy-Bumpy in Membranous Nephropathy Specifically
IF Appearance in Membranous Nephropathy
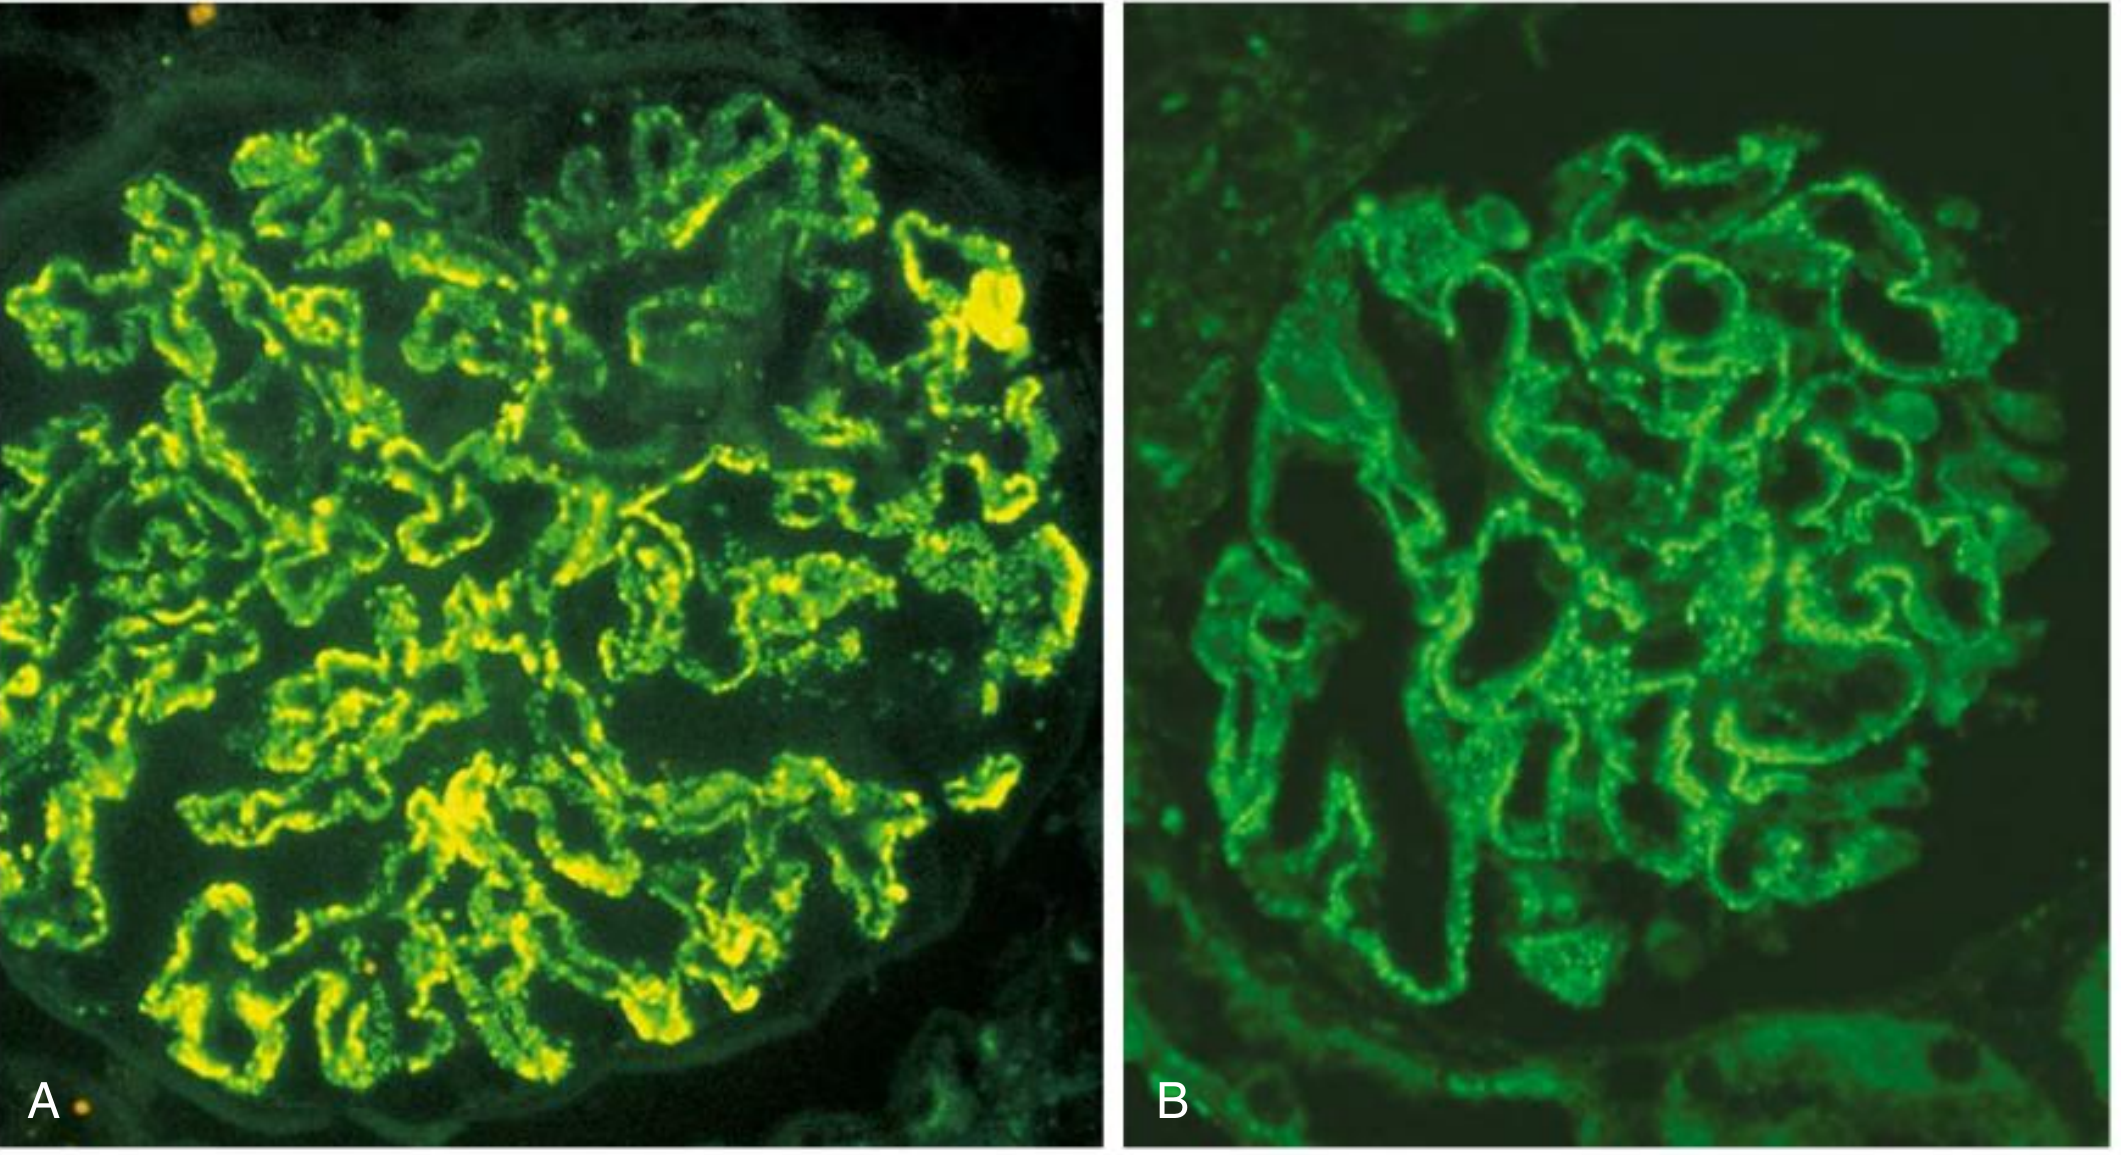
- Pattern: Diffuse, finely granular deposits of IgG along the outer surface of all capillary walls
- Distribution: Global and uniform - every capillary loop in every glomerulus is involved
- Staining: IgG (dominant, especially IgG4 in primary MN) + C3
- In primary MN: antibodies target PLA2R (phospholipase A2 receptor) on podocytes; PLA2R staining colocalizes with IgG in a similar finely granular distribution
Granular vs. Linear: The Critical Comparison
| Feature | Granular (Lumpy-Bumpy) | Linear |
|---|---|---|
| Mechanism | Immune complex deposition (circulating or in situ) | Anti-GBM antibody binding continuously throughout GBM |
| IF appearance | Irregular clumps / granules | Smooth, continuous ribbon along capillary wall |
| Diseases | MGN, post-streptococcal GN, lupus nephritis, IgA nephropathy, MPGN | Anti-GBM disease (Goodpasture syndrome) |
The Subtlety: Coarse vs. Fine Granularity
| Coarse granular | Fine granular | |
|---|---|---|
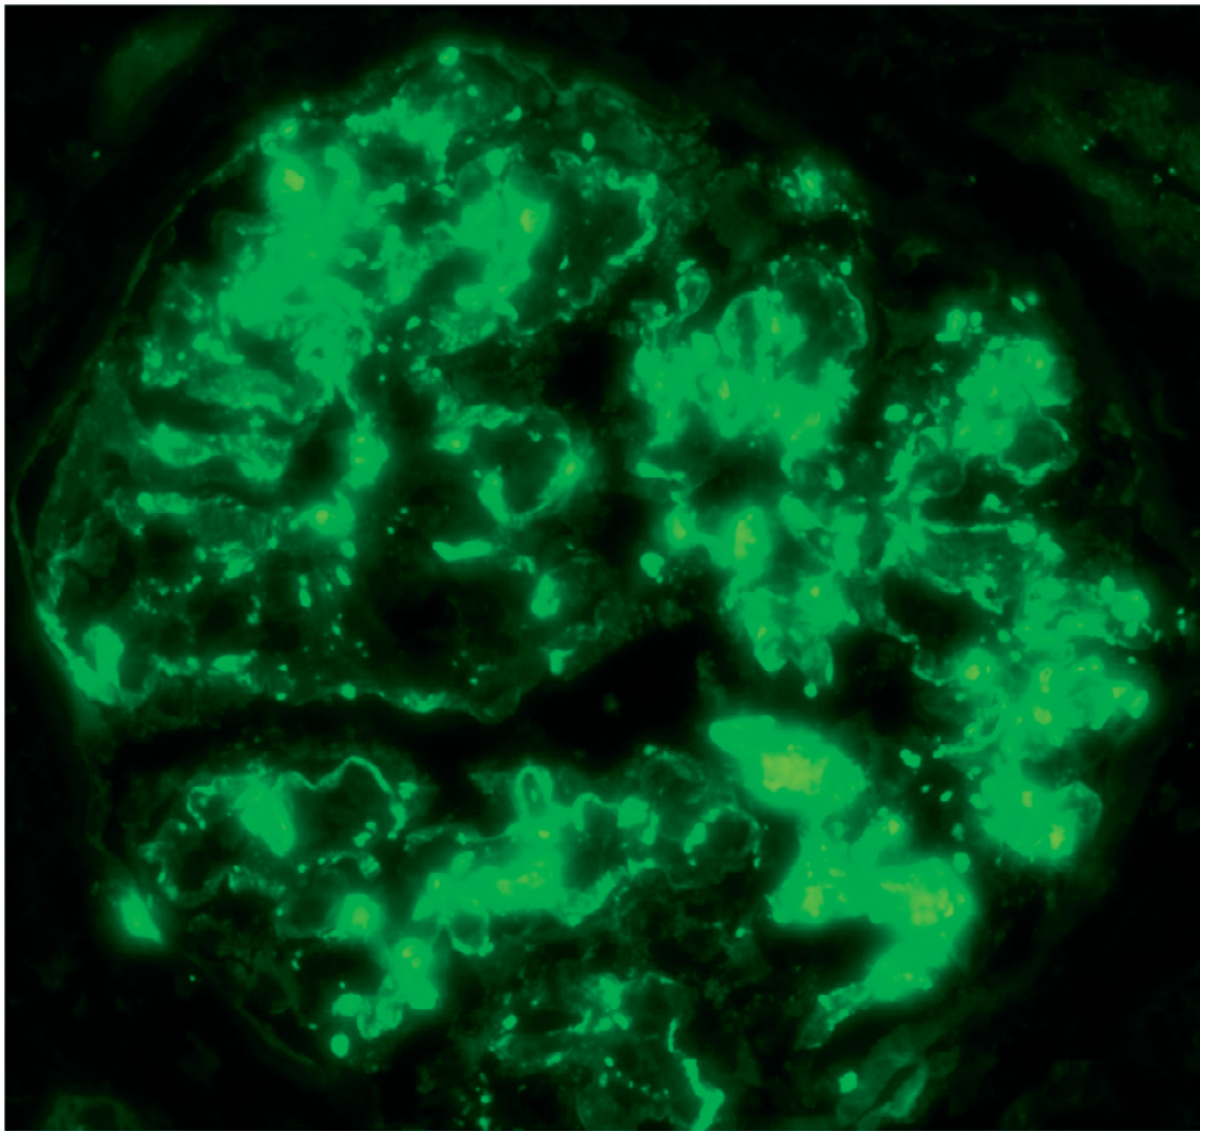
| Seen in | Post-streptococcal GN ("lumpy-bumpy" in the classical sense) | Membranous nephropathy |
| Location | Capillary walls + mesangium | Exclusively capillary walls (subepithelial) |
| Staining | Intense C3 >> IgG | IgG (dominant) + C3 |
Summary
- "Lumpy-bumpy" = granular IF pattern = immune complex disease (not anti-GBM)
- Membranous nephropathy produces this pattern as finely granular IgG deposits along the outer (subepithelial) capillary wall surface
- The mechanism is in situ immune complex formation: anti-PLA2R antibodies + podocyte antigen → subepithelial deposits
- Post-streptococcal GN produces a coarser lumpy-bumpy pattern because the immune complex humps are larger and more irregularly distributed
- The lumpy-bumpy pattern contrasts sharply with the smooth linear pattern of anti-GBM (Goodpasture) disease