
pulse in Aortic stenosis and why?
aortic stenosis pulse waveform pulsus parvus tardus
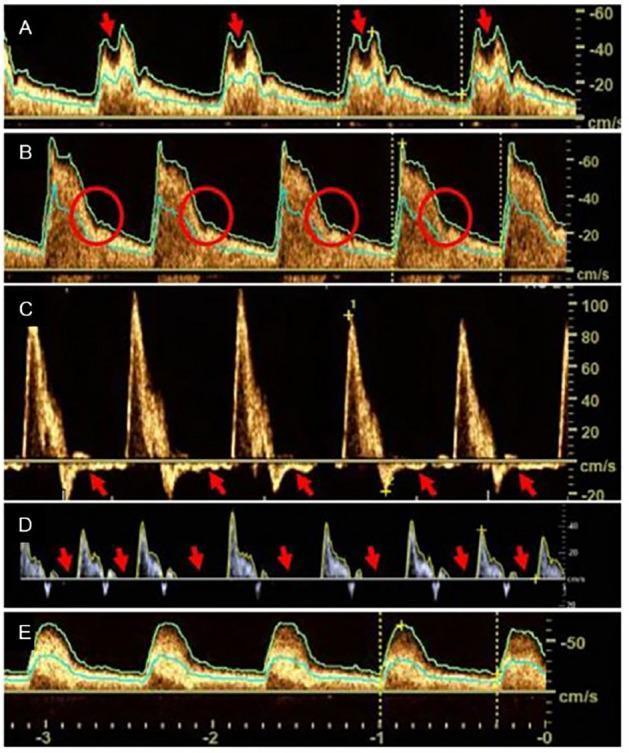
This diagnostic image set consists of five neurovascular ultrasound (nvUS) spectral Doppler waveforms (Panels A–E) illustrating pathological flow profiles in the carotid arteries associated with aortic valve disease. Panel A displays a 'bisferious pulse' (pulsus bisferiens) in the internal carotid artery (ICA), characterized by two systolic peaks marked by red arrows. Panel B shows the ICA with an absent dicrotic notch, indicated by red circles during the early diastolic phase. Panel C demonstrates 'diastolic reversal' in the common carotid artery (CCA), with red arrows highlighting retrograde flow below the baseline during diastole, a classic sign of severe aortic regurgitation. Panel D shows 'zero diastole,' where diastolic flow velocity reaches the baseline (red arrows), indicating high resistance or significant valvular pathology. Panel E illustrates 'pulsus tardus et parvus' in the ICA, characterized by a prolonged systolic upstroke (tardus) and low peak systolic velocity (parvus), typically indicative of aortic valve stenosis. These Doppler waveforms serve as clinical markers for secondary hemodynamic effects of valvular heart disease on cerebral perfusion.
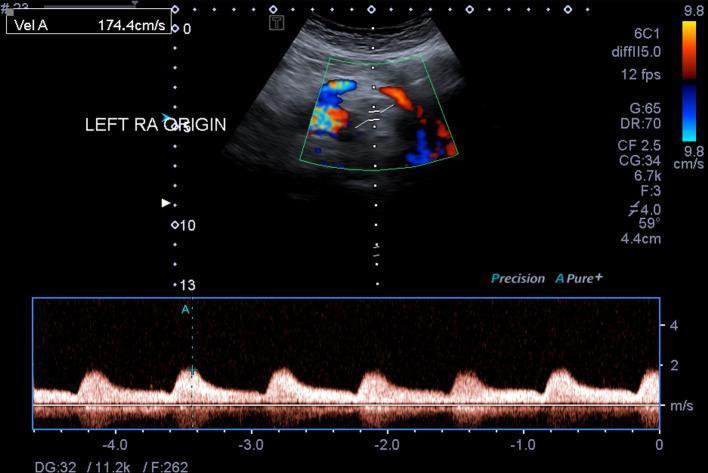
This diagnostic image is a duplex ultrasound combining color Doppler and spectral pulse wave Doppler of the abdominal aorta at the level of the left renal artery (RA) origin. The upper panel displays a color Doppler image showing a mosaic pattern of red, blue, and yellow hues within the vessel, indicating turbulent flow and aliasing. The lower panel displays a spectral waveform characterized by a 'tardus parvus' morphology. This pattern is defined by a delayed systolic upstroke (prolonged acceleration time) and low-amplitude, rounded peaks with a decreased peak systolic velocity (PSV), here measured at approximately 174.4 cm/s. Such hemodynamic findings are clinically significant as they typically occur distal to a high-grade arterial stenosis or obstruction, representing the dampening of the pulse wave as it passes through a narrowed segment of the aorta. This educational visual is essential for understanding vascular hemodynamics and the diagnostic criteria for aortic or renal artery pathology in radiology and vascular medicine.
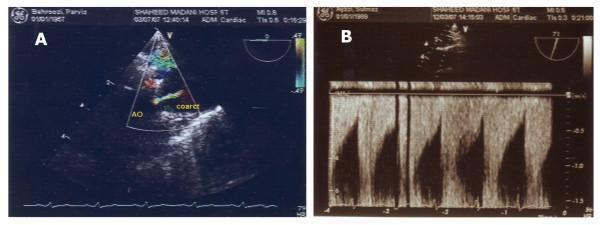
This dual-panel diagnostic image displays Transesophageal Echocardiography (TEE) and Doppler ultrasound findings of aortic coarctation. Panel A presents a color Doppler TEE of the thoracic aorta (AO). It highlights a focal narrowing labeled 'coarct', where turbulent, high-velocity blood flow is visualized as a multicolored mosaic pattern (aliasing), indicating significant stenosis distal to the left subclavian artery. Panel B shows a pulse-wave Doppler spectral waveform obtained at a site distal to the coarctation. The waveform exhibits a characteristic 'parvus-tardus' pattern, defined by a delayed systolic upstroke (tardus), a rounded or blunted systolic peak, and a low overall amplitude (parvus). This dampened flow profile is a hallmark hemodynamic finding of hemodynamically significant proximal arterial obstruction. Together, these images demonstrate the anatomical and functional evaluation of secondary hypertension caused by congenital aortic narrowing in an adult patient.
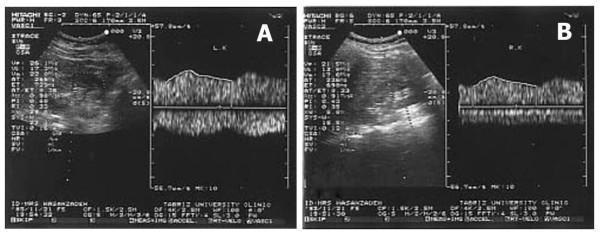
Two-panel diagnostic image featuring Doppler ultrasound spectral waveforms of the left (A) and right (B) renal arteries. Each panel includes a B-mode grayscale image of the renal parenchyma alongside its corresponding pulsed-wave Doppler trace. Both waveforms exhibit a classic parvus-tardus pattern, characterized by a dampened appearance with diminished peak systolic velocities (pulsus parvus) and a delayed, prolonged systolic upstroke or acceleration time (pulsus tardus). The systolic peaks are notably rounded rather than sharp, indicating significant proximal arterial obstruction or stenosis. These findings are clinically significant in the evaluation of secondary hypertension, suggesting hemodynamically significant stenosis upstream from the point of sampling, such as renal artery stenosis or aortic coarctation. Quantitative hemodynamic indices and velocity measurements are displayed on the left margin of each sonogram. This visual is intended for medical education regarding vascular sonography and diagnostic pathways for renovascular disease.
Pulse in Aortic Stenosis
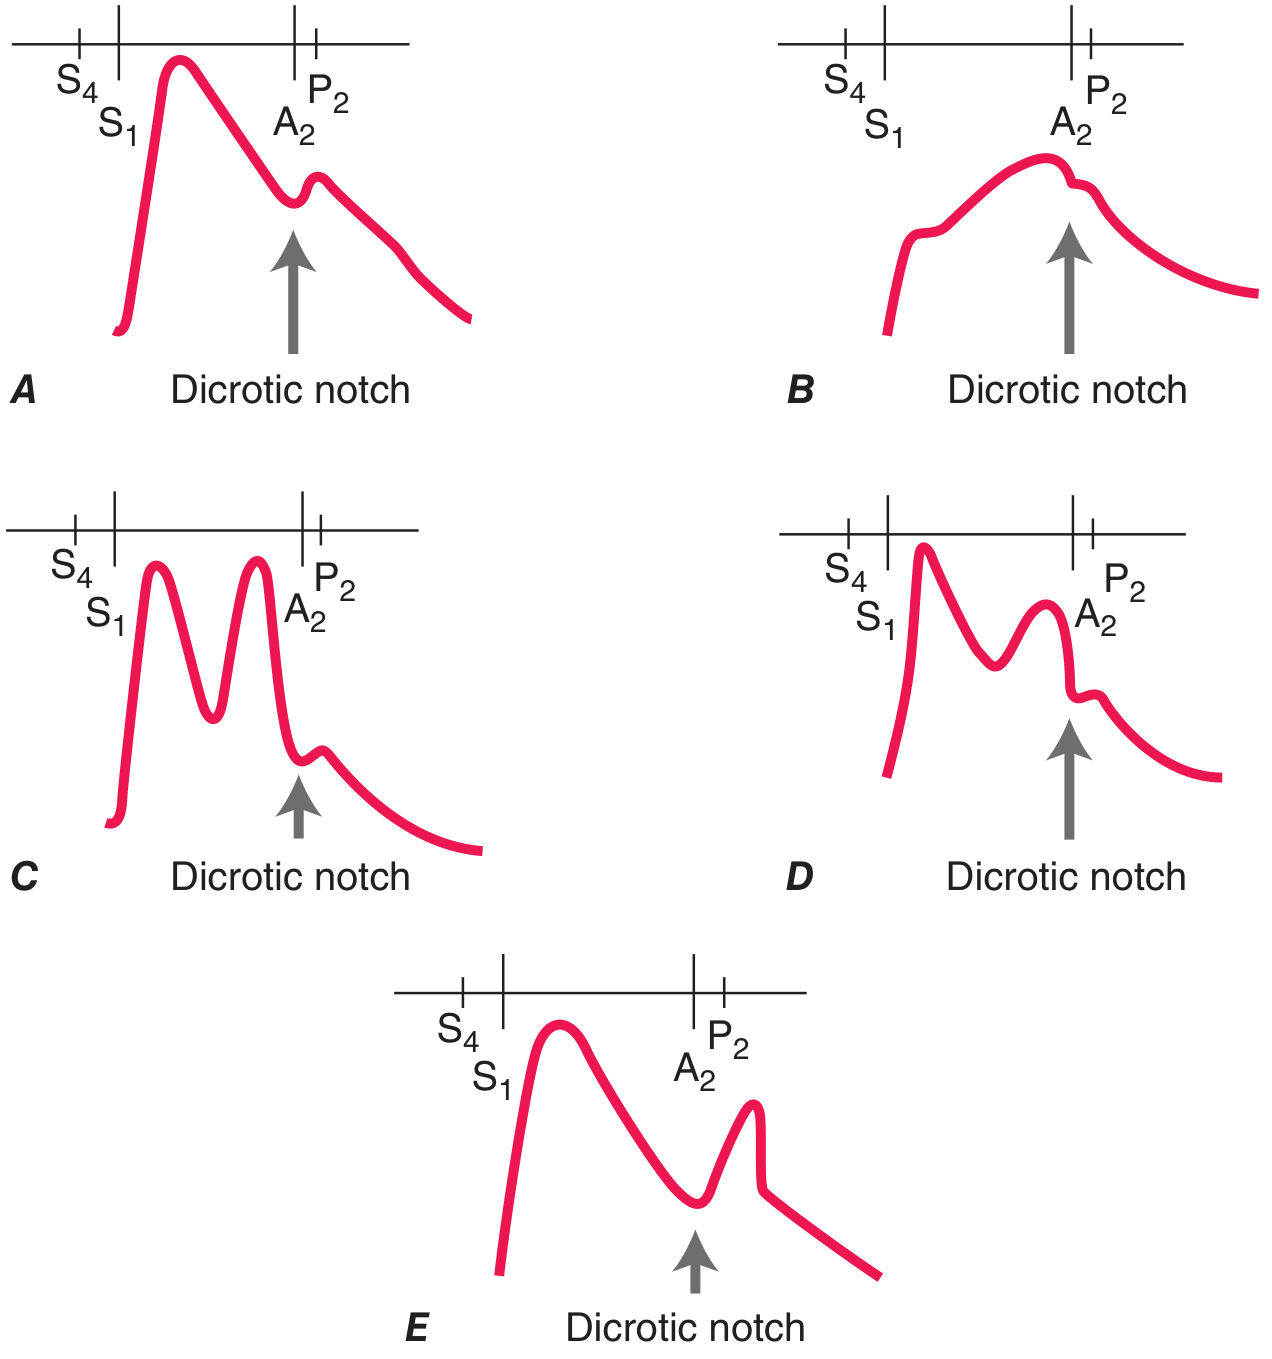
The Classic Pulse: Pulsus Parvus et Tardus
| Component | Meaning | Feature |
|---|---|---|
| Parvus | Small/weak | Reduced amplitude, narrow pulse pressure |
| Tardus | Slow/delayed | Slurred upstroke, delayed peak |
Why Does This Pulse Occur? (Pathophysiology)
1. Parvus (Small Volume) - Why?
- The narrowed valve orifice (normal ~3-4 cm²; severe AS <1 cm²) physically limits the volume of blood ejected per beat into the aorta
- Reduced stroke volume = reduced pulse pressure
- Systolic pressure rise in the aorta is blunted
- Result: a pulse of low amplitude and narrow pulse pressure
2. Tardus (Slow-Rising) - Why?
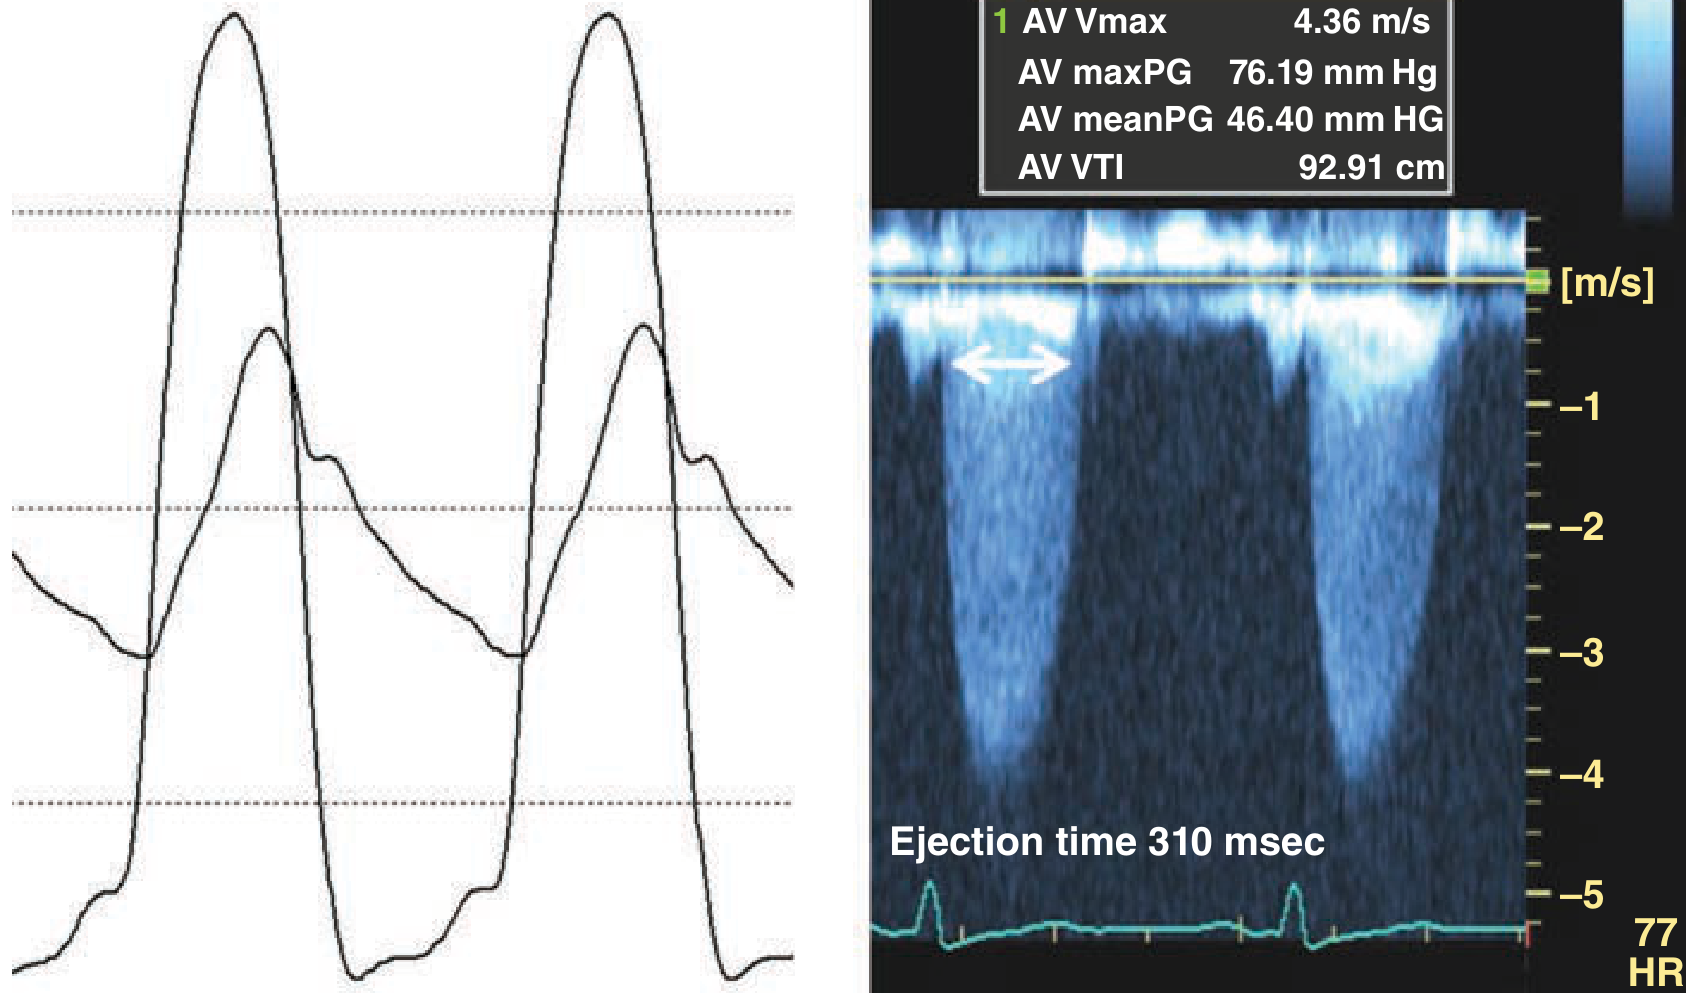
- Blood is forced through a tiny orifice under high LV pressure - this is a slow, turbulent process
- The rate of rise of aortic pressure is prolonged because ejection takes longer to overcome the fixed obstruction
- The systolic peak is reached late in systole (delayed) instead of early-mid systole as normal
- This is also reflected on Doppler echo as a late-peaking continuous-wave velocity contour and on cardiac catheterization as a delayed upstroke on central aortic pressure tracing
- Result: a slow, slurred upstroke reaching a low, late peak
3. Additional Feature: Anacrotic Notch
- Some severe AS patients also show an anacrotic pulse - a small positive notch or shoulder on the ascending limb of the carotid upstroke
- This represents turbulent, interrupted ejection against the stenotic valve
- A palpable thrill or "shudder" may also be felt at the carotid
Waveform Comparison (from Harrison's, Figure 246-2)
Aortic Pressure Tracing in Severe AS (from Fuster/Hurst)
Important Clinical Caveats
| Caveat | Explanation |
|---|---|
| Elderly patients | Carotid upstroke may appear normal or even brisk despite severe AS because of arterial stiffening - the calcified, non-compliant vessels produce a falsely exaggerated pulse. Can mislead clinician. |
| Grading is separate | Tardus and parvus should each be graded 1-4+ independently; one may dominate |
| Not exclusive to valvular AS | Parvus and tardus also occur in subvalvular (subaortic membrane) and supravalvular AS - but in those cases, A2 is preserved (normal aortic valve) |
| Contrast with HOCM | In hypertrophic obstructive cardiomyopathy (HOCM), the pulse has a brisk initial upstroke (normal/bounding, "spike-and-dome" or bisferiens) - the opposite of AS - because obstruction is dynamic and starts mid-systole, not at valve opening |
| Brachioradial delay | A useful bedside sign: palpating radial and brachial pulses simultaneously reveals a delay at the radial site, indicating slow transmission |
Summary
In aortic stenosis, the pulse is pulsus parvus et tardus because the stenotic valve reduces the volume of blood ejected (parvus) and slows the rate at which it is ejected into the aorta (tardus). The result is a weak, slow-rising carotid pulse that correlates with severity - more pronounced tardus = more severe stenosis.
- Fuster and Hurst's The Heart, 15th Ed., p. 83 - Abnormalities of Arterial Pulse
- Harrison's Principles of Internal Medicine, 22nd Ed. (2025), p. 1906 - Cardiovascular Examination
- Tintinalli's Emergency Medicine - Clinical Features of AS