
Workup for delayed puberty
Workup for delayed puberty
delayed puberty workup evaluation diagnosis
delayed puberty evaluation algorithm flowchart
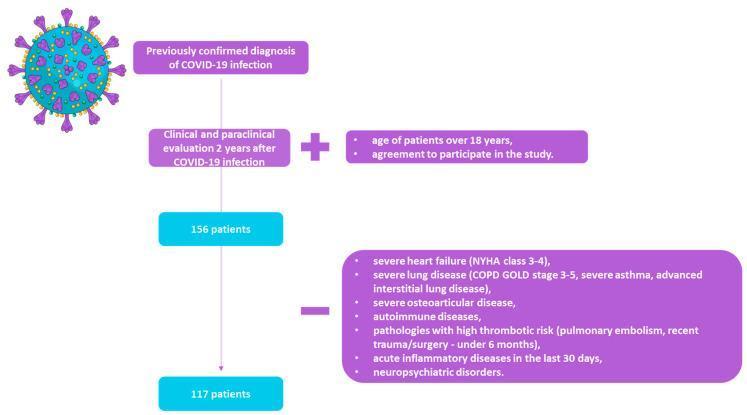
A structured flowchart illustrating the patient selection process for a long-term COVID-19 follow-up study. The algorithm begins with an initial cohort of patients with a previously confirmed COVID-19 diagnosis who underwent clinical and paraclinical evaluation 2 years post-infection. Inclusion criteria are listed as age over 18 years and agreement to participate, resulting in an initial group of 156 patients. The flowchart then applies specific exclusion criteria, including severe heart failure (NYHA class 3-4), severe lung diseases (COPD GOLD stage 3-5, severe asthma, advanced interstitial lung disease), severe osteoarticular disease, autoimmune diseases, high thrombotic risk pathologies (pulmonary embolism, recent trauma/surgery), acute inflammatory diseases, and neuropsychiatric disorders. The final study group consists of 117 patients. The diagram uses purple rounded rectangles for criteria and blue rectangles for patient counts, connected by logical operators (+) and (-). An illustrative SARS-CoV-2 virion icon is included for thematic context. This flowchart is used to document study methodology in pulmonary rehabilitation and COVID-19 research.
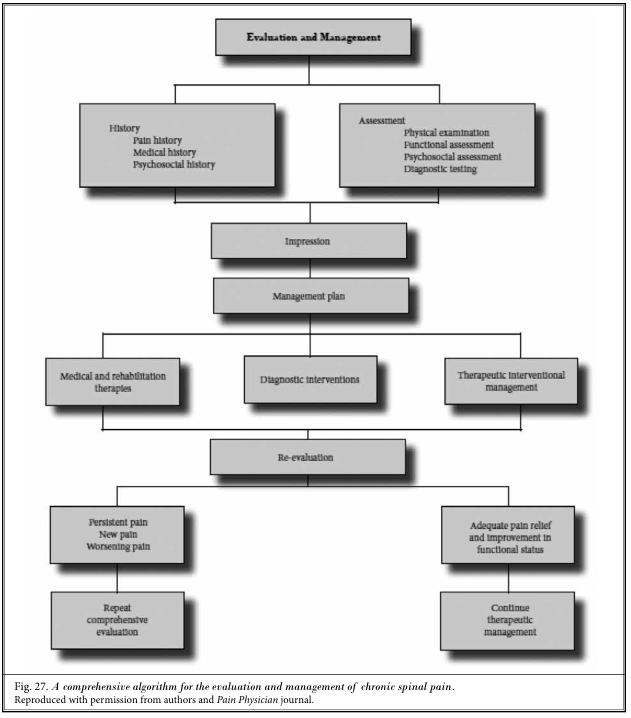
Summary : This figure presents a comprehensive flowchart algorithm for the evaluation and management of chronic spinal pain, detailing the stepwise process from initial assessment through re-evaluation and ongoing management. flowchart: # Nodes : • Evaluation and Management (rectangle) • History (rectangle): Pain history, Medical history, Psychosocial history • Assessment (rectangle): Physical examination, Functional assessment, Psychosocial assessment, Diagnostic testing • Impression (rectangle) • Management plan (rectangle) • Medical and rehabilitation therapies (rectangle) • Diagnostic interventions (rectangle) • Therapeutic interventional management (rectangle) • Re-evaluation (rectangle) • Persistent pain, New pain, Worsening pain (rectangle) • Repeat comprehensive evaluation (rectangle) • Adequate pain relief and improvement in functional status (rectangle) • Continue therapeutic management (rectangle) # Connectors : • Top-down arrows connect each step sequentially. • After "Management plan," three branches lead to "Medical and rehabilitation therapies," "Diagnostic interventions," and "Therapeutic interventional management." • All three branches converge at "Re-evaluation." • "Re-evaluation" splits into two branches: – Left: "Persistent pain, New pain, Worsening pain" → "Repeat comprehensive evaluation" – Right: "Adequate pain relief and improvement in functional status" → "Continue therapeutic management" # Layout : • Vertically oriented flowchart with multiple parallel branches at the management plan stage. • Merging and splitting of branches at re-evaluation, forming a decision point. • All nodes are rectangles with shadow effects for emphasis. # Analysis : • The flowchart provides a systematic, iterative approach to chronic spinal pain management. • Initial steps focus on thorough history and assessment, followed by formulation of an impression and management plan. • Management options are divided into medical/rehabilitation, diagnostic, and interventional therapies. • Re-evaluation is a critical decision point: persistent or worsening pain triggers a repeat evaluation, while adequate relief leads to continued management. • The algorithm emphasizes ongoing assessment and adaptation of treatment based on patient response.
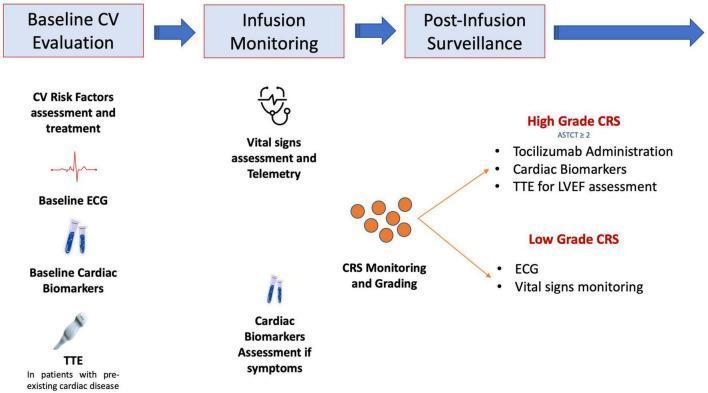
This flowchart delineates a diagnostic and management strategy for cardiovascular (CV) complications in patients undergoing CAR-T cell therapy. The clinical algorithm is organized into three sequential phases: Baseline CV Evaluation, Infusion Monitoring, and Post-Infusion Surveillance. The baseline phase involves CV risk factor assessment, ECG, baseline cardiac biomarkers (e.g., troponin, NT-proBNP), and transthoracic echocardiography (TTE) for patients with pre-existing heart disease. The infusion phase focuses on vital sign assessment, telemetry, monitoring for Cytokine Release Syndrome (CRS), and symptom-driven biomarker assessment. Post-infusion surveillance is risk-stratified based on American Society for Transplantation and Cellular Therapy (ASTCT) CRS grading. High-grade CRS (ASTCT ≥2) triggers tocilizumab administration, repeat cardiac biomarkers, and TTE for Left Ventricular Ejection Fraction (LVEF) assessment. Low-grade CRS requires continued ECG and vital signs monitoring. This infographic serves as a clinical guideline for oncologists and cardiologists to manage cardiotoxicity and systemic inflammatory responses during advanced immunotherapy.
Workup for Delayed Puberty
Definition
- Boys: No testicular enlargement (volume <4 mL or length <2.5 cm) by age 14 (2-2.5 SD above mean)
- Girls: No breast development (thelarche) by age 12, or duration from thelarche to menarche >5 years (no menarche by age 17)
Categories / Differential Diagnosis
| Category | Gonadotropins | Sex Steroids | Prevalence |
|---|---|---|---|
| Constitutional delay of growth and puberty (CDGP) | Low (prepubertal) | Low | ~60% boys, ~33% girls |
| Functional hypogonadotropic hypogonadism (systemic illness, malnutrition, eating disorders, extreme exercise) | Low | Low | ~20% |
| Organic hypogonadotropic hypogonadism (CNS/pituitary - Kallmann syndrome, pituitary tumors, hyperprolactinemia, craniopharyngioma, hemochromatosis, radiation) | Low | Low | ~10% |
| Hypergonadotropic hypogonadism (primary gonadal failure - Klinefelter, Turner, orchitis, bilateral cryptorchidism, chemotherapy/radiation) | Elevated | Low | ~15% |
History
- Growth pattern (height/weight trajectory from childhood)
- Presence of any secondary sexual development and timing
- Diet, weight changes, exercise habits (eating disorders, excessive exercise)
- Chronic illness (IBD, celiac, renal disease, diabetes)
- Neurologic symptoms: anosmia (suggests Kallmann syndrome), headaches, visual field defects
- History of cryptorchidism, genital anomalies (micropenis - suggests congenital HH)
- Medications (glucocorticoids, opioids, anabolic steroids)
- Psychosocial concerns, peer relationships, school performance
- Family history: similar pubertal delay in a parent (supports CDGP, often autosomal dominant pattern)
Physical Examination
- Height, weight, BMI - plot on growth charts
- Arm span vs. height: arm span >5 cm greater than height suggests delayed epiphyseal closure from hypogonadism (adult configuration absent)
- Tanner staging for genital/breast development and pubic hair
- Testicular volume (Prader orchidometer): >2.5 cm indicates puberty has begun
- Anosmia testing (Kallmann syndrome)
- Visual fields (pituitary mass)
- Signs of chronic illness (pallor, jaundice, clubbing)
- Dysmorphic features: webbed neck (Turner), small testes/gynecomastia (Klinefelter), obesity/hypotonia (Prader-Willi)
Laboratory Workup
First-Line (All Patients)
| Test | Rationale |
|---|---|
| LH and FSH | Distinguish hypergonadotropic (↑ = primary gonadal failure) from hypogonadotropic (↓/normal = central or CDGP) |
| Testosterone (boys) / Estradiol (girls) | Assess gonadal output |
| Bone age (left wrist X-ray) | Delayed bone age supports CDGP; significant delay with normal stature suggests another cause |
| CBC, ESR | Screen for chronic inflammatory disease |
| LFTs, metabolic panel | Screen for systemic illness (renal, hepatic) |
| IGF-1 / IGFBP-3 | Growth hormone axis assessment |
Second-Line (Based on Clinical Context)
| Test | When to Order |
|---|---|
| Prolactin | Rule out prolactinoma (hypogonadotropic picture) |
| TSH, free T4 | Hypothyroidism can delay puberty and mimic other causes |
| Karyotype | Suspected Turner (girls) or Klinefelter (boys); any unexplained hypergonadotropic hypogonadism |
| DHEA-S, adrenal androgens | If adrenal pathology suspected (late-onset CAH) |
| Celiac antibodies (anti-tTG IgA) | If malnutrition or GI symptoms |
| GnRH stimulation test | Limited utility - blunted response seen in both CDGP and congenital HH; cannot reliably distinguish the two |
| Olfactory testing / MRI olfactory bulbs | If Kallmann syndrome suspected (anosmic HH) |
| Pelvic ultrasound (girls) | Uterine/ovarian anatomy; assess for Turner stigmata |
Imaging
| Study | Indication |
|---|---|
| Left wrist X-ray (bone age) | All patients - first-line |
| Brain MRI (with pituitary protocol) | Hypogonadotropic picture without identifiable functional cause; visual field defects; headaches; suspected mass lesion or infiltrative disease |
| Pelvic/testicular ultrasound | Assess gonadal anatomy, cryptorchidism |
Key Diagnostic Challenge
- Low testosterone + low LH/FSH
- Delayed bone age
- Short stature
- Blunted GnRH stimulation test response
- Micropenis or cryptorchidism in history
- Anosmia (Kallmann)
- No family history of delayed puberty
- No spontaneous pubertal onset after 1 year of observation/treatment
- Associated syndromic features
Summary Algorithm
Delayed puberty identified
        |
History + PE + Tanner staging + Bone age
        |
Measure LH / FSH + Testosterone or Estradiol
        |
   _____|_______
  |             |
High LH/FSH   Low LH/FSH
(hypergonadotropic)   (hypogonadotropic or CDGP)
  |                         |
Karyotype            Prolactin, TSH, IGF-1
Primary gonadal       MRI pituitary if no functional cause
failure (Klinefelter,   |
Turner, orchitis)    Functional cause?
                     (weight loss, illness, exercise)
                           |
                     Treat underlying cause
                     vs. CDGP (observe 6-12 months)
                     vs. CHH (hormone therapy)
- Harrison's Principles of Internal Medicine, 22E (2025) - Chapter 409, "Approach to the Patient: Delayed Puberty"
- Textbook of Family Medicine, 9E - Chapter 35, "Delayed Puberty"
- Brown EE & Fogleman CD (2025) - "Disorders of Puberty: Common Questions and Answers," Am Fam Physician (PMID 41252834)