
Lead time and lead time bias
Lead time and lead time bias are concepts in epidemiology and screening research. Here's a quick overview:
Lead time is the period between when a disease is detected by screening and when it would have been diagnosed based on symptoms alone. Screening detects disease earlier, so the patient appears to live longer after diagnosis - but this may not reflect a true survival benefit.
Lead time bias occurs when this earlier detection artificially inflates apparent survival time, making a screening test look more effective than it really is, even if the patient dies at the same time they would have without screening.
Searching sources...
Reading File
Searching the Web
lead time and lead time bias epidemiology screening
Finding Sources
Reading File
Reading File
Reading File
Loading Image
Loading Image
Reading File
Here is a thorough explanation of lead time and lead time bias, with diagrams from authoritative medical textbooks:
Lead Time and Lead Time Bias
1. What is Lead Time?
Lead time is the interval between the detection of a disease by a screening test and the point when that disease would have been diagnosed clinically (i.e., when symptoms would have appeared and driven the patient to seek care). It represents how far ahead screening "moves" the diagnosis in time.
"Lead time is defined as the period from detection of disease (which is intimately related to novel screening and detection modalities) and the disease's clinical presentation and diagnosis."
- Campbell-Walsh-Wein Urology
2. Lead Time Bias - Definition
Lead time bias is the distortion in apparent survival that results from this earlier diagnosis. Because the "clock starts ticking" sooner (at screen-detection rather than at symptom-driven diagnosis), a screened patient appears to live longer after diagnosis - even if the actual date of death is unchanged.
In other words: moving the date of diagnosis earlier does NOT automatically move the date of death later. But the time from diagnosis to death is artificially lengthened.
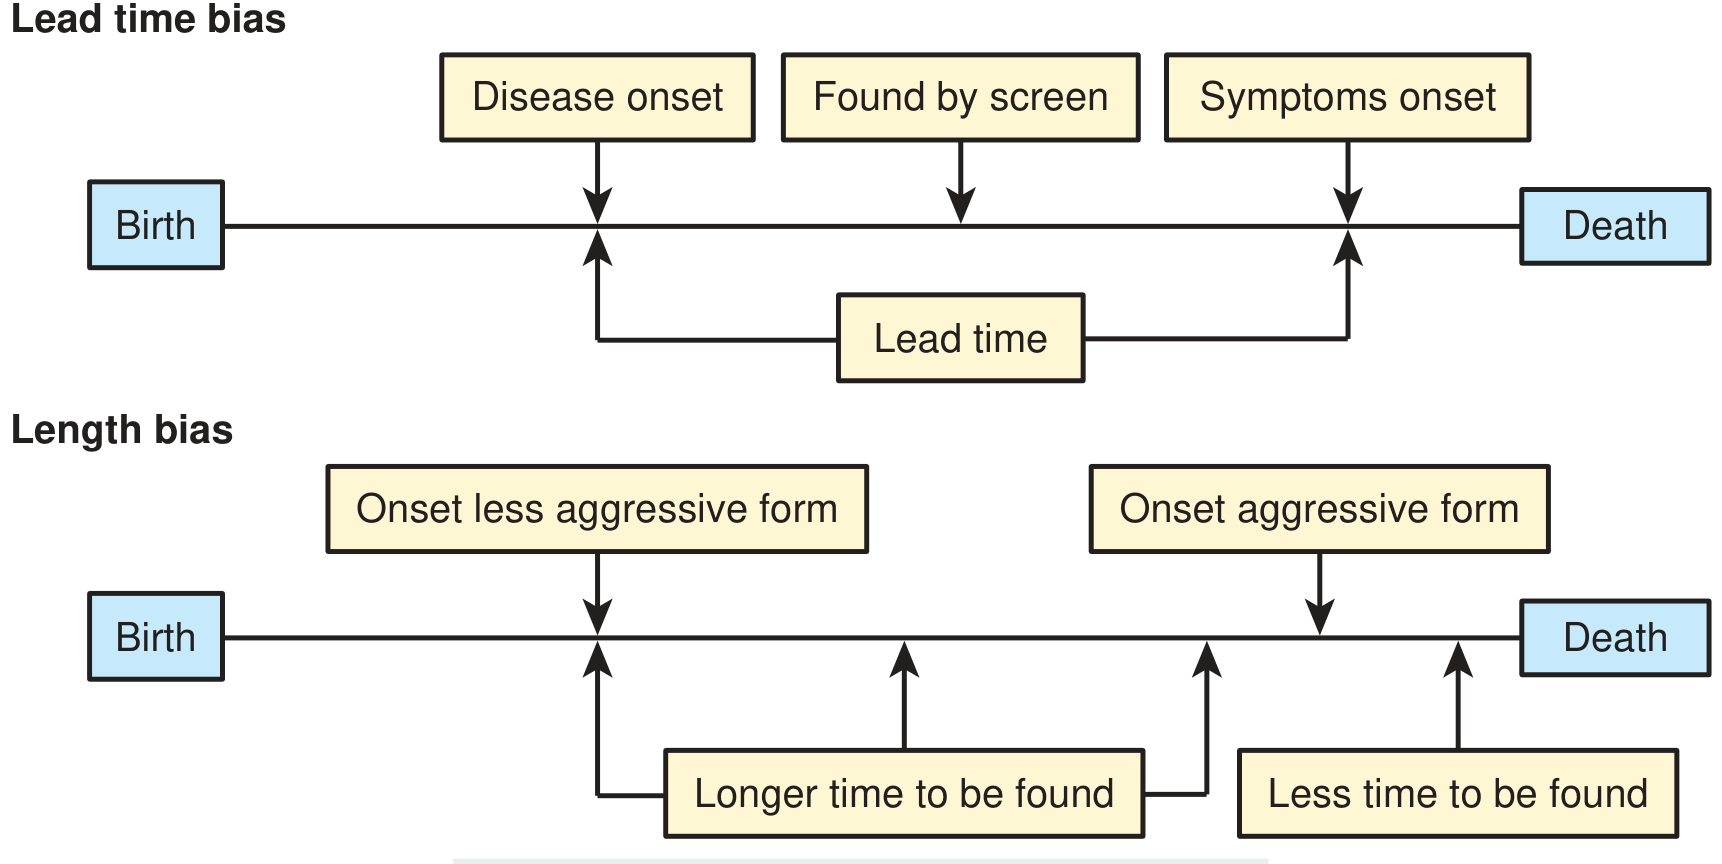
Figure: Lead time is the gap between "found by screen" and "symptoms onset." Without effective early treatment, total survival (birth to death) is unchanged - the screening just shifted the diagnosis point to the left.
3. Visual Illustration
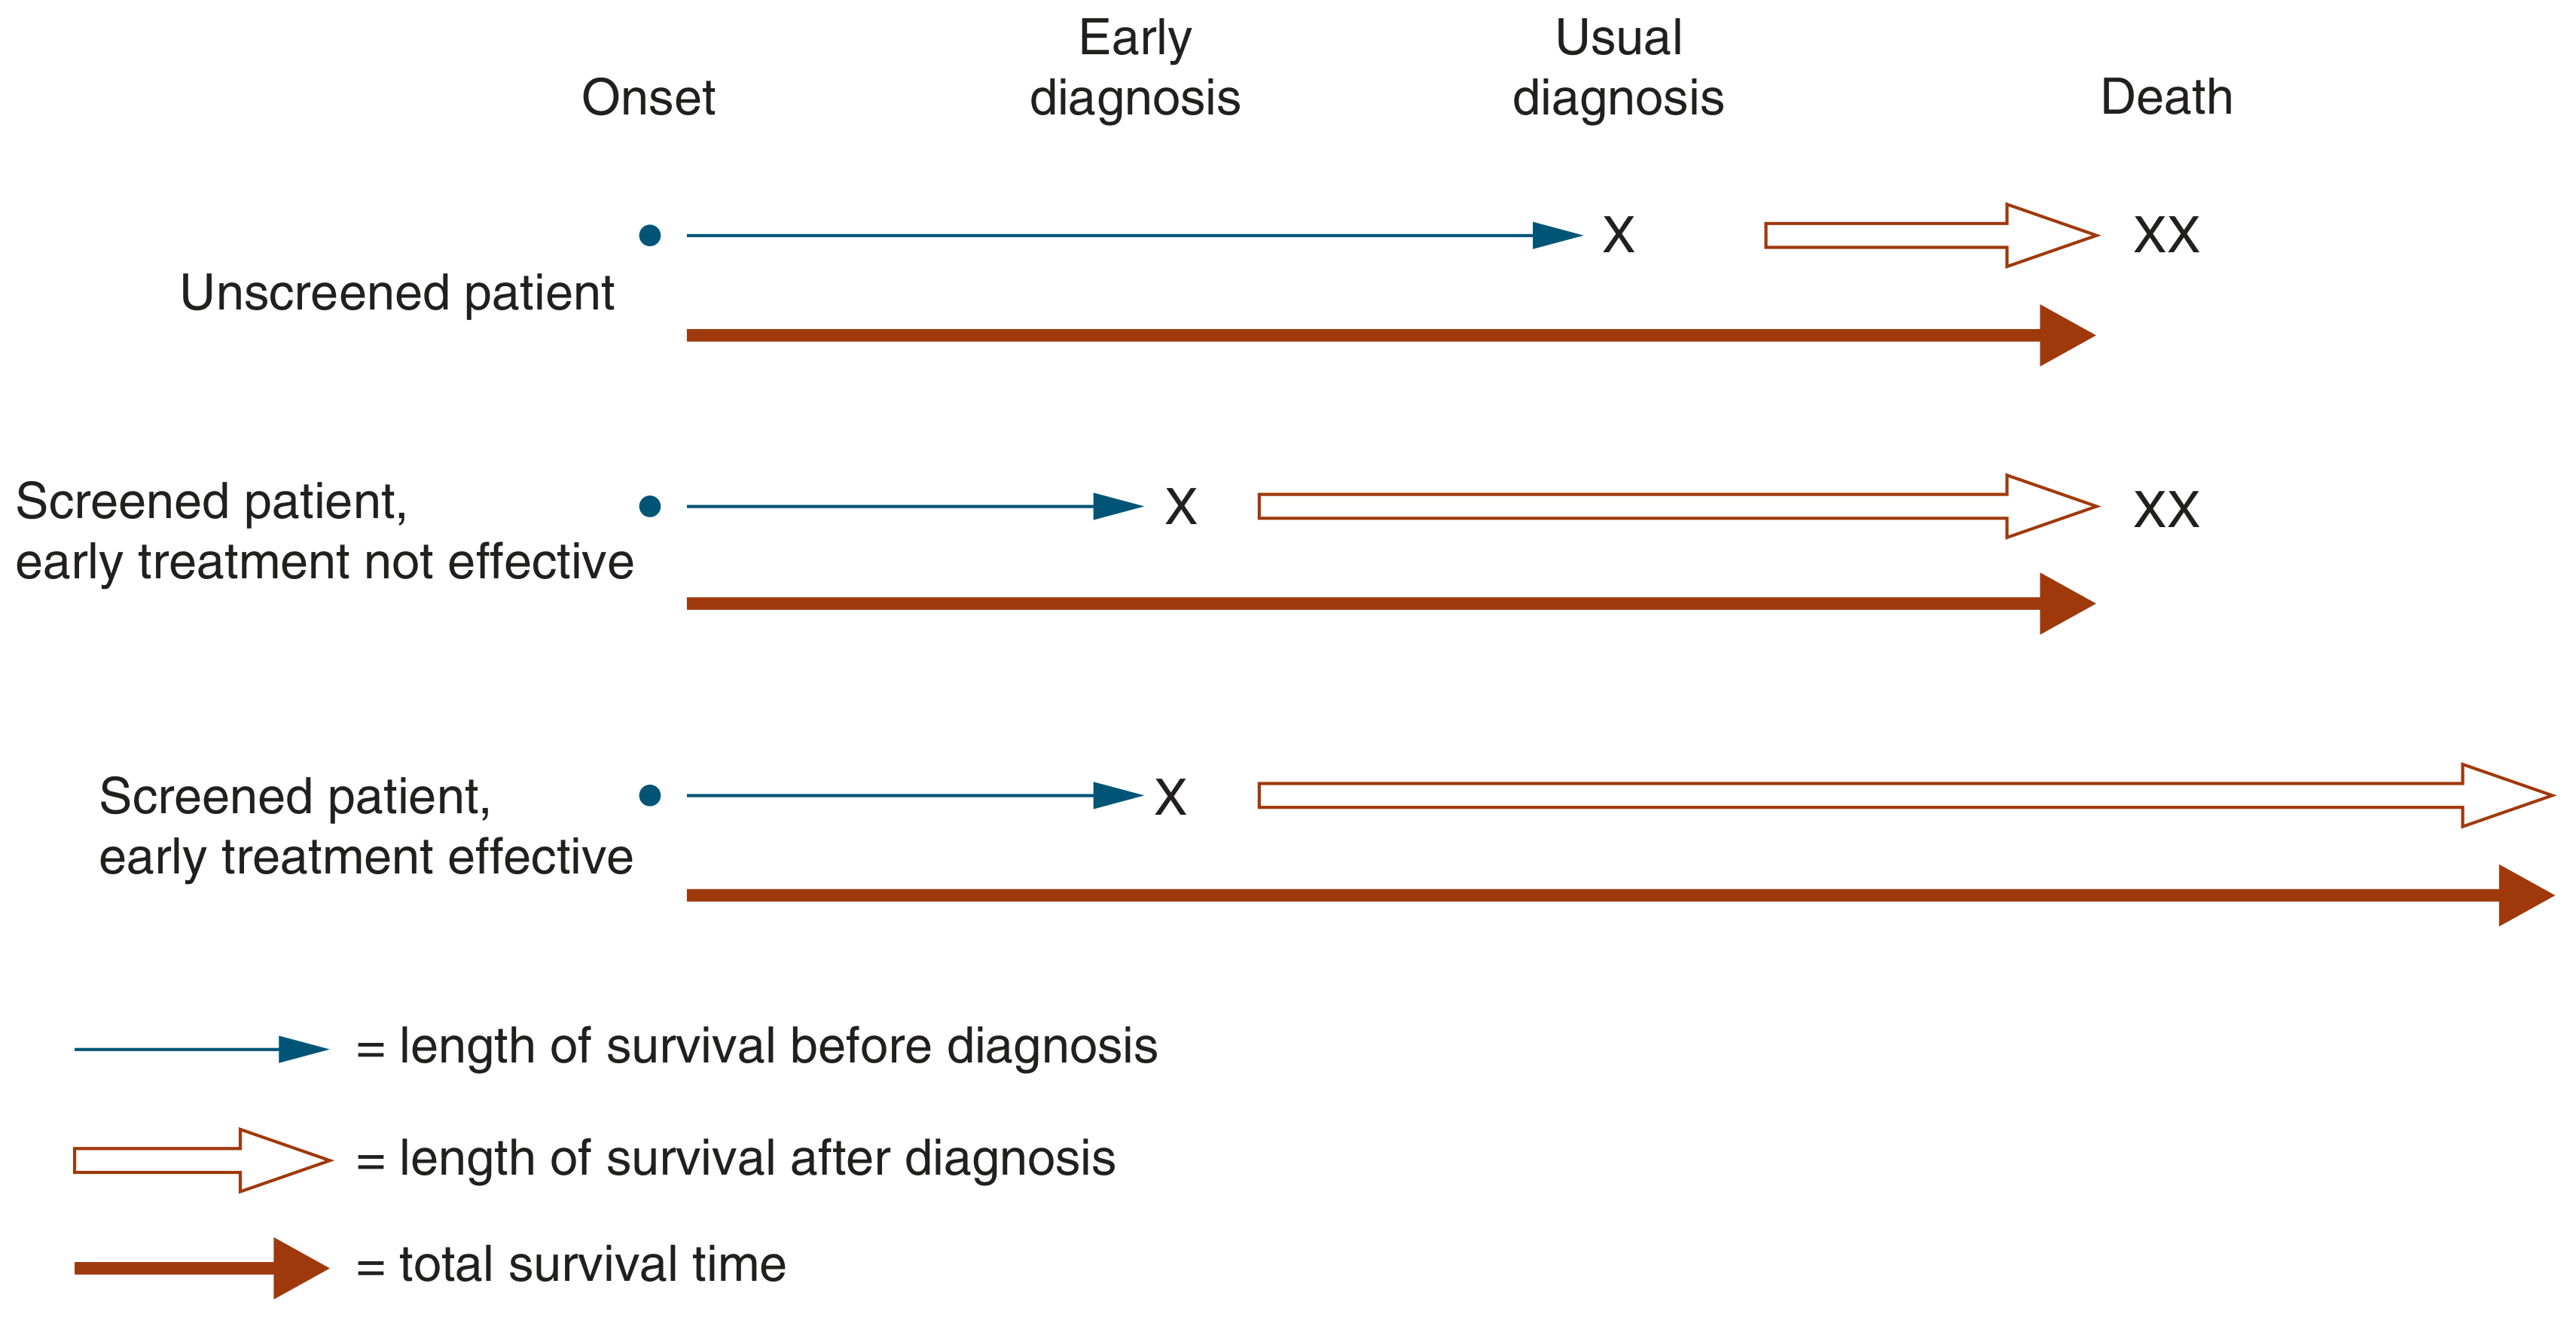
This diagram from Symptom to Diagnosis shows the three key scenarios:
| Scenario | Survival after diagnosis | Total survival (onset to death) |
|---|---|---|
| Unscreened patient | Shorter (diagnosis is late) | Baseline |
| Screened - early treatment not effective | Longer (diagnosis moved earlier) | Same - this is pure lead time bias |
| Screened - early treatment effective | Longer | Genuinely longer - real benefit |
The middle row is the essence of lead time bias: the patient appears to survive longer post-diagnosis simply because the clock started sooner, not because they actually lived longer overall.
4. Classic Real-World Examples
Kidney Cancer (renal cell carcinoma)
Over 30 years, widespread CT scanning doubled the detected incidence of kidney cancer and raised the apparent 5-year survival rate from ~50% to ~75%. However, the mortality rate from kidney cancer remained stable over this period - strongly suggesting the "survival benefit" is an artefact of lead time bias, not actual improved survival. (Campbell-Walsh-Wein Urology)
Prostate Cancer / PSA Screening
Claims of improved survival from PSA testing have been attributed by some researchers to lead time bias - the cancer is detected years earlier, so 5-year survival looks better, but overall mortality benefit is debated. (Campbell-Walsh-Wein Urology)
Lung Cancer (historical)
Before low-dose CT, chest X-ray screening appeared to show longer survival - but this was lead time bias because chest X-ray detected tumors earlier without actually curing more patients. This situation changed with low-dose CT, which has now demonstrated a genuine 20% reduction in lung cancer mortality in high-risk individuals. (Harrison's Principles of Internal Medicine, 22e)
5. Why This Matters: Choosing the Right Outcome Measure
Because of lead time bias, survival time after diagnosis is NOT a valid primary endpoint for evaluating a screening program. Per Harrison's:
"It is critical that disease incidence or mortality is the primary endpoint rather than length of disease survival. This is important because lead time bias and length time bias can create the appearance of an improvement in disease survival from a screening test when there is no actual effect."
- Harrison's Principles of Internal Medicine, 22e
The only rigorous way to eliminate lead time bias is to use randomized controlled trials (RCTs) measuring disease-specific or all-cause mortality rates, not survival time from diagnosis.
6. Lead Time Bias vs. Length Time Bias (Comparison)
These two biases often co-exist in screening studies:
| Feature | Lead Time Bias | Length Time Bias |
|---|---|---|
| Mechanism | Earlier diagnosis shifts the clock forward | Screening preferentially detects slow-growing disease |
| Result | Apparent longer survival post-diagnosis | Screened patients appear to have better-prognostic tumors |
| The "trick" | Same death date, earlier start date | Indolent tumors are overrepresented in screened populations |
| Fix | Use mortality rate, not survival time | Randomize; ensure mix of tumor aggressiveness is comparable |
"Cancers that progress rapidly from onset to symptoms are less likely to be detected by screening than slow-growing cancers, so that screening tends to identify a group with a better prognosis."
- Symptom to Diagnosis, 4th Edition
7. How to Avoid / Correct for Lead Time Bias
- Use mortality endpoints (not survival from diagnosis) as the primary outcome in screening trials
- Randomized controlled trials with sufficient follow-up are the gold standard
- Mathematical adjustment: Some studies estimate the lead time and subtract it from apparent survival gains
- Case-control study designs with appropriate controls can partly adjust for this, though observational designs remain suboptimal (Symptom to Diagnosis)
Sources:
- Harrison's Principles of Internal Medicine, 22e - Methods of Measuring Health Benefits
- Campbell-Walsh-Wein Urology - Overall Mortality section
- Symptom to Diagnosis: An Evidence-Based Guide, 4th ed. - Lead time and length time biases
- Textbook of Family Medicine, 9e - Assessing Screening Tests
Validity of screening test
The validity of a screening test refers to how well it measures what it's supposed to measure. The two core components are sensitivity (ability to correctly identify those WITH the disease) and specificity (ability to correctly identify those WITHOUT the disease). These are derived from a 2x2 contingency table comparing test results against a gold standard.
Searching sources...
Finding Sources
Searching the Web
validity of screening test sensitivity specificity predictive value epidemiology
Reading File
Reading File
Reading File
Reading File
Reading File
Now let me also fetch the textbook diagram on sensitivity/specificity from the Family Medicine book:
Finding Sources
Loading Image
Here is a complete, textbook-sourced explanation of the validity of a screening test:
Validity of a Screening Test
Definition
Validity (also called accuracy) refers to the extent to which a test correctly measures what it is intended to measure - in other words, its ability to distinguish those who have the disease from those who do not.
"Validity expresses the ability of a test to separate or distinguish those who have the disease from those who do not."
- Park's Textbook of Preventive and Social Medicine
An ideal screening test would be 100% sensitive and 100% specific. In practice, this seldom occurs.
The 2x2 Contingency Table
All validity measures are derived by comparing the test result against a gold standard diagnosis:
| Disease Present | Disease Absent | Total | |
|---|---|---|---|
| Test Positive | a (True Positive, TP) | b (False Positive, FP) | a + b |
| Test Negative | c (False Negative, FN) | d (True Negative, TN) | c + d |
| Total | a + c | b + d | a + b + c + d |
- TP (a): Test positive AND has disease
- FP (b): Test positive but does NOT have disease
- FN (c): Test negative but DOES have disease
- TN (d): Test negative AND does NOT have disease
Validity Has Two Core Components
1. Sensitivity
"The ability of a test to identify correctly all those who have the disease - the true-positives."
- Park's Textbook of Preventive and Social Medicine
$$\text{Sensitivity} = \frac{a}{a + c} \times 100 = \frac{TP}{TP + FN}$$
- A 90% sensitivity means 90% of truly diseased persons test positive, and 10% are false-negatives.
- A highly sensitive test is good at ruling OUT disease when negative (mnemonic: SnNout - Sensitive test, Negative result, rules OUT disease).
- Used when missing a case is dangerous (e.g., HIV screening, cancer of cervix/breast).
2. Specificity
"The ability of a test to identify correctly those who do not have the disease - the true-negatives."
- Park's Textbook of Preventive and Social Medicine
$$\text{Specificity} = \frac{d}{b + d} \times 100 = \frac{TN}{TN + FP}$$
- A 90% specificity means 90% of truly disease-free persons test negative, and 10% are false-positives.
- A highly specific test is good at ruling IN disease when positive (mnemonic: SpPin - Specific test, Positive result, rules IN disease).
- Used when false positives must be avoided (e.g., to prevent overburdening health services or causing unnecessary anxiety/harm).
The Full Validity Picture
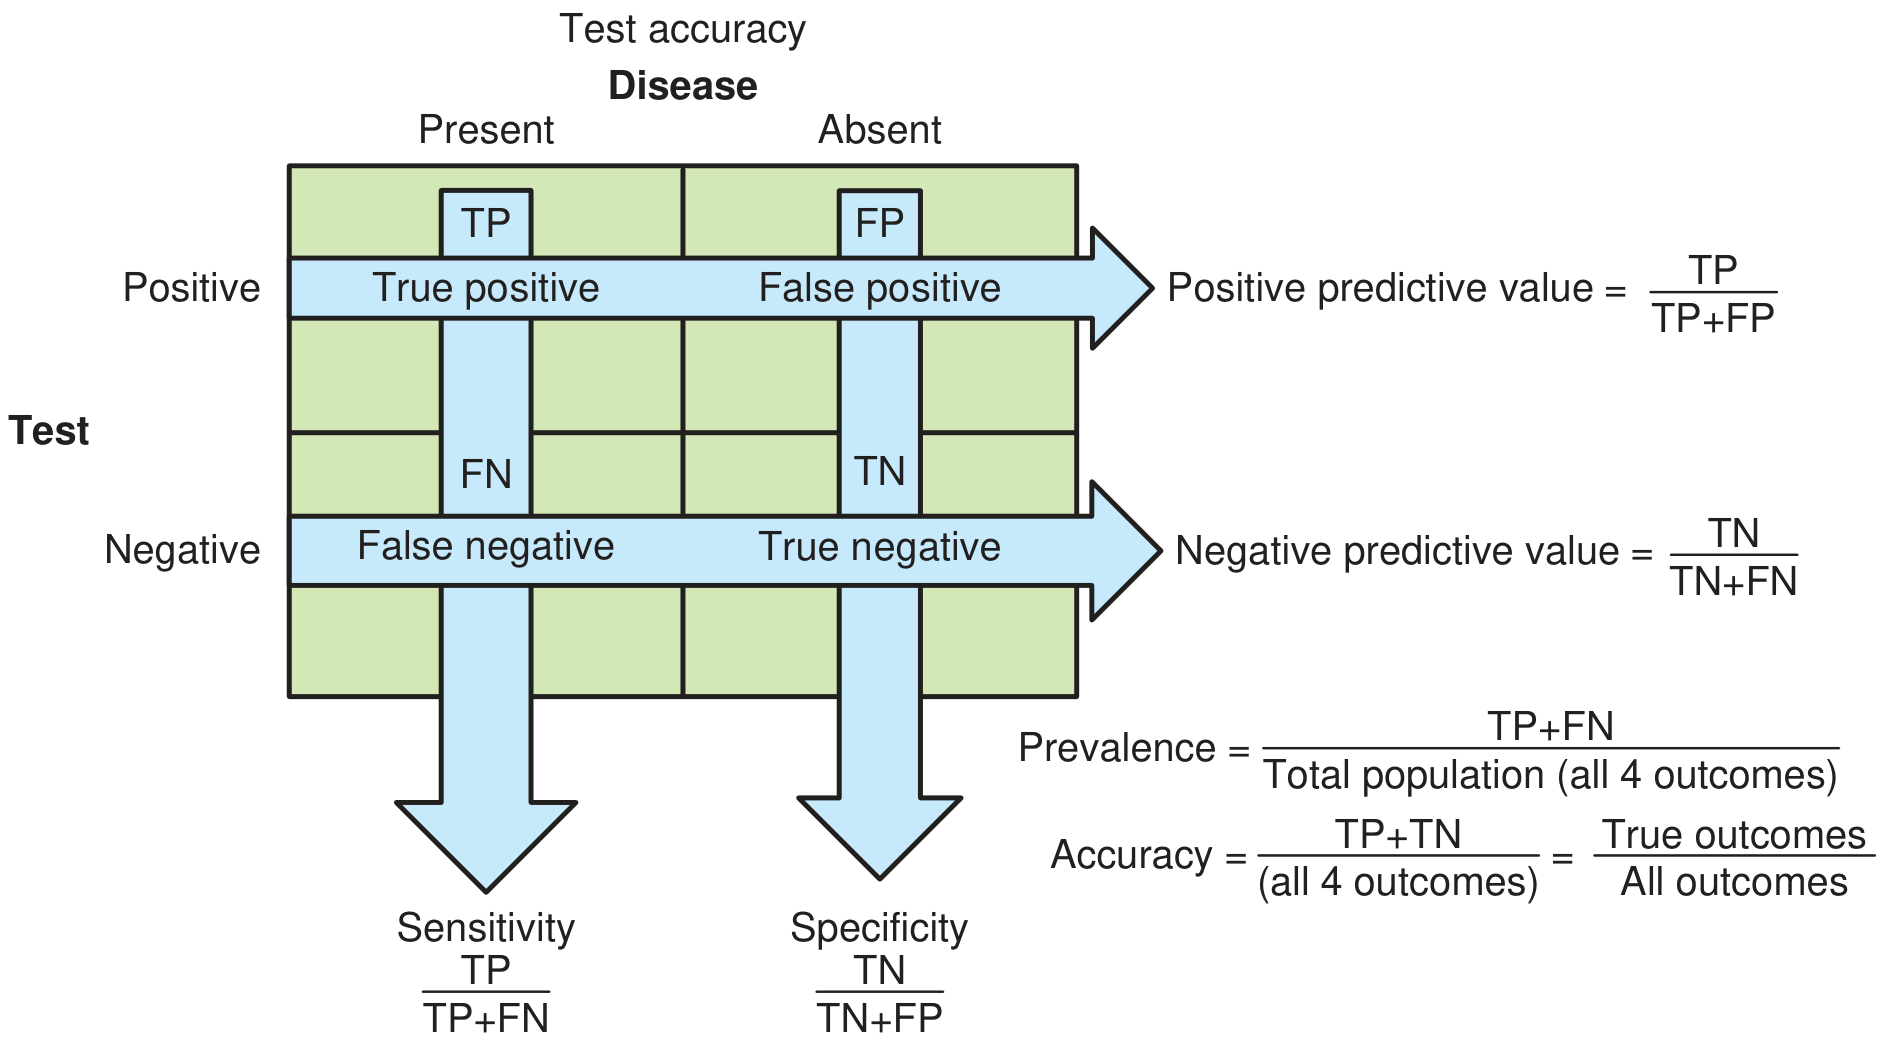
All Six Measures of Test Evaluation
| Measure | Formula | Meaning |
|---|---|---|
| Sensitivity | a / (a+c) | % of diseased correctly identified |
| Specificity | d / (b+d) | % of non-diseased correctly identified |
| PPV (Positive Predictive Value) | a / (a+b) | % of positive tests that are truly positive |
| NPV (Negative Predictive Value) | d / (c+d) | % of negative tests that are truly negative |
| False-negative rate | c / (a+c) | % of diseased missed by the test |
| False-positive rate | b / (b+d) | % of non-diseased wrongly labelled positive |
Worked Numerical Example (from Park's)
Hypothetical data (n = 10,000):
| Diseased | Not Diseased | Total | |
|---|---|---|---|
| Test + | 40 (a) | 20 (b) | 60 |
| Test - | 100 (c) | 9,840 (d) | 9,940 |
| Total | 140 | 9,860 | 10,000 |
- Sensitivity = 40/140 × 100 = 28.57% (low - misses many cases)
- Specificity = 9840/9860 × 100 = 99.79% (high - rarely labels healthy as sick)
- False-negative rate = 100/140 × 100 = 71.4%
- False-positive rate = 20/9860 × 100 = 0.20%
- PPV = 40/60 × 100 = 66.67%
- NPV = 9840/9940 × 100 = 98.99%
The Sensitivity-Specificity Trade-off
Sensitivity and specificity are inversely related - increasing one decreases the other, depending on where the cut-off point is set.
Example: 2-hour post-prandial blood glucose for diabetes (from Park's):
| Glucose cut-off (mg/100 ml) | Sensitivity | Specificity |
|---|---|---|
| 80 | 100.0% | 1.2% |
| 110 | 92.9% | 48.4% |
| 130 | 81.4% | 83.2% |
| 180 | 50.0% | 99.8% |
Lowering the cut-off increases sensitivity but sacrifices specificity. The choice depends on the consequences of missing a case vs. over-diagnosing.
When to prioritize Sensitivity:
- Disease is serious and treatable (e.g., cervical cancer, HIV)
- Missing a case has severe consequences
- False positives can be resolved by follow-up tests
When to prioritize Specificity:
- Follow-up of false positives is costly, risky, or burdensome
- Treatment has significant adverse effects
- Disease is not immediately life-threatening or treatment doesn't markedly alter outcome (e.g., early diabetes where treatment effect is modest)
Predictive Value and Prevalence
Sensitivity and specificity are intrinsic properties of the test - they don't change with disease prevalence. However, PPV and NPV do change with prevalence.
"From a physician and patient perspective, the predictive values are more critical."
- Textbook of Family Medicine, 9e
Key principle: When disease prevalence is LOW, even a test with good sensitivity and specificity will yield a low PPV (most positives are false positives):
Example (gram-stained cervical smear, sensitivity 50%, specificity 90%, n = 1,000 each group, from Park's):
| Prevalence | PPV |
|---|---|
| 5% | 21% |
| 15% | 47% |
| 25% | 63% |
This is why mass screening in low-prevalence populations can cause more harm than good.
Combination of Tests
Two tests can be combined to enhance either sensitivity or specificity:
- In series (sequential): All positives on test 1 are retested with test 2 - this increases specificity (reduces false positives). Example: RPR test followed by FTA-ABS for syphilis.
- In parallel (simultaneous): Testing with both tests together and calling positive if either is positive - this increases sensitivity (reduces false negatives). Used in emergencies.
Additional Measures of Screening Program Value
| Measure | What it tells you |
|---|---|
| Likelihood ratio (LR+) | How much a positive test raises disease odds |
| Number Needed to Screen (NNS) | How many need screening to prevent 1 death |
| Number Needed to Harm (NNH) | Harm side of the same calculation |
A test showing a 50% relative risk reduction in mortality may only translate to an absolute reduction of 1/100,000 - meaning NNS = 100,000. Relative risk alone is misleading. (Textbook of Family Medicine, 9e)
Sources:
- Park's Textbook of Preventive and Social Medicine - Validity (Accuracy), pp. 158-160
- Textbook of Family Medicine, 9e - Assessing Screening Tests
- Symptom to Diagnosis: An Evidence-Based Guide, 4th ed.
This is a shared conversation. Sign in to Orris to start your own chat.