
INTRAPLEURAL PRESSURE
Reading File
Reading File
Searching the Web
intrapleural pressure physiology normal values inspiration expiration authoritative
Searching PubMed
intrapleural pressure physiology
Finding Sources
Finding Sources
Reading File
Reading File
Reading File
Reading File
Reading File
Intrapleural pressure
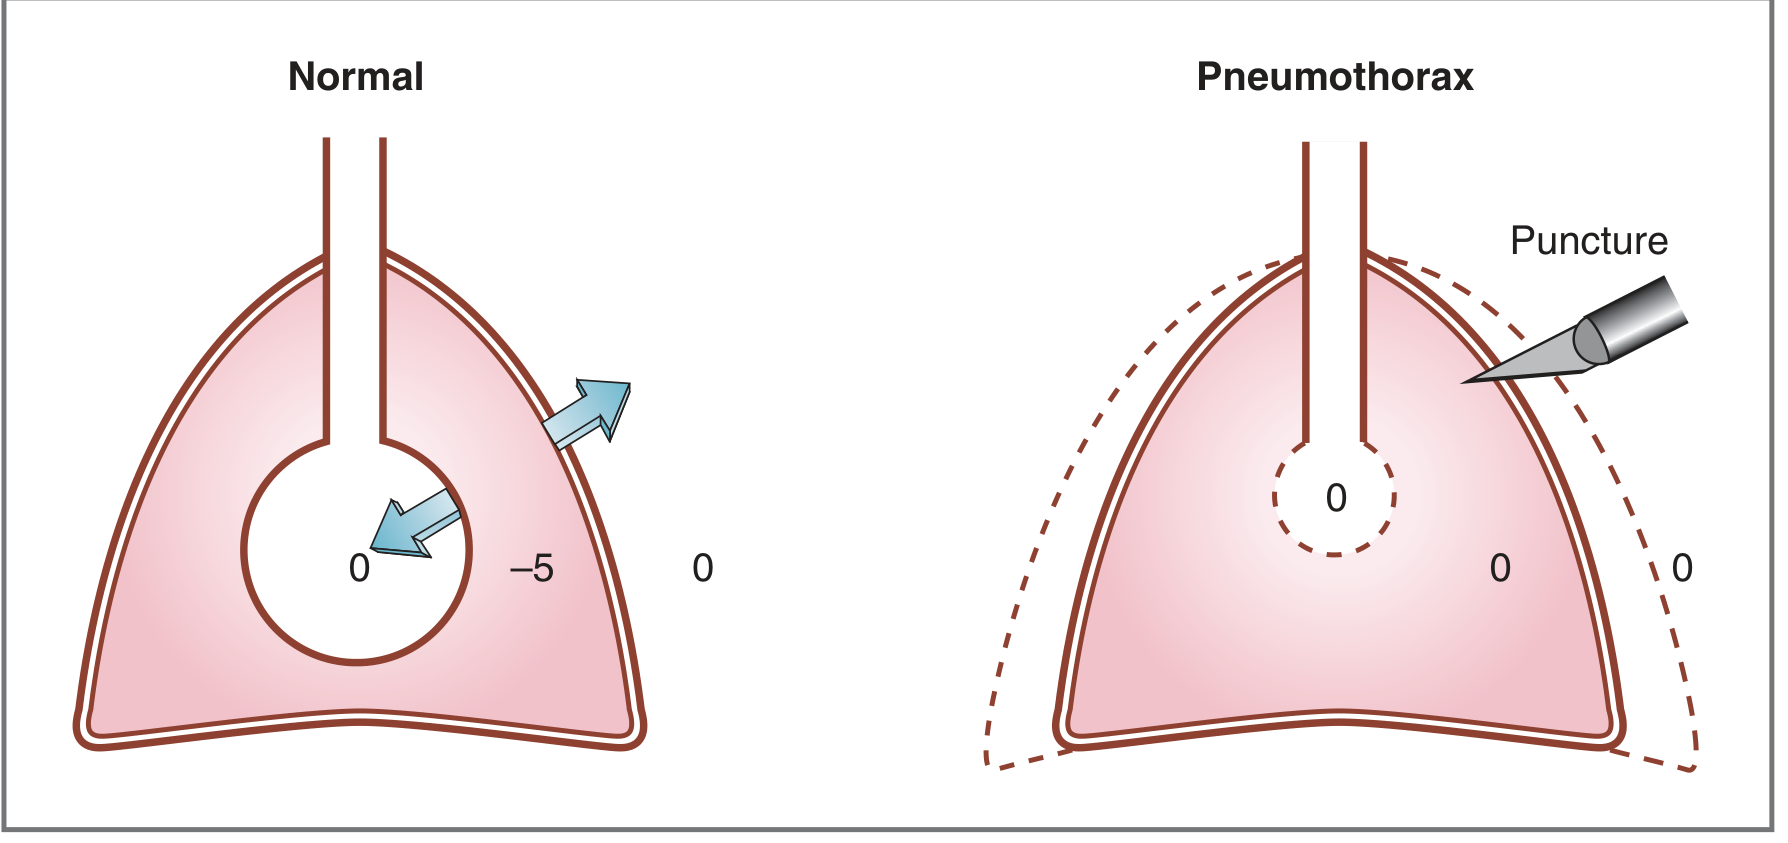
Intrapleural pressure (Pip) is the pressure in the thin fluid-filled potential space between the visceral pleura covering the lung and the parietal pleura lining the thoracic wall.
It is normally negative relative to atmospheric pressure.
Why is it negative?
Two opposing elastic recoils act on the pleural space:
- The lungs recoil inward and tend to collapse.
- The chest wall recoils outward and tends to expand.
Their opposing pulls create subatmospheric pressure in the sealed pleural space. This negative pressure keeps the lungs expanded. Costanzo Physiology, 7th ed., pp. 207, 212.
Values during quiet breathing
| Phase | Intrapleural pressure |
|---|---|
| End of normal expiration / at FRC | about -5 cm H₂O |
| Inspiration | Becomes more negative |
| End of quiet inspiration | about -8 cm H₂O |
| Forced expiration | May become positive |
During inspiration, diaphragmatic contraction enlarges the thoracic cavity, lowering pleural pressure further. At the end of normal expiration, it returns to approximately -5 cm H₂O. Costanzo Physiology, 7th ed., p. 212-214.
Relationship to transpulmonary pressure
The pressure that distends the lung is the transpulmonary pressure:
[
P_{TP} = P_{Alveolar} - P_{Intrapleural}
]
At rest:
[
P_{TP} = 0 - (-5) = +5 \text{ cm H₂O}
]
This positive distending pressure counteracts lung elastic recoil and maintains alveolar expansion. Transpulmonary-pressure physiology describes the same pressure relationship.
Clinical importance: pneumothorax
If air enters the pleural space, intrapleural pressure equalizes with atmospheric pressure, approaching 0 cm H₂O. Transpulmonary pressure is then lost, so the affected lung recoils and collapses while the chest wall moves outward.
One-line summary
Intrapleural pressure is normally negative, becomes more negative during inspiration, helps keep the lungs open, and is lost in pneumothorax.
GAS EXCHANGE IN THE LUNGS AND TISSUES. BLOOD GASES. Details notes in about 10 pages for physiology
Reading File
This is a broad physiology topic. I can structure it as a 10-page exam note, but it covers several distinct units.
Asking for Preferences
Which section should I develop first in detailed notes?
Intrapleural pressure
Intrapleural pressure (Pip) is the pressure in the thin fluid-filled potential space between the visceral pleura covering the lung and the parietal pleura lining the thoracic wall.
It is normally negative relative to atmospheric pressure.
Why is it negative?
Two opposing elastic recoils act on the pleural space:
- The lungs recoil inward and tend to collapse.
- The chest wall recoils outward and tends to expand.
Their opposing pulls create subatmospheric pressure in the sealed pleural space. This negative pressure keeps the lungs expanded. Costanzo Physiology, 7th ed., pp. 207, 212.
Values during quiet breathing
| Phase | Intrapleural pressure |
|---|---|
| End of normal expiration / at FRC | about -5 cm H₂O |
| Inspiration | Becomes more negative |
| End of quiet inspiration | about -8 cm H₂O |
| Forced expiration | May become positive |
During inspiration, diaphragmatic contraction enlarges the thoracic cavity, lowering pleural pressure further. At the end of normal expiration, it returns to approximately -5 cm H₂O. Costanzo Physiology, 7th ed., p. 212-214.
Relationship to transpulmonary pressure
The pressure that distends the lung is the transpulmonary pressure:
[
P_{TP} = P_{Alveolar} - P_{Intrapleural}
]
At rest:
[
P_{TP} = 0 - (-5) = +5 \text{ cm H₂O}
]
This positive distending pressure counteracts lung elastic recoil and maintains alveolar expansion. Transpulmonary-pressure physiology describes the same pressure relationship.
Clinical importance: pneumothorax
If air enters the pleural space, intrapleural pressure equalizes with atmospheric pressure, approaching 0 cm H₂O. Transpulmonary pressure is then lost, so the affected lung recoils and collapses while the chest wall moves outward.
One-line summary
**Intrapleural pressure is normally negative, becomes more negative during inspiration, helps keep the lungs open, and is lost in pneumothorax.**This is a broad physiology topic. I can structure it as a 10-page exam note, but it covers several distinct units.## Gas exchange in lungs and tissues, and blood gases: topic map
-
Basic principles of gas exchange
- Partial pressures and Dalton's law
- Diffusion and Fick's law
- Solubility of O₂ and CO₂
- Diffusing capacity of the lung
-
Alveolar gas exchange
- Composition of inspired, alveolar, and expired air
- Alveolar ventilation
- Alveolar gas equation
- Factors affecting alveolar (P_{O_2}) and (P_{CO_2})
-
Pulmonary capillary exchange
- Diffusion of O₂ from alveoli to blood
- Diffusion of CO₂ from blood to alveoli
- Perfusion-limited versus diffusion-limited transfer
- Ventilation-perfusion ratio and V/Q mismatch
- Physiological shunt and dead space
-
Oxygen transport in blood
- Dissolved O₂ and hemoglobin-bound O₂
- Oxyhemoglobin dissociation curve
- Right and left shifts
- Bohr effect, P50, oxygen content, and oxygen delivery
-
Gas exchange in tissues
- Tissue oxygen extraction
- Diffusion gradient between systemic capillaries and cells
- Bohr effect in tissue capillaries
- Role of myoglobin
-
Carbon dioxide transport
- Dissolved CO₂, bicarbonate, and carbamino compounds
- Carbonic anhydrase reaction
- Chloride shift
- Haldane effect
- CO₂ unloading in lungs
-
Blood gases and acid-base physiology
- Normal arterial and venous blood gas values
- ABG interpretation
- Respiratory and metabolic acidosis/alkalosis
- Compensation
- Anion gap and clinical correlations
-
Applied physiology
- Hypoxemia versus hypoxia
- Cyanosis
- High altitude
- Anemia and carbon monoxide poisoning
- COPD, pulmonary edema/fibrosis, shunt, and V/Q inequality
High-level overview
Gas exchange depends on diffusion down partial-pressure gradients. In the lungs, oxygen enters pulmonary capillary blood while carbon dioxide leaves it. In tissues, the direction reverses: oxygen moves from blood into cells and carbon dioxide enters blood.
Oxygen is carried predominantly by hemoglobin, whereas carbon dioxide is transported mainly as bicarbonate. Arterial blood-gas measurements assess ventilation, oxygenation, and acid-base status, making them central to respiratory physiology and clinical diagnosis.
Which would you like next: the full 10-page structured note, or one section in detail first?
Write the full 10-page physiology note
Reading File
Searching the Web
NCBI Bookshelf pulmonary gas exchange oxygen carbon dioxide transport arterial blood gas physiology
Searching PubMed
pulmonary gas exchange physiology
Finding Sources
Finding Sources
Reading File
Finding Sources
Finding Sources
Finding Sources
Searching Images
physiology diagram alveolar capillary membrane diffusion oxygen carbon dioxide gas exchange
Searching Images
oxygen hemoglobin dissociation curve Bohr effect physiology graph
Finding Sources
Finding Sources
Finding Sources
query_images_db
query_images_db
Reading File
Reading File
Reading File
Reading File
Reading File
Reading File
Reading File
Reading File
Reading File
Finding Sources
Finding Sources
Gas Exchange in the Lungs and Tissues. Blood Gases
Detailed Physiology Note
1. Introduction
Respiration has four linked processes:
- Pulmonary ventilation: movement of air between atmosphere and alveoli.
- Diffusion: movement of O₂ and CO₂ across the alveolar-capillary membrane.
- Transport of gases in blood: carriage of O₂ from lungs to tissues and CO₂ from tissues to lungs.
- Tissue gas exchange: diffusion of O₂ into cells and CO₂ out of cells.
The overall sequence is:
[
\text{Atmosphere} \rightarrow \text{Alveoli} \rightarrow \text{Blood} \rightarrow \text{Tissues}
]
for oxygen, and the reverse for carbon dioxide.
At rest, the body consumes approximately 250 mL O₂/min and produces approximately 200 mL CO₂/min. Thus, the respiratory quotient:
[
R = \frac{\dot V_{CO_2}}{\dot V_{O_2}}
]
is approximately:
[
R = \frac{200}{250} = 0.8
]
2. Basic Concepts in Gas Exchange
2.1 Partial pressure
A gas mixture exerts a total pressure equal to the sum of the partial pressures of its component gases. This is Dalton's law.
[
P_{Total} = P_{O_2} + P_{CO_2} + P_{N_2} + P_{H_2O}
]
The partial pressure of any gas is:
[
P_{gas} = F_{gas} \times P_{total}
]
where (F_{gas}) is the fractional concentration of the gas.
At sea level:
[
P_B = 760 \text{ mm Hg}
]
Atmospheric air contains approximately 21% O₂:
[
P_{IO_2} = 0.21 \times 760 = 160 \text{ mm Hg}
]
Thus, the (P_{O_2}) of dry atmospheric air is approximately 160 mm Hg.
2.2 Humidification of inspired air
Inspired air becomes saturated with water vapor as it passes through the upper airway. At body temperature, water vapor pressure is:
[
P_{H_2O} = 47 \text{ mm Hg}
]
Therefore, the partial pressure of inspired oxygen after humidification is:
[
P_{IO_2} = F_{IO_2}(P_B - P_{H_2O})
]
At sea level:
[
P_{IO_2} = 0.21(760 - 47)
]
[
P_{IO_2} \approx 150 \text{ mm Hg}
]
Thus:
| Site | (P_{O_2}) |
|---|---|
| Dry atmospheric air | 160 mm Hg |
| Humidified tracheal air | 150 mm Hg |
| Alveolar air | about 100 mm Hg |
| Systemic arterial blood | about 95-100 mm Hg |
| Mixed venous blood | about 40 mm Hg |
Costanzo Physiology, 7th ed., p. 218.
2.3 Diffusion of gases
Gases move by simple diffusion from a region of higher partial pressure to a region of lower partial pressure.
The rate of diffusion is described by Fick's law:
[
\dot V_{gas} = \frac{A}{T} \times D \times (P_1-P_2)
]
Where:
- (\dot V_{gas}) = rate of gas transfer
- (A) = surface area available for diffusion
- (T) = thickness of the diffusion barrier
- (D) = diffusion coefficient of the gas
- (P_1 - P_2) = partial-pressure gradient
Therefore, diffusion increases with:
- Increased surface area
- Increased partial-pressure gradient
- Higher solubility of the gas
Diffusion decreases with:
- Increased membrane thickness
- Reduced surface area
- Reduced partial-pressure gradient
2.4 Diffusion coefficient
The diffusion coefficient is proportional to:
[
D \propto \frac{\text{Solubility}}{\sqrt{\text{Molecular weight}}}
]
CO₂ is much more soluble than O₂. Therefore, despite its smaller pressure gradient, CO₂ diffuses approximately 20 times more rapidly than O₂ across the respiratory membrane.
Guyton and Hall Textbook of Medical Physiology, p. 522.
Clinical significance
- Pulmonary fibrosis increases diffusion distance.
- Pulmonary edema adds fluid between alveolar air and capillary blood.
- Emphysema reduces surface area by destroying alveolar septa.
- O₂ transfer is affected earlier and more severely than CO₂ transfer in diffusion disorders.
3. The Alveolar-Capillary Membrane
The respiratory membrane separates alveolar gas from pulmonary capillary blood. It includes:
- Alveolar lining fluid and surfactant
- Type I alveolar epithelial cell
- Epithelial basement membrane
- Thin interstitial space
- Capillary basement membrane
- Capillary endothelial cell
- Plasma
- Red blood cell membrane
It is extremely thin, approximately 0.2 to 0.6 µm in many areas, allowing rapid diffusion.
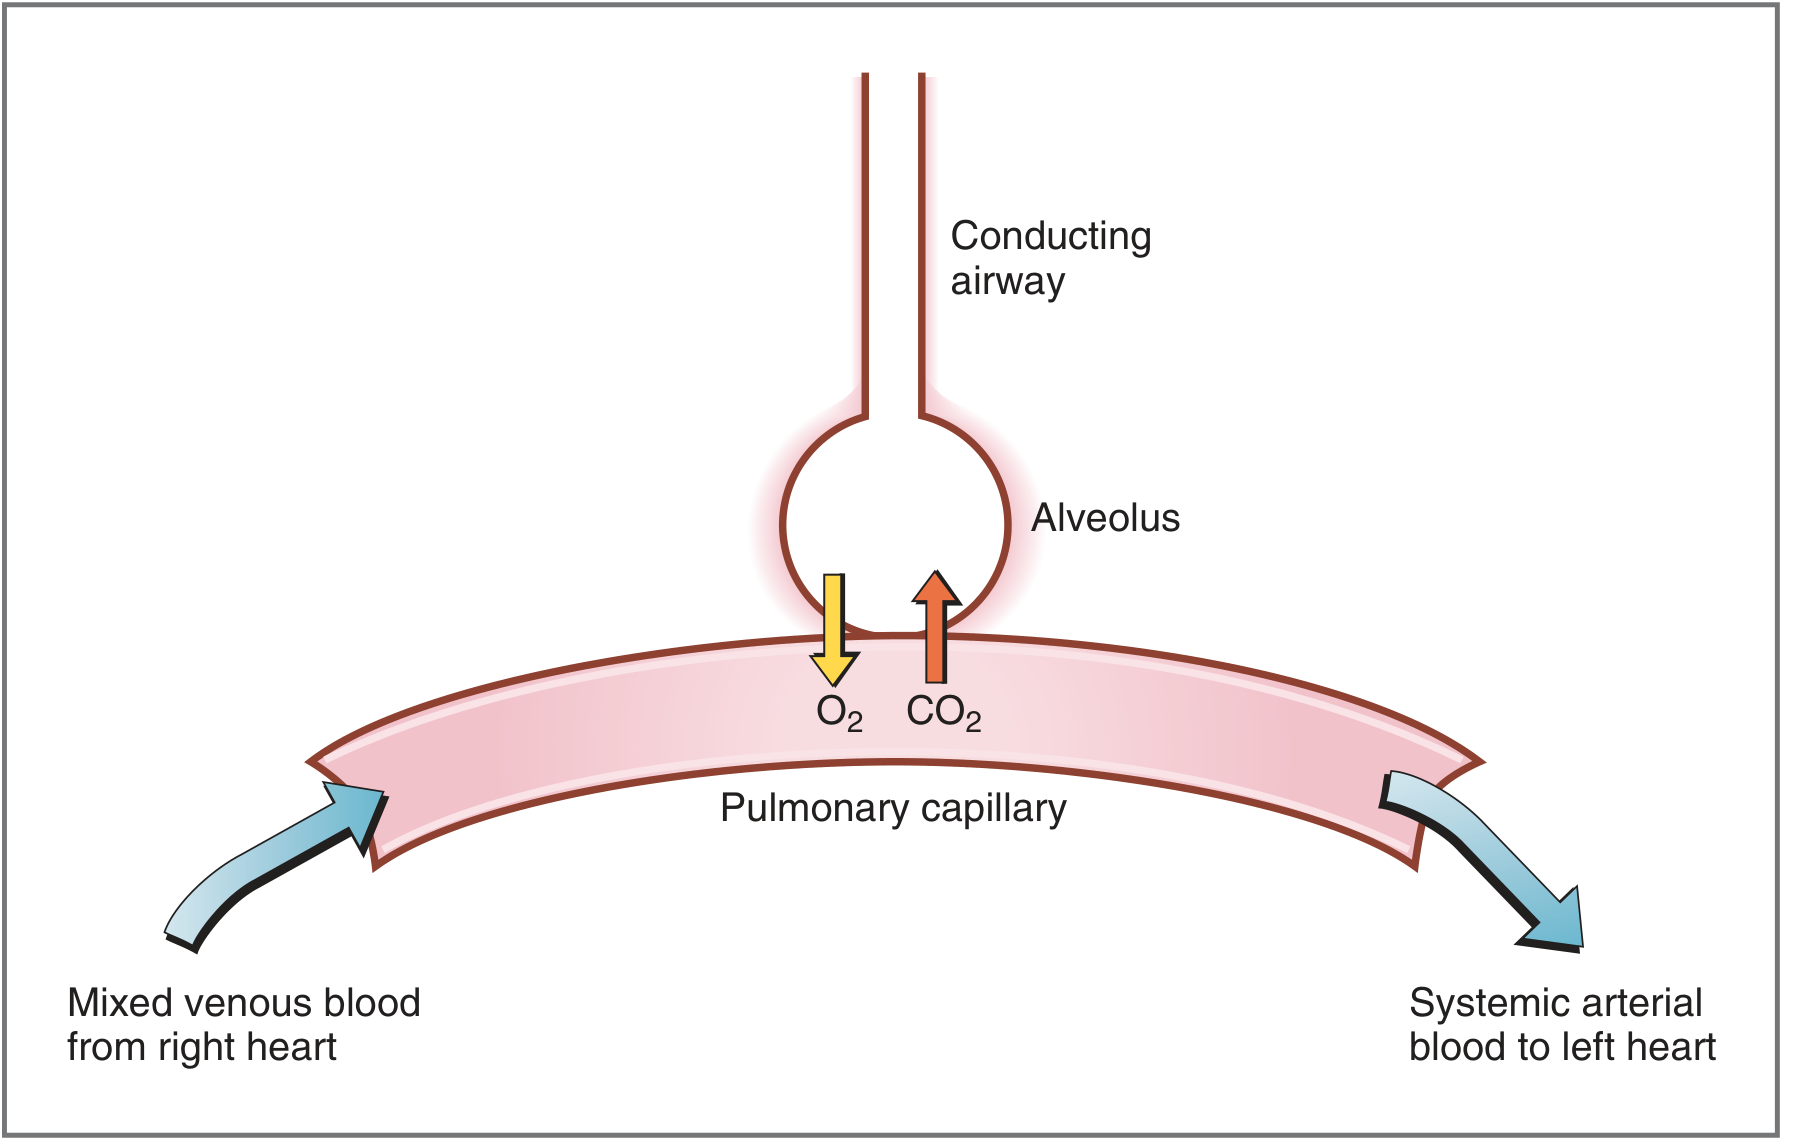
Mixed venous blood enters the pulmonary capillary from the right ventricle. It gains O₂ and loses CO₂. The blood leaving the capillary becomes oxygenated arterial blood and returns to the left heart. Costanzo Physiology, 7th ed., p. 218.
4. Alveolar Ventilation
4.1 Minute ventilation
Minute ventilation is the total volume of air inspired or expired per minute:
[
\dot V_E = V_T \times f
]
Where:
- (\dot V_E) = minute ventilation
- (V_T) = tidal volume
- (f) = respiratory rate
Example:
[
\dot V_E = 500 \text{ mL} \times 12/\text{min}
]
[
\dot V_E = 6000 \text{ mL/min} = 6 \text{ L/min}
]
However, not all inspired air reaches alveoli for gas exchange.
4.2 Dead space
Dead space is the volume of inspired air that does not take part in gas exchange.
A. Anatomical dead space
It is the volume in conducting airways:
- Nose
- Pharynx
- Larynx
- Trachea
- Bronchi
- Terminal bronchioles
In an average adult:
[
V_D \approx 150 \text{ mL}
]
B. Alveolar dead space
Alveoli may be ventilated but receive little or no blood flow. Such ventilation is wasted.
This occurs in conditions such as:
- Pulmonary embolism
- Low cardiac output
- Destruction of pulmonary capillary bed in emphysema
C. Physiological dead space
[
\text{Physiological dead space} = \text{Anatomical dead space} + \text{Alveolar dead space}
]
Normally, alveolar dead space is very small, so physiological dead space is nearly equal to anatomical dead space.
4.3 Alveolar ventilation
Only air reaching the alveoli participates in gas exchange.
[
\dot V_A = (V_T - V_D) \times f
]
Where:
- (\dot V_A) = alveolar ventilation
- (V_T) = tidal volume
- (V_D) = dead-space volume
- (f) = respiratory rate
Example:
[
\dot V_A = (500 - 150) \times 12
]
[
\dot V_A = 4200 \text{ mL/min} = 4.2 \text{ L/min}
]
Importance of tidal volume
Compare two breathing patterns:
| Pattern | Tidal volume | Respiratory rate | Minute ventilation | Alveolar ventilation |
|---|---|---|---|---|
| Normal | 500 mL | 12/min | 6 L/min | 4.2 L/min |
| Rapid, shallow | 250 mL | 24/min | 6 L/min | 2.4 L/min |
Although minute ventilation is equal, rapid shallow breathing is less efficient because a greater fraction of each breath enters dead space.
4.4 Alveolar ventilation equation
Alveolar (P_{CO_2}) is inversely related to alveolar ventilation:
[
P_{A CO_2} = \frac{\dot V_{CO_2} \times K}{\dot V_A}
]
Clinically:
[
P_{a CO_2} \approx P_{A CO_2}
]
Therefore:
[
P_{a CO_2} = \frac{\dot V_{CO_2} \times 0.863}{\dot V_A}
]
Where:
- (P_{aCO_2}) = arterial carbon dioxide tension
- (\dot V_{CO_2}) = rate of CO₂ production
- (\dot V_A) = alveolar ventilation
- 0.863 = conversion constant
Consequences
| Change | Alveolar ventilation | PaCO₂ |
|---|---|---|
| Hypoventilation | Decreases | Increases |
| Hyperventilation | Increases | Decreases |
| Increased CO₂ production | Unchanged | Increases |
| Decreased CO₂ production | Unchanged | Decreases |
Thus, hypercapnia usually indicates alveolar hypoventilation.
Costanzo Physiology, 7th ed., pp. 211-212.
5. Alveolar Gas Equation
The alveolar gas equation estimates alveolar oxygen tension:
[
P_{A O_2} = P_{I O_2} - \frac{P_{a CO_2}}{R}
]
At sea level while breathing room air:
[
P_{A O_2} = F_{IO_2}(P_B-P_{H_2O}) - \frac{P_{aCO_2}}{R}
]
With:
- (F_{IO_2} = 0.21)
- (P_B = 760) mm Hg
- (P_{H_2O} = 47) mm Hg
- (P_{aCO_2} = 40) mm Hg
- (R = 0.8)
[
P_{A O_2} = 0.21(760-47) - \frac{40}{0.8}
]
[
P_{A O_2} = 150 - 50
]
[
P_{A O_2} = 100 \text{ mm Hg}
]
Factors reducing alveolar (P_{O_2})
- Low inspired oxygen concentration
- Reduced barometric pressure at high altitude
- Hypoventilation with increased PaCO₂
- Increased oxygen consumption, if not matched by ventilation
Costanzo Physiology, 7th ed., p. 214.
6. Gas Exchange in the Lungs
6.1 Oxygen transfer
Mixed venous blood entering pulmonary capillaries has:
[
P_{vO_2} \approx 40 \text{ mm Hg}
]
Alveolar gas has:
[
P_{AO_2} \approx 100 \text{ mm Hg}
]
Thus, there is a diffusion gradient of about:
[
100 - 40 = 60 \text{ mm Hg}
]
O₂ diffuses from alveoli into pulmonary capillary blood until blood (P_{O_2}) equilibrates with alveolar (P_{O_2}).
Under normal conditions, equilibrium occurs during the first one-third of capillary transit time. Thus, the normal lung has a substantial diffusion reserve.
6.2 Carbon dioxide transfer
Mixed venous blood has:
[
P_{vCO_2} \approx 46 \text{ mm Hg}
]
Alveolar gas has:
[
P_{ACO_2} \approx 40 \text{ mm Hg}
]
The CO₂ pressure gradient is only about 6 mm Hg. Yet CO₂ diffuses rapidly because of its much greater solubility.
[
P_{vCO_2} - P_{ACO_2} = 46 - 40 = 6 \text{ mm Hg}
]
CO₂ moves from blood to alveoli and is then removed by expiration.
6.3 Diffusion-limited and perfusion-limited gas transfer
Perfusion-limited transfer
Gas equilibrates completely between alveolar air and capillary blood early in the capillary. Further uptake depends on delivery of more blood.
Examples:
- Nitrous oxide
- O₂ under normal resting conditions
- CO₂ under normal conditions
O₂ is normally perfusion limited because its capillary partial pressure rapidly reaches alveolar partial pressure.
Diffusion-limited transfer
The gas does not equilibrate between alveolar air and capillary blood by the end of the capillary. Transfer is limited by diffusion across the membrane.
Classic example:
- Carbon monoxide
CO binds strongly to hemoglobin, maintaining capillary (P_{CO}) close to zero. Therefore, a diffusion gradient persists along the whole capillary.
O₂ can become diffusion limited in:
- Interstitial fibrosis
- Pulmonary edema
- Severe emphysema
- Strenuous exercise
- High altitude
Costanzo Physiology, 7th ed., pp. 220-222.
6.4 Diffusing capacity of the lungs
Diffusing capacity is the volume of gas crossing the respiratory membrane each minute for a pressure gradient of 1 mm Hg.
[
D_L = \frac{\dot V_{gas}}{\Delta P}
]
The approximate diffusing capacity for O₂ at rest is:
[
D_{LO_2} \approx 21 \text{ mL/min/mm Hg}
]
It increases substantially during exercise because:
- More pulmonary capillaries are recruited.
- Existing capillaries dilate.
- Surface area for diffusion increases.
- Ventilation-perfusion matching improves.
Guyton and Hall Textbook of Medical Physiology, pp. 522-523.
DLCO
Diffusing capacity is commonly assessed clinically by measuring carbon monoxide uptake, called DLCO.
DLCO is reduced in:
- Emphysema
- Interstitial lung disease
- Pulmonary edema
- Pulmonary vascular disease
- Anemia
DLCO may be increased in:
- Exercise
- Polycythemia
- Pulmonary hemorrhage
7. Ventilation-Perfusion Relationship
7.1 Definition
For effective gas exchange, alveolar ventilation and pulmonary blood flow must be matched.
[
\frac{\dot V_A}{\dot Q}
]
Where:
- (\dot V_A) = alveolar ventilation
- (\dot Q) = pulmonary perfusion
Normal total values are approximately:
[
\dot V_A = 4.2 \text{ L/min}
]
[
\dot Q = 5 \text{ L/min}
]
Therefore:
[
\frac{\dot V_A}{\dot Q} = \frac{4.2}{5} \approx 0.8
]
7.2 Regional V/Q differences
Due to gravity, both ventilation and perfusion are greater at the base of the upright lung. Perfusion increases more than ventilation toward the base.
| Region | Ventilation | Perfusion | V/Q ratio |
|---|---|---|---|
| Apex | Low | Very low | High |
| Base | High | Very high | Low |
| Average lung | Normal | Normal | 0.8 |
Apex
High V/Q means relatively more ventilation than perfusion.
- Higher alveolar (P_{O_2})
- Lower alveolar (P_{CO_2})
Base
Low V/Q means relatively more perfusion than ventilation.
- Lower alveolar (P_{O_2})
- Higher alveolar (P_{CO_2})
7.3 V/Q = 0: shunt-like unit
When:
[
\dot V_A = 0
]
but blood flow remains present:
[
\frac{\dot V_A}{\dot Q} = 0
]
No fresh gas reaches the alveolus. Blood passing through it remains poorly oxygenated.
Examples:
- Atelectasis
- Alveolar flooding in pulmonary edema
- Consolidation in pneumonia
- Mucus plugging
This behaves as a right-to-left shunt.
7.4 V/Q = infinity: dead-space unit
When ventilation occurs but there is no perfusion:
[
\dot Q = 0
]
[
\frac{\dot V_A}{\dot Q} = \infty
]
No gas exchange occurs because there is no blood to receive O₂ or deliver CO₂.
Examples:
- Pulmonary embolism
- Severe reduction in pulmonary blood flow
- Destruction of capillary bed in emphysema
7.5 V/Q mismatch
V/Q mismatch is the most common cause of hypoxemia in lung disease.
Common causes include:
- Chronic obstructive pulmonary disease
- Asthma
- Pneumonia
- Pulmonary edema
- Pulmonary embolism
- Interstitial lung disease
Hypoxemia from V/Q mismatch generally improves with supplemental O₂, because oxygen can enter well-ventilated alveoli and increase oxygen content in blood leaving them.
7.6 Physiological shunt
A small normal physiological shunt is present because some venous blood enters systemic arterial blood without complete oxygenation.
Sources include:
- Bronchial venous blood draining into pulmonary veins
- Thebesian veins draining directly into the left heart
Therefore, systemic arterial (P_{O_2}) is slightly less than alveolar (P_{O_2}).
[
P_{AO_2} \approx 100 \text{ mm Hg}
]
[
P_{aO_2} \approx 95 \text{ mm Hg}
]
Costanzo Physiology, 7th ed., pp. 218-219.
8. Oxygen Transport in Blood
O₂ exists in blood in two forms:
- Dissolved in plasma
- Bound reversibly to hemoglobin
8.1 Dissolved oxygen
The amount of dissolved O₂ follows Henry's law:
[
\text{Dissolved O₂} = P_{aO_2} \times 0.003
]
At (P_{aO_2} = 100) mm Hg:
[
100 \times 0.003 = 0.3 \text{ mL O₂/dL blood}
]
This represents only about 1.5% to 2% of total arterial O₂ content.
Dissolved O₂ is important because it determines:
- PaO₂
- The gradient for diffusion into tissues
- Oxygen tension measured on ABG analysis
8.2 Hemoglobin-bound oxygen
Approximately 98% of O₂ is carried bound to hemoglobin.
One gram of hemoglobin binds approximately:
[
1.34 \text{ mL O₂}
]
The oxygen content of arterial blood is:
[
C_{aO_2} = (1.34 \times Hb \times S_{aO_2}) + (0.003 \times P_{aO_2})
]
Where:
- (C_{aO_2}) = arterial oxygen content, mL O₂/dL
- Hb = hemoglobin concentration, g/dL
- (S_{aO_2}) = arterial oxygen saturation as a decimal
- (P_{aO_2}) = arterial oxygen tension
Example
For a person with:
- Hb = 15 g/dL
- SaO₂ = 98% = 0.98
- PaO₂ = 100 mm Hg
[
C_{aO_2} = (1.34 \times 15 \times 0.98) + (0.003 \times 100)
]
[
C_{aO_2} = 19.7 + 0.3
]
[
C_{aO_2} \approx 20 \text{ mL O₂/dL}
]
Costanzo Physiology, 7th ed., pp. 223-224.
8.3 Oxygen delivery
The rate of oxygen delivery to tissues is:
[
D_{O_2} = Cardiac\ Output \times C_{aO_2}
]
More precisely:
[
D_{O_2} = CO \times C_{aO_2} \times 10
]
For:
- Cardiac output = 5 L/min
- CaO₂ = 20 mL/dL
[
D_{O_2} = 5 \times 20 \times 10
]
[
D_{O_2} = 1000 \text{ mL O₂/min}
]
At rest, body oxygen consumption is about 250 mL/min. Therefore, only approximately 25% of delivered O₂ is extracted at rest.
9. Oxyhemoglobin Dissociation Curve
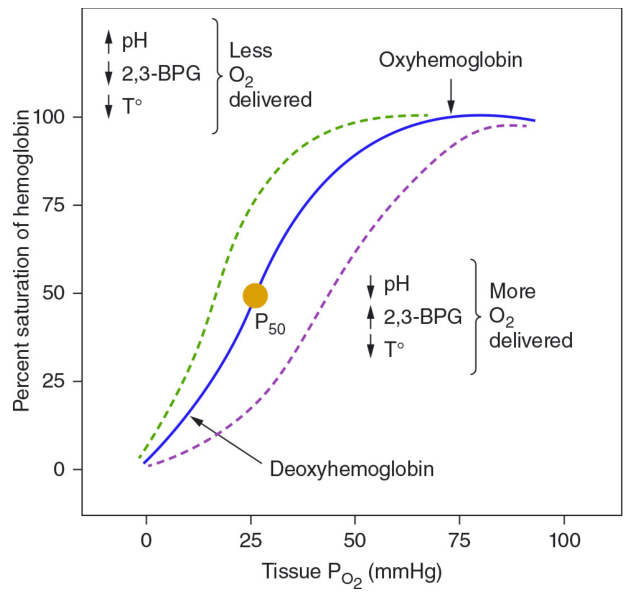
The oxyhemoglobin dissociation curve relates (P_{O_2}) to hemoglobin saturation.
It is sigmoid-shaped because hemoglobin binds O₂ cooperatively. Binding of one O₂ molecule increases affinity for subsequent O₂ molecules.
9.1 Functional importance of the curve
Plateau portion
At PaO₂ between approximately 60 and 100 mm Hg, hemoglobin saturation remains relatively high.
This protects arterial oxygen content from moderate reductions in alveolar PO₂.
Typical values:
| PaO₂ | SaO₂ |
|---|---|
| 100 mm Hg | about 97-98% |
| 60 mm Hg | about 90% |
| 40 mm Hg | about 75% |
Steep portion
At tissue PO₂ values, small decreases in PO₂ produce large decreases in hemoglobin saturation. This facilitates oxygen unloading.
At rest:
[
P_{vO_2} \approx 40 \text{ mm Hg}
]
[
S_{vO_2} \approx 75%
]
Thus, approximately 25% of hemoglobin-bound O₂ is extracted by tissues at rest.
9.2 P50
P50 is the PO₂ at which hemoglobin is 50% saturated.
For adult hemoglobin A:
[
P50 \approx 26-27 \text{ mm Hg}
]
An increased P50 indicates decreased affinity for O₂ and a right shift.
A decreased P50 indicates increased affinity for O₂ and a left shift.
9.3 Right shift
A right shift means hemoglobin has reduced affinity for O₂ and releases O₂ more readily to tissues.
Causes:
- Increased H⁺ concentration, decreased pH
- Increased PCO₂
- Increased temperature
- Increased 2,3-bisphosphoglycerate, 2,3-BPG
- Exercise
- Chronic hypoxemia
Mnemonic: CADET, face Right
- CO₂ increased
- Acid increased
- DPG, 2,3-BPG increased
- Exercise
- Temperature increased
9.4 Left shift
A left shift means hemoglobin has increased affinity for O₂ and holds O₂ more tightly.
Causes:
- Reduced H⁺ concentration, alkalosis
- Reduced PCO₂
- Reduced temperature
- Reduced 2,3-BPG
- Fetal hemoglobin
- Carbon monoxide poisoning
- Stored blood
A left shift improves hemoglobin loading in the lungs but can reduce oxygen unloading in tissues.
9.5 Bohr effect
The Bohr effect is the reduction in hemoglobin affinity for O₂ caused by increased PCO₂ and H⁺ concentration.
In tissues
Metabolically active tissues produce CO₂ and H⁺:
[
CO_2 + H_2O \leftrightarrow H_2CO_3 \leftrightarrow H^+ + HCO_3^-
]
Increased H⁺ and CO₂ shift the oxyhemoglobin curve to the right. This promotes O₂ unloading where it is most needed.
In lungs
CO₂ leaves blood and enters alveoli. Blood PCO₂ and H⁺ concentration decrease, shifting the curve left and promoting O₂ loading onto hemoglobin.
Guyton and Hall Textbook of Medical Physiology, p. 526.
10. Oxygen Exchange in Tissues
Systemic arterial blood enters tissue capillaries with:
[
P_{aO_2} \approx 95-100 \text{ mm Hg}
]
Intracellular PO₂ is much lower because O₂ is continuously used in mitochondria for oxidative phosphorylation.
Thus, O₂ moves down its partial-pressure gradient:
[
\text{Capillary blood} \rightarrow \text{Interstitial fluid} \rightarrow \text{Cells} \rightarrow \text{Mitochondria}
]
Mitochondrial PO₂ is very low, often approximately 1 to 3 mm Hg.
The amount of O₂ extracted depends on:
- Tissue metabolic rate
- Local blood flow
- Hemoglobin concentration
- Arterial oxygen content
- Capacity of tissues to use O₂
Oxygen extraction ratio
[
OER = \frac{C_{aO_2}-C_{vO_2}}{C_{aO_2}}
]
At rest, the oxygen extraction ratio is approximately 25%.
During exercise, tissues increase O₂ extraction. Mixed venous PO₂ and venous oxygen saturation decrease.
11. Carbon Dioxide Transport
CO₂ produced by tissue metabolism is carried to the lungs in three forms:
| Form of CO₂ transport | Approximate proportion |
|---|---|
| Bicarbonate, HCO₃⁻ | 60-70% |
| Carbamino compounds | 20-30% |
| Dissolved CO₂ | 5-10% |
11.1 Dissolved CO₂
A small amount of CO₂ is physically dissolved in plasma.
Because CO₂ is relatively soluble, dissolved CO₂ contributes significantly to PCO₂.
Venous PCO₂ is normally approximately 45-46 mm Hg, while arterial PCO₂ is approximately 40 mm Hg.
Guyton and Hall Textbook of Medical Physiology, p. 529.
11.2 Transport as bicarbonate
Most CO₂ is transported as bicarbonate.
In tissue capillaries:
[
CO_2 + H_2O \leftrightarrow H_2CO_3 \leftrightarrow H^+ + HCO_3^-
]
The enzyme carbonic anhydrase, abundant in red blood cells, accelerates the first reaction.
Events in systemic capillaries
- CO₂ diffuses from tissue cells into plasma and red blood cells.
- CO₂ combines with water in RBCs.
- Carbonic anhydrase forms carbonic acid.
- Carbonic acid dissociates into H⁺ and HCO₃⁻.
- H⁺ is buffered mainly by deoxyhemoglobin.
- HCO₃⁻ leaves the RBC and enters plasma.
- Cl⁻ enters the RBC to maintain electrical neutrality.
The exchange of bicarbonate out of RBCs for chloride into RBCs is called the chloride shift or Hamburger phenomenon.
[
HCO_3^- \text{ out} \quad \leftrightarrow \quad Cl^- \text{ in}
]
Guyton and Hall Textbook of Medical Physiology, pp. 528-529.
11.3 Carbaminohemoglobin
CO₂ can bind directly to terminal amino groups on globin chains of hemoglobin:
[
CO_2 + Hb-NH_2 \leftrightarrow Hb-NHCOO^- + H^+
]
This forms carbaminohemoglobin.
Deoxygenated hemoglobin binds CO₂ more readily than oxygenated hemoglobin. This promotes CO₂ uptake in tissues, where hemoglobin releases O₂.
11.4 Haldane effect
The Haldane effect describes the effect of O₂ on CO₂ transport.
In tissues
As hemoglobin releases O₂ and becomes deoxygenated:
- Its capacity to bind CO₂ increases.
- Its capacity to buffer H⁺ increases.
- More CO₂ is carried as carbaminohemoglobin and bicarbonate.
In lungs
When O₂ binds to hemoglobin:
- Hemoglobin becomes less able to bind CO₂.
- Hemoglobin releases H⁺.
- H⁺ combines with HCO₃⁻ to form CO₂ and H₂O.
- CO₂ diffuses into alveoli and is expired.
[
H^+ + HCO_3^- \leftrightarrow H_2CO_3 \leftrightarrow CO_2 + H_2O
]
The Haldane effect promotes CO₂ loading in systemic capillaries and CO₂ unloading in pulmonary capillaries.
It is quantitatively more important for CO₂ transport than the Bohr effect is for O₂ transport. Guyton and Hall Textbook of Medical Physiology, p. 530.
12. Normal Blood Gas Values
12.1 Normal arterial blood gas values
| Variable | Typical normal value |
|---|---|
| pH | 7.35-7.45 |
| PaO₂ | 80-100 mm Hg |
| PaCO₂ | 35-45 mm Hg |
| HCO₃⁻ | 22-26 mEq/L |
| Base excess | -2 to +2 mEq/L |
| SaO₂ | 95-100% |
Normal values vary with age, altitude, temperature, and inspired oxygen concentration.
12.2 Normal mixed venous blood values
| Variable | Typical mixed venous value |
|---|---|
| PvO₂ | about 40 mm Hg |
| SvO₂ | about 75% |
| PvCO₂ | about 46 mm Hg |
| pH | about 7.36 |
The arterial-venous difference reflects tissue oxygen consumption and carbon dioxide production.
12.3 Arterial oxygen content versus PaO₂
PaO₂ and oxygen content are not equivalent.
- PaO₂ measures oxygen dissolved in plasma.
- CaO₂ measures total oxygen carried in arterial blood, mainly hemoglobin-bound O₂.
Anemia
Anemia may cause severe reduction in CaO₂ even if PaO₂ and SaO₂ are normal.
Carbon monoxide poisoning
PaO₂ may be normal because dissolved oxygen is normal. However, hemoglobin oxygen-carrying capacity is reduced, resulting in low CaO₂ and tissue hypoxia.
Polycythemia
PaO₂ may be normal, but CaO₂ is increased because hemoglobin concentration is higher.
13. Acid-Base Relationship to Blood Gases
The Henderson-Hasselbalch equation for blood is:
[
pH = 6.1 + \log \left(\frac{[HCO_3^-]}{0.03 \times P_{aCO_2}}\right)
]
Thus, pH depends on the ratio of:
[
\frac{HCO_3^-}{P_{aCO_2}}
]
- Bicarbonate is mainly controlled by the kidneys.
- PaCO₂ is mainly controlled by ventilation.
Normal values:
[
pH = 7.40
]
[
HCO_3^- = 24 \text{ mEq/L}
]
[
P_{aCO_2} = 40 \text{ mm Hg}
]
13.1 Respiratory acidosis
Primary abnormality:
[
\uparrow P_{aCO_2}
]
Cause: hypoventilation.
Examples:
- CNS depression from sedative drugs
- Opioid toxicity
- Neuromuscular disease
- Severe COPD
- Severe airway obstruction
- Obesity hypoventilation syndrome
Compensation: kidneys retain bicarbonate and excrete H⁺.
13.2 Respiratory alkalosis
Primary abnormality:
[
\downarrow P_{aCO_2}
]
Cause: hyperventilation.
Examples:
- Anxiety
- Pain
- Hypoxemia
- High altitude
- Pulmonary embolism
- Pregnancy
- Sepsis
Compensation: kidneys excrete bicarbonate.
13.3 Metabolic acidosis
Primary abnormality:
[
\downarrow HCO_3^-
]
Compensatory response: hyperventilation causes a fall in PaCO₂.
Examples:
- Diabetic ketoacidosis
- Lactic acidosis
- Renal failure
- Severe diarrhea
- Toxin ingestion
13.4 Metabolic alkalosis
Primary abnormality:
[
\uparrow HCO_3^-
]
Compensatory response: hypoventilation raises PaCO₂, though compensation is limited by hypoxemia.
Examples:
- Vomiting
- Nasogastric suction
- Diuretics
- Mineralocorticoid excess
14. Alveolar-Arterial Oxygen Gradient
The alveolar-arterial oxygen gradient is:
[
A-a\ gradient = P_{AO_2} - P_{aO_2}
]
At sea level in a young healthy adult, it is usually approximately:
[
5-15 \text{ mm Hg}
]
The A-a gradient increases with age.
14.1 Causes of hypoxemia with normal A-a gradient
A normal A-a gradient indicates that oxygen transfer from alveoli to arterial blood is relatively preserved.
Causes:
- Hypoventilation
- Low inspired oxygen tension, especially high altitude
14.2 Causes of hypoxemia with increased A-a gradient
An increased A-a gradient indicates impaired transfer of oxygen from alveoli to blood.
Causes:
- V/Q mismatch
- Right-to-left shunt
- Diffusion limitation
- Reduced alveolar-capillary surface area or pulmonary capillary blood flow
15. Hypoxemia and Hypoxia
15.1 Definitions
Hypoxemia means low arterial oxygen tension:
[
\downarrow P_{aO_2}
]
Hypoxia means inadequate oxygen availability or utilization by tissues.
Hypoxemia can cause hypoxia, but hypoxia can occur with normal PaO₂.
15.2 Types of hypoxia
| Type | Main defect | PaO₂ | CaO₂ | Example |
|---|---|---|---|---|
| Hypoxemic hypoxia | Low arterial PO₂ | Low | Low | High altitude, pneumonia |
| Anemic hypoxia | Low hemoglobin | Normal | Low | Severe anemia |
| Stagnant hypoxia | Low tissue blood flow | Normal | Usually normal | Heart failure, shock |
| Histotoxic hypoxia | Cells cannot use O₂ | Normal | Normal | Cyanide poisoning |
15.3 Causes of hypoxemic hypoxia
The major mechanisms are:
- Low inspired oxygen tension
- Hypoventilation
- Diffusion limitation
- V/Q mismatch
- Right-to-left shunt
| Mechanism | PaCO₂ | A-a gradient | Response to supplemental O₂ |
|---|---|---|---|
| Low inspired O₂ | Normal or low | Normal | Good |
| Hypoventilation | High | Normal | Good |
| Diffusion limitation | Normal or low | Increased | Good |
| V/Q mismatch | Normal or low | Increased | Usually good |
| Right-to-left shunt | Variable | Increased | Limited |
16. Cyanosis
Cyanosis is bluish discoloration due to increased concentration of deoxygenated hemoglobin in blood.
It is usually clinically apparent when deoxygenated hemoglobin exceeds approximately:
[
5 \text{ g/dL}
]
Important implications
- A severely anemic patient may have profound hypoxemia without obvious cyanosis because total hemoglobin is low.
- A polycythemic patient may appear cyanosed at a relatively higher PaO₂ because total hemoglobin is high.
- Cyanosis is not a reliable measure of arterial oxygenation.
17. Effects of Exercise on Gas Exchange
During exercise:
- O₂ consumption increases.
- CO₂ production increases.
- Cardiac output increases.
- Pulmonary blood flow increases.
- Alveolar ventilation increases.
- Diffusing capacity increases.
- More pulmonary capillaries are recruited.
- V/Q matching improves.
In healthy persons, arterial PO₂ and PaCO₂ remain near normal during moderate exercise because ventilation and perfusion increase in a coordinated manner.
At active tissues:
- Temperature rises.
- CO₂ production rises.
- H⁺ rises.
- 2,3-BPG may rise over time.
These changes cause a right shift of the oxyhemoglobin dissociation curve and enhance O₂ unloading.
18. High Altitude Physiology
At high altitude, barometric pressure falls. The percentage of oxygen remains approximately 21%, but inspired PO₂ decreases.
[
P_{IO_2} = F_{IO_2}(P_B-P_{H_2O})
]
As (P_B) falls:
[
P_{IO_2} \downarrow
]
[
P_{AO_2} \downarrow
]
[
P_{aO_2} \downarrow
]
The immediate response to altitude is hyperventilation, which:
- Raises alveolar PO₂
- Lowers PaCO₂
- Produces respiratory alkalosis
Over time, acclimatization includes:
- Renal bicarbonate excretion
- Increased erythropoietin and RBC mass
- Increased 2,3-BPG
- Increased pulmonary diffusing capacity
- Increased capillary density in some tissues
At high altitude, O₂ transfer may become partly diffusion limited because the alveolar-to-capillary PO₂ gradient is reduced. Costanzo Physiology, 7th ed., p. 222.
19. Summary Table
| Feature | Oxygen | Carbon dioxide |
|---|---|---|
| Direction in lungs | Alveolus to blood | Blood to alveolus |
| Direction in tissues | Blood to tissues | Tissues to blood |
| Alveolar partial pressure | about 100 mm Hg | about 40 mm Hg |
| Arterial partial pressure | about 95-100 mm Hg | about 40 mm Hg |
| Mixed venous partial pressure | about 40 mm Hg | about 46 mm Hg |
| Major form in blood | Hemoglobin-bound | Bicarbonate |
| Main effect facilitating tissue transfer | Bohr effect | Haldane effect |
| Diffusion across lung membrane | Normally perfusion limited | Normally perfusion limited |
| Relative diffusibility | Lower | About 20 times greater than O₂ |
20. Key Examination Points
- O₂ moves from alveoli to blood, whereas CO₂ moves from blood to alveoli.
- Normal alveolar values are approximately: [ P_{AO_2}=100 \text{ mm Hg}, \quad P_{ACO_2}=40 \text{ mm Hg} ]
- Normal mixed venous values are approximately: [ P_{vO_2}=40 \text{ mm Hg}, \quad P_{vCO_2}=46 \text{ mm Hg} ]
- Alveolar ventilation, not minute ventilation, determines PaCO₂.
- The alveolar gas equation estimates PAO₂.
- V/Q mismatch is the most common cause of hypoxemia.
- Shunt produces hypoxemia that responds poorly to oxygen.
- Most O₂ is transported bound to hemoglobin.
- Most CO₂ is transported as bicarbonate.
- The Bohr effect promotes O₂ unloading in tissues.
- The Haldane effect promotes CO₂ transport and unloading in lungs.
- PaO₂ reflects dissolved oxygen, whereas CaO₂ reflects total oxygen carried in blood.
- Severe anemia may cause tissue hypoxia with normal PaO₂.
- Carbon monoxide poisoning may show normal PaO₂ despite reduced oxygen content.
- An increased A-a gradient suggests V/Q mismatch, shunt, or diffusion impairment.
Textbook references
- Costanzo Physiology, 7th ed., pp. 211-224, 223-230.
- Guyton and Hall Textbook of Medical Physiology, pp. 522-530.
This is a shared conversation. Sign in to Orris to start your own chat.