
Acute ischaemic stroke medicine question
What specifically do you want to know about acute ischaemic stroke?
What level is this for?
ischemic stroke penumbra core infarct cerebral blood flow diagram
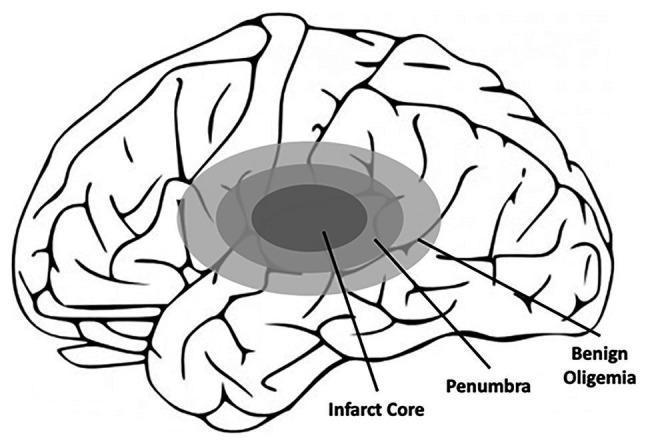
This medical schematic illustrates the pathophysiology of an ischemic stroke within the human brain, specifically identifying the concentric zones of tissue damage. The diagram uses a lateral view of the cerebral hemisphere, with simplified black outlines representing cortical gyri and sulci. Overlaid on the temporal and parietal regions is a three-tiered shaded model representing the ischemic gradient. 1. The 'Infarct Core' is the innermost, dark-shaded oval, representing irreversibly damaged necrotic tissue where blood flow is most severely restricted. 2. Surrounding the core is the 'Penumbra,' shown in a medium gray shade, representing functionally impaired but potentially salvageable tissue if reperfusion is achieved timely. 3. The outermost layer is labeled 'Benign Oligemia,' depicted in a light gray shade, representing tissue with reduced blood flow that is not yet functionally compromised and is expected to recover spontaneously. This illustration serves as a clinical education tool for understanding stroke evolution, the 'time is brain' concept, and the therapeutic target for neuroprotective and thrombolytic interventions.
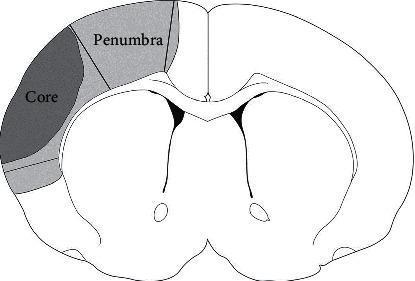
A schematic anatomical diagram depicting a coronal cross-section of a rat brain, illustrating the pathological regions associated with an ischemic stroke. The illustration highlights two distinct zones in the left cerebral cortex following middle cerebral artery occlusion (MCAO). The 'Core' (ischemic core) is represented by a dark gray shaded region, indicating the area of irreversible tissue necrosis. Adjacent to the core is the 'Penumbra' (ischemic penumbra), represented by a lighter gray shaded region. This peri-infarct area represents tissue at risk that is functionally impaired due to reduced cerebral blood flow but remains potentially salvageable. The diagram serves as an educational tool to visualize the spatial relationship between necrotic tissue and the surrounding transitional zone, which is often the target for neuroprotective and neuroplasticity-promoting pharmacological interventions.
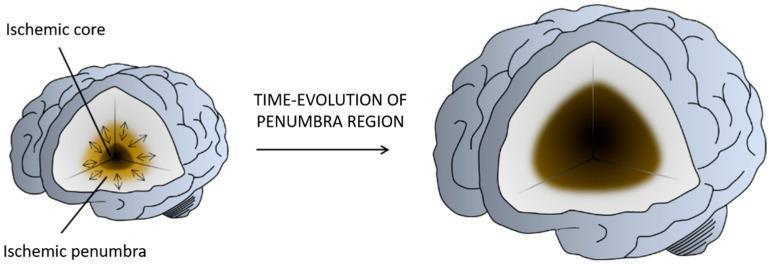
This medical illustration depicts the pathophysiology and progression of ischemic stroke within the brain, focusing on the concept of the penumbra. The diagram shows two cross-sections of the brain in a temporal sequence labeled 'TIME-EVOLUTION OF PENUMBRA REGION'. In the initial stage, an 'Ischemic core' (infarcted, irreversibly damaged tissue) is shown as a small, dark central focal point, surrounded by a larger 'Ischemic penumbra' (salvageable, hypo-perfused tissue) represented in a lighter shade. Radiating arrows from the core toward the penumbra indicate the dynamic expansion of injury. The subsequent illustration shows the final state where the ischemic core has significantly expanded, encompassing the majority of the original penumbra region, which characterizes the maturation of a cerebral infarct. This visualization serves as a neuroscientific model to explain the critical time-window for reperfusion and neuroprotective therapies aimed at rescuing salvageable brain tissue before it converts to permanent infarction.
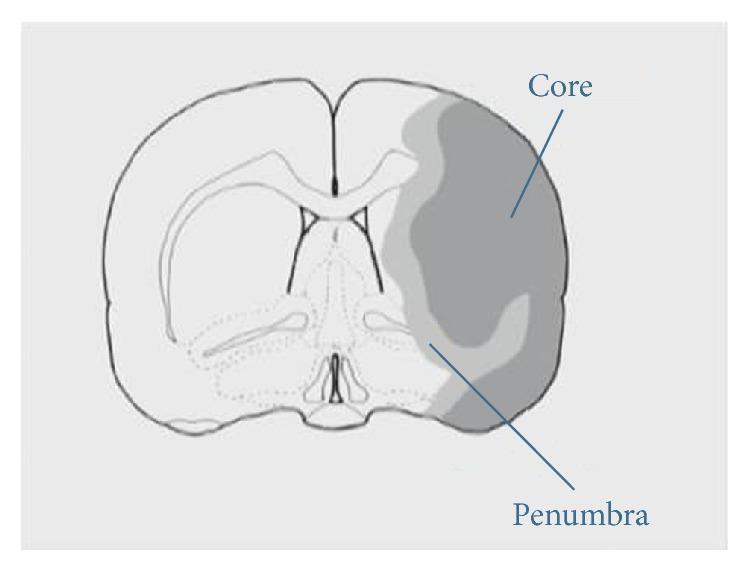
This medical schematic diagram illustrates a coronal brain section, commonly used in preclinical stroke research to represent ischemic injury. The diagram shows the bilateral hemispheres with visible internal structures including the corpus callosum, ventricles, and striatum. In the right hemisphere, a distinct pathological region is highlighted to demonstrate the spatial organization of an acute ischemic stroke. A central, darkly shaded area is labeled 'Core,' representing the ischemic core where irreversible tissue infarction typically occurs due to severe blood flow deprivation. Surrounding this central lesion is a lighter shaded region labeled 'Penumbra.' This ischemic penumbra represents the peri-infarct zone—salvageable brain tissue that is functionally impaired but metabolically viable. The diagram serves as an educational tool for neurology and neurosurgery to visualize the therapeutic window in stroke management, where the primary clinical objective is to restore perfusion to the penumbra to prevent its recruitment into the infarct core.
stroke CT scan MRI DWI diffusion weighted imaging acute ischaemic
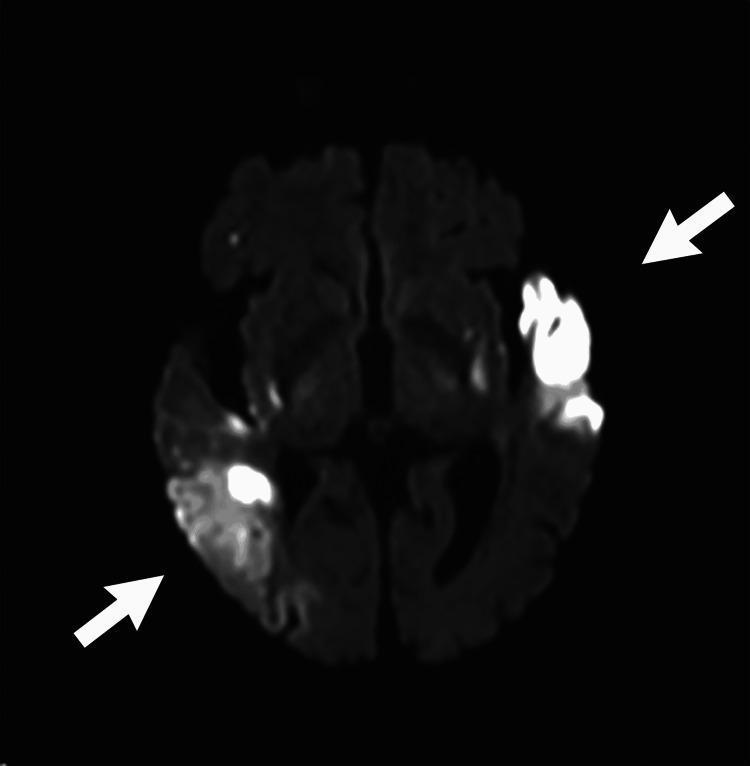
An axial Diffusion-Weighted Imaging (DWI) MRI scan of the brain demonstrating multifocal acute ischemic stroke. The image displays high signal intensity (hyperintensity) representing diffusion restriction in three primary regions, indicated by white arrows. These include the left anterior temporal lobe, the left basal ganglia, and the right posterior temporoparietal cortex. The areas of restriction appear bright white against the dark gray background of the normal cerebral parenchyma, indicating acute cytotoxic edema. The distribution of these infarcts in bilateral middle cerebral artery (MCA) territories suggests a proximal embolic source or simultaneous bilateral arterial occlusions. This imaging modality is essential for identifying early ischemic changes not visible on standard CT, facilitating the assessment of the core infarct versus salvageable penumbra in acute stroke management.
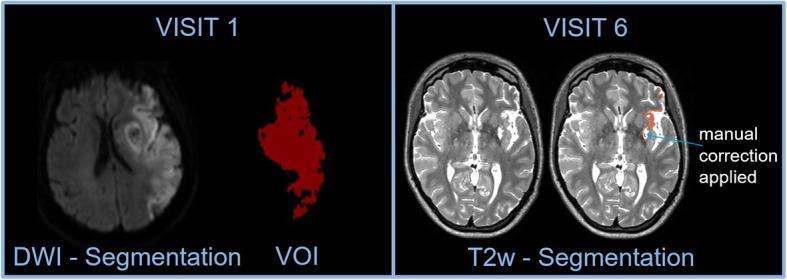
This diagnostic imaging panel demonstrates the longitudinal assessment of ischaemic stroke infarct volume via MRI. The left section (Visit 1) features a Diffusion-Weighted Imaging (DWI) axial brain scan showing a hyperintense (bright) lesion in the right hemisphere, indicative of acute infarction. Adjacent to the scan is the 'VOI' (Volume of Interest), a red binary mask representing the manual segmentation of the infarct area. The right section (Visit 6, day 90) displays T2-weighted (T2w) MRI scans. The primary scan shows the evolved hyperintense lesion, and the paired 'T2w - Segmentation' image illustrates the refined lesion boundary. An annotation indicates 'manual correction applied,' highlighting the process of adjusting the automated segmentation mask to accurately fit the T2w hyperintensity. This comparison is used in clinical research to quantify changes in lesion volume and assess treatment efficacy, such as adaptive servo-ventilation (ASV) in stroke patients with sleep-disordered breathing.
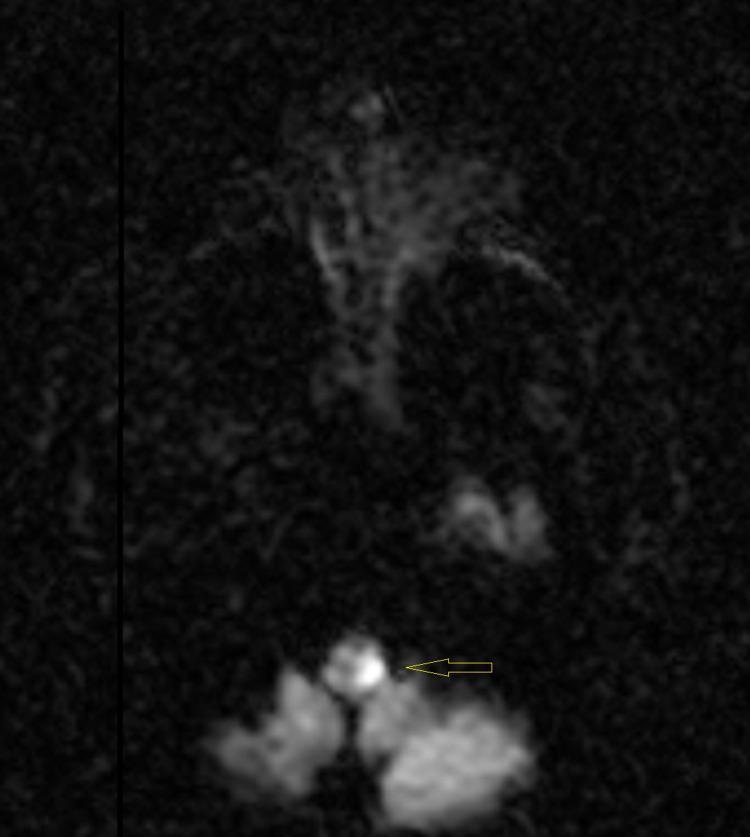
This diagnostic image is an axial Diffusion-Weighted Imaging (DWI) magnetic resonance imaging (MRI) scan of the human brain. The image shows a dark background with low signal intensity typical of this sequence, but it highlights a focal area of restricted diffusion. Specifically, there is a small, well-defined, hyperintense (bright) signal located in the left posterior medulla oblongata, indicated by a yellow arrow. This hyperintensity is roughly circular in shape and exhibits relatively sharp borders against the adjacent lower-signal brainstem parenchyma. Clinically, this finding is highly characteristic of an acute ischemic stroke in the posterior circulation, demonstrating the utility of DWI sequences in detecting early cerebral infarction that might be missed on conventional CT or early T1/T2 MRI. The image serves as an educational example of medullary stroke localization and radiographic presentation.
Acute Ischaemic Stroke: Pathophysiology & Diagnosis
1. Definition
2. Pathophysiology
2a. Mechanisms of Arterial Occlusion
| Mechanism | Typical Vessel Affected | Example Causes |
|---|---|---|
| Thromboembolism | Large intracranial vessels (MCA, ICA) | Atrial fibrillation, carotid plaque (artery-to-artery embolism) |
| In-situ thrombosis | Small penetrating arteries | Hypertension, diabetes (lipohyalinosis) - lacunar stroke |
| Hypoperfusion | Watershed zones (border zones) | Critical carotid stenosis, cardiac failure |
2b. The Ischaemic Cascade
- CBF → 0: brain tissue death in 4-10 minutes
- CBF <16-18 mL/100 g/min: neuronal electrical failure - clinically silent but functionally paralysed ("penumbra")
- CBF <8-10 mL/100 g/min: irreversible infarction of the core
- Infarct core: irreversibly dead tissue (necrosis). Cannot be rescued.
- Ischaemic penumbra: electrically silent but metabolically viable. Target of reperfusion therapy. Will die without treatment.
- Benign oligaemia: mildly hypoperfused, expected to recover spontaneously.
2c. Cellular Mechanisms (the ischaemic cascade)
- ATP depletion - Na+/K+-ATPase fails → cellular swelling (cytotoxic oedema)
- Glutamate excitotoxicity - depolarised neurons release excess glutamate → NMDA receptor overactivation → massive Ca2+ influx
- Ca2+ overload - activates proteases (calpains), lipases, endonucleases → cell membrane destruction
- Free radical production - lipid peroxidation, mitochondrial damage
- Nitric oxide (NO) toxicity - inducible NOS activation → peroxynitrite formation
- Inflammation - cytokine release, leucocyte infiltration, blood-brain barrier breakdown → vasogenic oedema (peaks 2-4 days)
- Apoptosis - delayed cell death in penumbral regions
2d. Collateral Circulation
3. Aetiology (Causes)
| Category | Examples |
|---|---|
| Large artery atherosclerosis | Carotid bifurcation stenosis, basilar artery stenosis |
| Cardioembolic | Atrial fibrillation (most common cardiac source), valvular disease, recent MI, dilated cardiomyopathy |
| Small vessel (lacunar) | Hypertension, diabetes causing lipohyalinosis of penetrating arteries |
| Cryptogenic | No identifiable cause despite full workup (~25%) |
4. Clinical Features & Syndromes
| Artery | Key Features |
|---|---|
| MCA (dominant) | Contralateral hemiplegia (face + arm > leg), hemisensory loss, homonymous hemianopia, aphasia (if dominant hemisphere) |
| MCA (non-dominant) | Neglect, hemi-inattention, constructional apraxia |
| ACA | Contralateral leg weakness > arm, abulia, urinary incontinence |
| PCA | Contralateral homonymous hemianopia, memory loss, alexia without agraphia |
| Vertebrobasilar | "4Ds + 4As": Diplopia, Dysarthria, Dysphagia, Dizziness + Ataxia, Alternating motor/sensory deficits |
| Lacunar syndromes | Pure motor stroke, pure sensory stroke, ataxic hemiparesis, dysarthria-clumsy hand |
5. Diagnosis
5a. Emergency Brain Imaging
- Ischaemic changes may not be visible in the first few hours
- Haemorrhage appears as hyperdense (white) on CT
- Thrombolysis is absolutely contraindicated in haemorrhage
- Hypodensity (darker region) in the affected territory
- Loss of grey-white matter differentiation
- Sulcal effacement (from oedema)
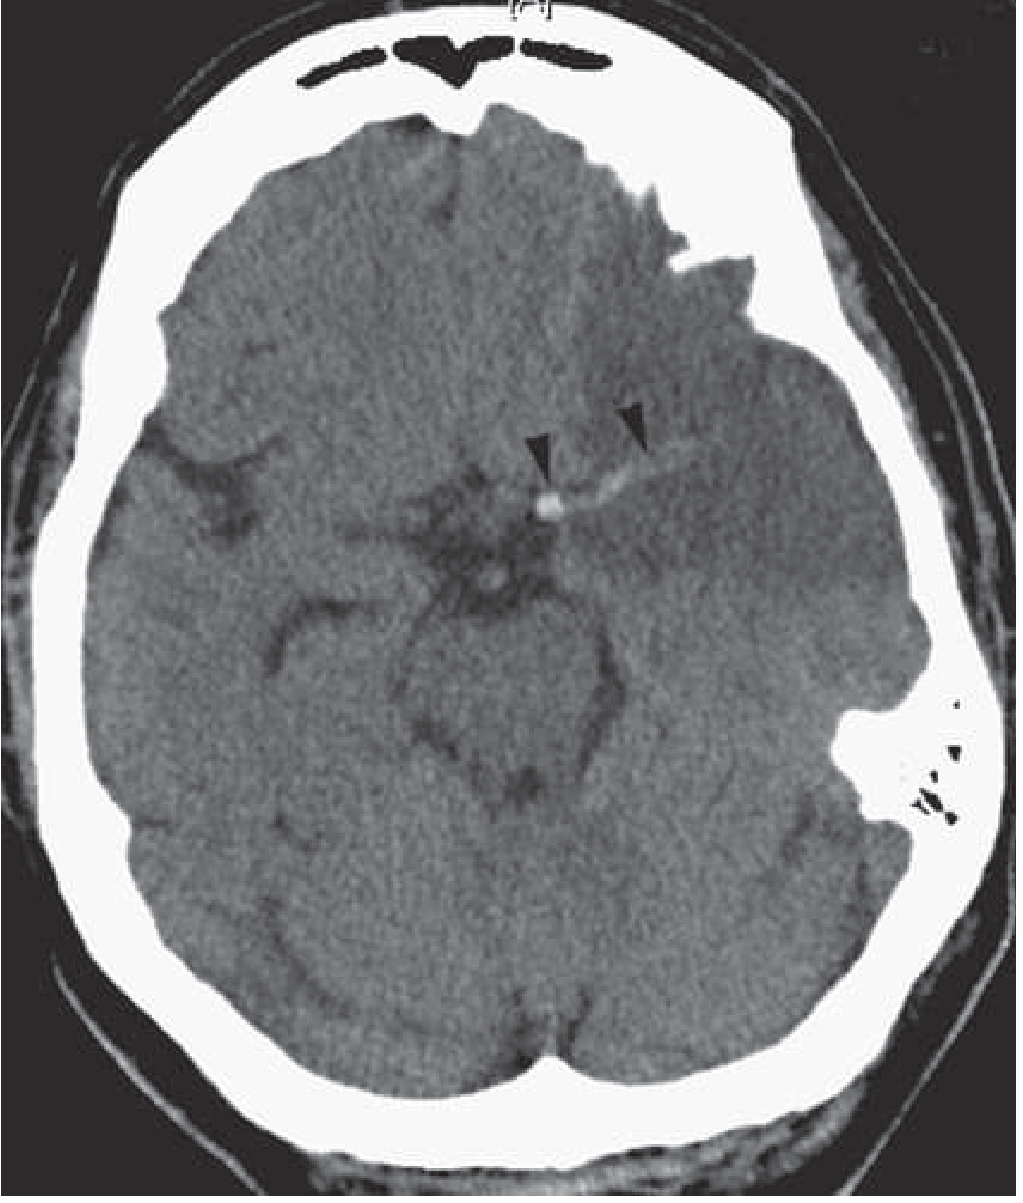
- Hyperdense MCA sign - visible clot in the M1 segment as a focal bright area (Fig. 40.32, Bradley & Daroff's Neurology)
5b. MRI
- Posterior fossa (brainstem/cerebellum) strokes
- Small lacunar infarcts
- Early acute infarction
| Sequence | Acute Infarct Appearance | Use |
|---|---|---|
| DWI (Diffusion Weighted Imaging) | Bright (hyperintense) | Most sensitive - detects within minutes of onset; restricted diffusion = cytotoxic oedema |
| ADC map | Dark (hypointense) | Confirms true restricted diffusion (rules out T2 "shine-through") |
| T2/FLAIR | Bright (but takes hours to become positive) | Delineates full extent; useful for older strokes |
5c. CT/MR Angiography (CTA/MRA)
- Identifies large vessel occlusion (LVO) - critical for thrombectomy decision
- Assesses carotid stenosis
- CTA of neck and intracranial vessels is now routine in most stroke protocols
5d. CT Perfusion / MR Perfusion
- Differentiates core (dead) from penumbra (salvageable)
- Guides thrombolysis/thrombectomy in extended time windows (up to 24 hours in selected patients)
- Perfusion-diffusion mismatch = viable penumbra
6. Additional Investigations
- ECG and cardiac monitoring - detect atrial fibrillation (most important modifiable cardiac cause)
- Echocardiogram - detect intracardiac thrombus, valvular disease, PFO
- Carotid Doppler/CTA neck - assess for treatable carotid stenosis
- Bloods: FBC (polycythaemia, thrombocytosis), coagulation screen, lipids, glucose, HbA1c
- Thrombophilia screen (if young patient or cryptogenic)
- Toxicology screen (cocaine/amphetamines can cause stroke)
7. Differential Diagnosis ("Stroke Mimics")
- Hypoglycaemia (must exclude first with finger-prick glucose)
- Todd's paresis (post-ictal focal weakness)
- Hemiplegic migraine
- Brain tumour
- Hypertensive encephalopathy
- Functional neurological disorder
- Hypo/hypernatraemia, hepatic encephalopathy
Summary
| Feature | Detail |
|---|---|
| Core mechanism | Arterial occlusion → CBF fall → penumbra + core |
| Key concept | "Time is brain" - penumbra is salvageable |
| Main causes | AF, carotid atherosclerosis, small vessel disease |
| First investigation | Non-contrast CT (exclude haemorrhage) |
| Most sensitive imaging | MRI DWI (bright) + ADC (dark) |
| Must-exclude first | Hypoglycaemia |