
Ecg basic
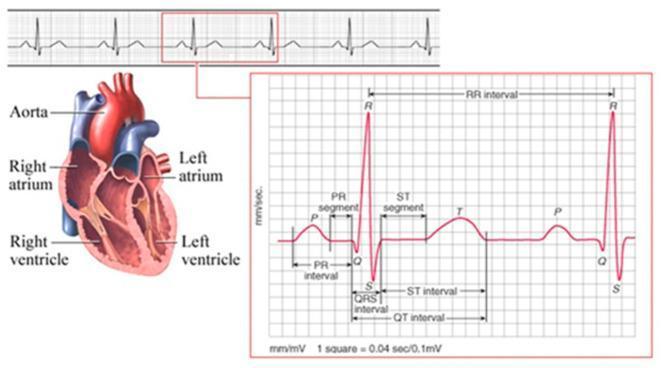
- P wave - atrial depolarization
- QRS complex - ventricular depolarization
- T wave - ventricular repolarization
- PR interval - conduction from atria to ventricles (normal: 120-200 ms)
- QRS duration - ventricular conduction time (normal: <120 ms)
- QT interval - total ventricular electrical activity
ECG 12 lead placement standard limb precordial leads
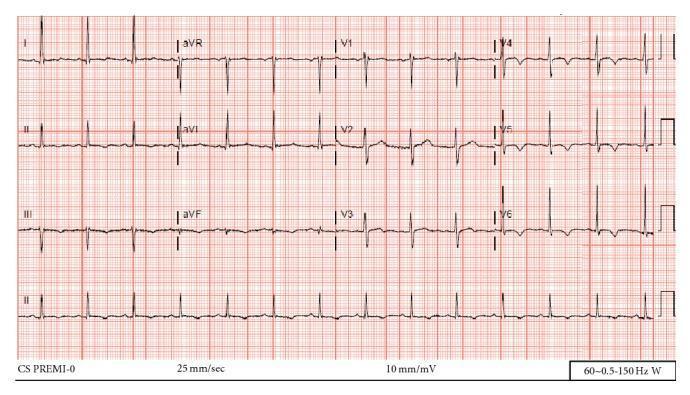
A 12-lead electrocardiogram (ECG) printed on standard grid paper (25 mm/sec, 10 mm/mV) demonstrating diagnostic features of cardiac pathology. The ECG shows a regular rhythm with a heart rate exceeding 100 beats per minute, consistent with sinus tachycardia. Key findings include high-voltage QRS complexes in the precordial leads and limb leads (notably I, II, III, and aVF), which meet voltage criteria for Left Ventricular Hypertrophy (LVH). Additionally, there is prominent T-wave inversion observed in the lateral precordial leads (V4, V5, and V6), a finding that can be associated with LVH 'strain' patterns or myocardial ischemia in the clinical context of aortic dissection and hypertension. The trace displays standard lead placement including limb leads (I, II, III, aVR, aVL, aVF) and precordial leads (V1-V6), with a rhythm strip provided at the bottom (Lead II). This visual is representative of the electrical manifestations of structural heart disease secondary to hypertensive or valvular complications.
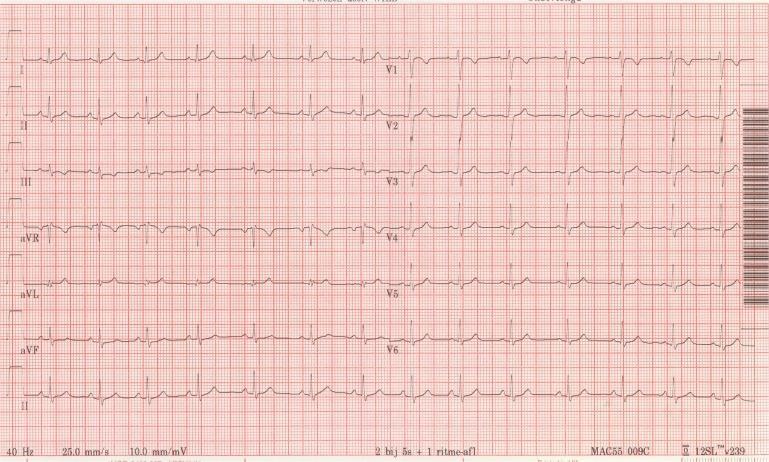
This diagnostic image shows a standard 12-lead electrocardiogram (ECG) printed on red-grid thermal paper. The recording displays limb leads (I, II, III), augmented vector leads (aVR, aVL, aVF), and precordial leads (V1-V6), accompanied by a continuous rhythm strip of Lead II at the bottom. The tracing demonstrates a normal sinus rhythm with consistent P-wave morphology preceding each QRS complex, followed by regular T-waves. All intervals, including the PR and QT intervals, appear within physiological limits for a healthy human heart. Lead V1 shows a typical small r-wave with a larger S-wave, while V6 demonstrates a dominant R-wave, indicating normal R-wave progression across the precordial leads. Technical parameters visible at the bottom of the strip indicate a standard sweep speed of 25.0 mm/s and a voltage calibration of 10.0 mm/mV. This ECG is presented as a reference for correct lead placement and normal electrical conduction after correcting previous technical errors.
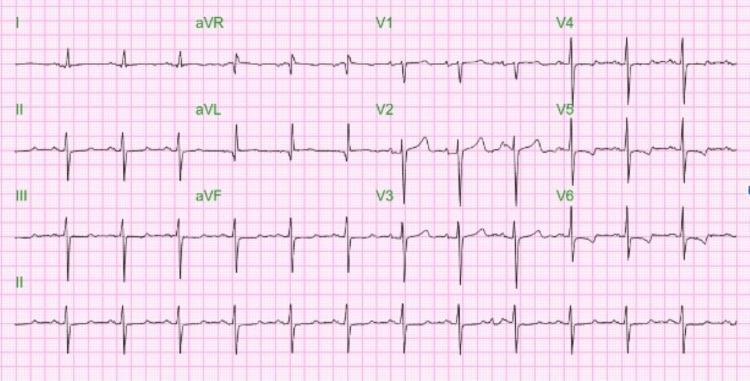
This diagnostic image is a 12-lead electrocardiogram (ECG/EKG) displayed on a standard pink grid background. The tracing shows a regular rhythm with a heart rate of approximately 77 beats per minute. Key visual findings include narrow QRS complexes across both limb leads (I, II, III, aVR, aVL, aVF) and precordial leads (V1-V6). In the limb leads, distinct Q, R, and S waves are visible with no significant slurring or notching. T waves are upright in leads I, II, aVF, and V4-V6, while inverted in aVR. Precordial leads show normal R-wave progression from V1 to V6. The ECG represents a post-intervention state following the placement of a transvenous pacemaker (TVP) for a previous complete heart block and hyperkalemia. The current tracing demonstrates resolution of previous bradycardia and successful stabilization of the cardiac rhythm with improved QRS and T wave morphology.
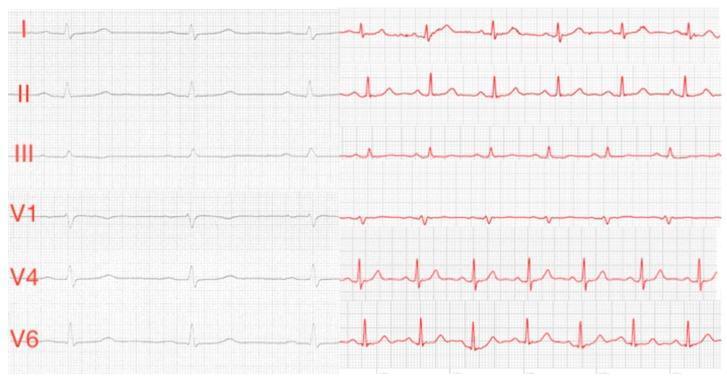
This diagnostic image is a comparison chart of electrocardiography (ECG) tracings, displaying a side-by-side assessment of six leads (I, II, III, V1, V4, and V6). The left column shows standard 12-lead ECG recordings in black, while the right column shows corresponding single-lead ECGs captured by a smartwatch (Apple Watch) in red. The image demonstrates high morphological correlation between the two modalities across Einthoven limb leads (I-III) and Wilson-like chest leads (V1, V4, V6). Key visual features include visible P waves, sharp QRS complexes, and T waves in both sets. Notably, the smartwatch recordings (red) exhibit higher relative amplitudes and slightly more baseline wander compared to the standard ECG (black). In lead V1, both modalities show a predominant S-wave, reflecting correct precordial placement. This educational material serves to illustrate the clinical utility and signal quality of consumer-grade wearables in mimicking standard diagnostic leads for heart rhythm and waveform analysis.
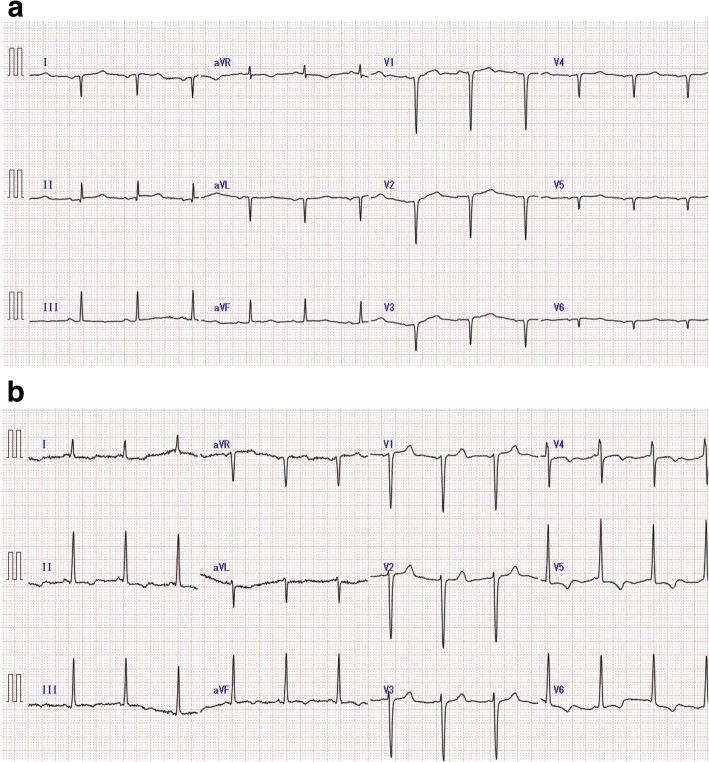
This diagnostic image consists of two 12-lead electrocardiograms (ECG) labeled (a) and (b), illustrating the electrical manifestations of situs inversus totalis and comorbid coronary artery disease. Panel (a) shows an ECG with standard lead placement, demonstrating a negative P-wave in leads I and aVL and a positive P-wave in lead aVR, characteristic of dextrocardia. Panel (b) shows the ECG after correcting for situs inversus by reversing the right and left limb leads and placing chest leads in a mirror-image configuration on the right side of the thorax. This corrected view reveals underlying ischemic changes, specifically ST-segment depression in the lateral leads (I, aVL, V5, V6) and T-wave inversions in the inferior (II, III, aVF) and precordial (V4-V6) leads. These visual findings provide a clinical comparison between the baseline electrical axis abnormalities seen in situs inversus and the subsequent diagnosis of multi-vessel coronary artery disease through modified lead positioning.
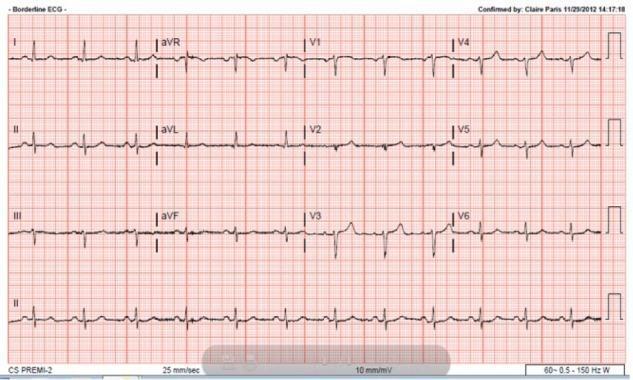
A 12-lead electrocardiogram (ECG) recorded at a standard paper speed of 25 mm/sec and calibration of 10 mm/mV. The tracing demonstrates low QRS voltage throughout both the limb leads (I, II, III, aVR, aVL, aVF) and the precordial leads (V1–V6). In the precordial leads specifically, there is notable 'poor R wave progression' (PRWP), characterized by the failure of the R wave amplitude to increase appropriately from V1 through V4. Instead of the typical transition to a dominant R wave by lead V3 or V4, the R waves remain stunted and small across the chest leads. These findings are clinically significant as they can be associated with various conditions including prior anterior myocardial infarction, cardiomyopathy, pulmonary disease (e.g., COPD), or technical factors like obesity or improper lead placement. The rhythm appears to be sinus, and the baseline shows no significant ST-segment or T-wave abnormalities in this view.
normal sinus rhythm ECG waveform P wave QRS T wave intervals labeled
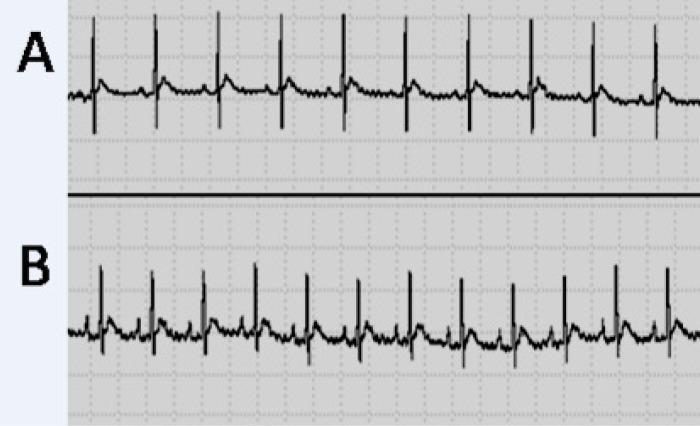
This diagnostic image shows two comparative electrocardiogram (ECG) rhythm strips, labeled A and B, displayed on a standard grid background. Both strips demonstrate a regular sinus rhythm with clearly identifiable P waves, QRS complexes, and T waves. Sample A represents a baseline or 'sham' control group, showing stable R-R intervals and standard waveform morphology. Sample B represents an experimental group (traumatic brain injury model) used to evaluate autonomic and cardiac effects. While the basic sinus rhythm remains intact, Sample B demonstrates subtle variations in the cardiac cycle, specifically in the P-wave duration and P-R interval as noted in related clinical studies. The ST segments in both samples appear isoelectric with no evidence of significant elevation or depression, and the T waves show normal upward deflection. This comparison is used in medical education to illustrate how systemic injuries, such as diffuse traumatic brain injury, can influence cardiac electrical activity and conduction intervals despite the absence of gross structural heart damage.
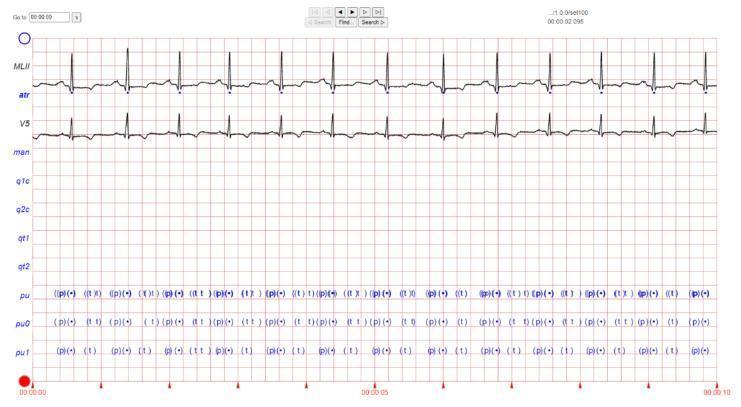
A diagnostic image showing a multi-lead electrocardiogram (ECG) waveform display on a standard red grid background. The image presents two continuous traces labeled as 'MLII' (Modified Limb Lead II) and 'V5', which are common leads used for arrhythmia monitoring. The waveforms demonstrate regular R-R intervals and narrow QRS complexes, with visible P waves and T waves associated with each heartbeat. Below the waveforms, structured text annotations (including labels 'pu', 'pu0', and 'pu1') provide algorithmic beat-by-beat analysis and fiducial point markings, such as identified P and T wave peaks. Time stamps are visible along the x-axis, ranging from 00:00:00 to 00:00:10, indicating a 10-second recording segment. This visual material is used in medical education to demonstrate normal sinus rhythm versus rhythm disturbances (arrhythmias) and to illustrate digital ECG signal processing and annotation techniques found in clinical database software like PhysioNet.
ECG Basics - A Complete Overview
The ECG Paper
- Small square = 1 mm = 0.04 sec (40 ms) horizontally; 0.1 mV vertically
- Large square = 5 mm = 0.20 sec (200 ms)
- 5 large squares = 1 second
The Normal ECG Waveform
P Wave
- Represents atrial depolarization (electrical activation of both atria)
- Originates from the SA (sinoatrial) node
- Normal: upright in leads I and II; negative in aVR
- Duration: <120 ms; amplitude: <2.5 mm
- The normal atrial depolarization vector points downward and to the left, so P waves are positive in lead II and negative in aVR. A retrograde P wave (negative in II, positive in aVR) indicates an ectopic atrial or AV junctional pacemaker - Harrison's Principles of Internal Medicine, p.1913
PR Interval
- From the start of the P wave to the start of the QRS complex
- Represents conduction time from SA node through the AV node to the ventricles
- Normal: 120-200 ms (3-5 small squares)
- Short PR (<120 ms): pre-excitation (e.g., Wolff-Parkinson-White)
- Long PR (>200 ms): first-degree AV block
QRS Complex
- Represents ventricular depolarization
- Named by convention: Q = first negative deflection; R = first positive deflection; S = negative deflection after R
- Normal duration: <120 ms (3 small squares)
- Ventricular depolarization happens in two phases:
- Septal depolarization - left to right, anteriorly (produces small r in V1, small q in V6)
- Main ventricular depolarization - left ventricle dominates, vector points left and posteriorly (large R in V6, large S in V1) - Harrison's Principles, p.1913
ST Segment
- From the end of QRS (J-point) to the start of the T wave
- Represents the plateau phase of the ventricular action potential
- Normally isoelectric (flat, on the baseline)
- Elevation = injury/infarction or pericarditis; depression = ischemia or reciprocal change
T Wave
- Represents ventricular repolarization
- Normally upright in I, II, V3-V6; inverted in aVR
- Normally the T-wave vector is roughly concordant with the mean QRS vector - because repolarization proceeds in the opposite direction from depolarization (epicardium to endocardium) - Harrison's Principles, p.1913
U Wave
- Small, rounded deflection after T wave; same polarity as T wave
- Amplitude normally ≤1 mm
- Prominent U waves: hypokalemia, or drugs like amiodarone, sotalol, quinidine (risk of torsades de pointes)
QT Interval
- From start of QRS to end of T wave
- Represents total ventricular electrical activity (depolarization + repolarization)
- Normal QTc (corrected for heart rate): <440 ms in men, <460 ms in women
- Prolonged QT = risk of torsades de pointes
The 12-Lead ECG
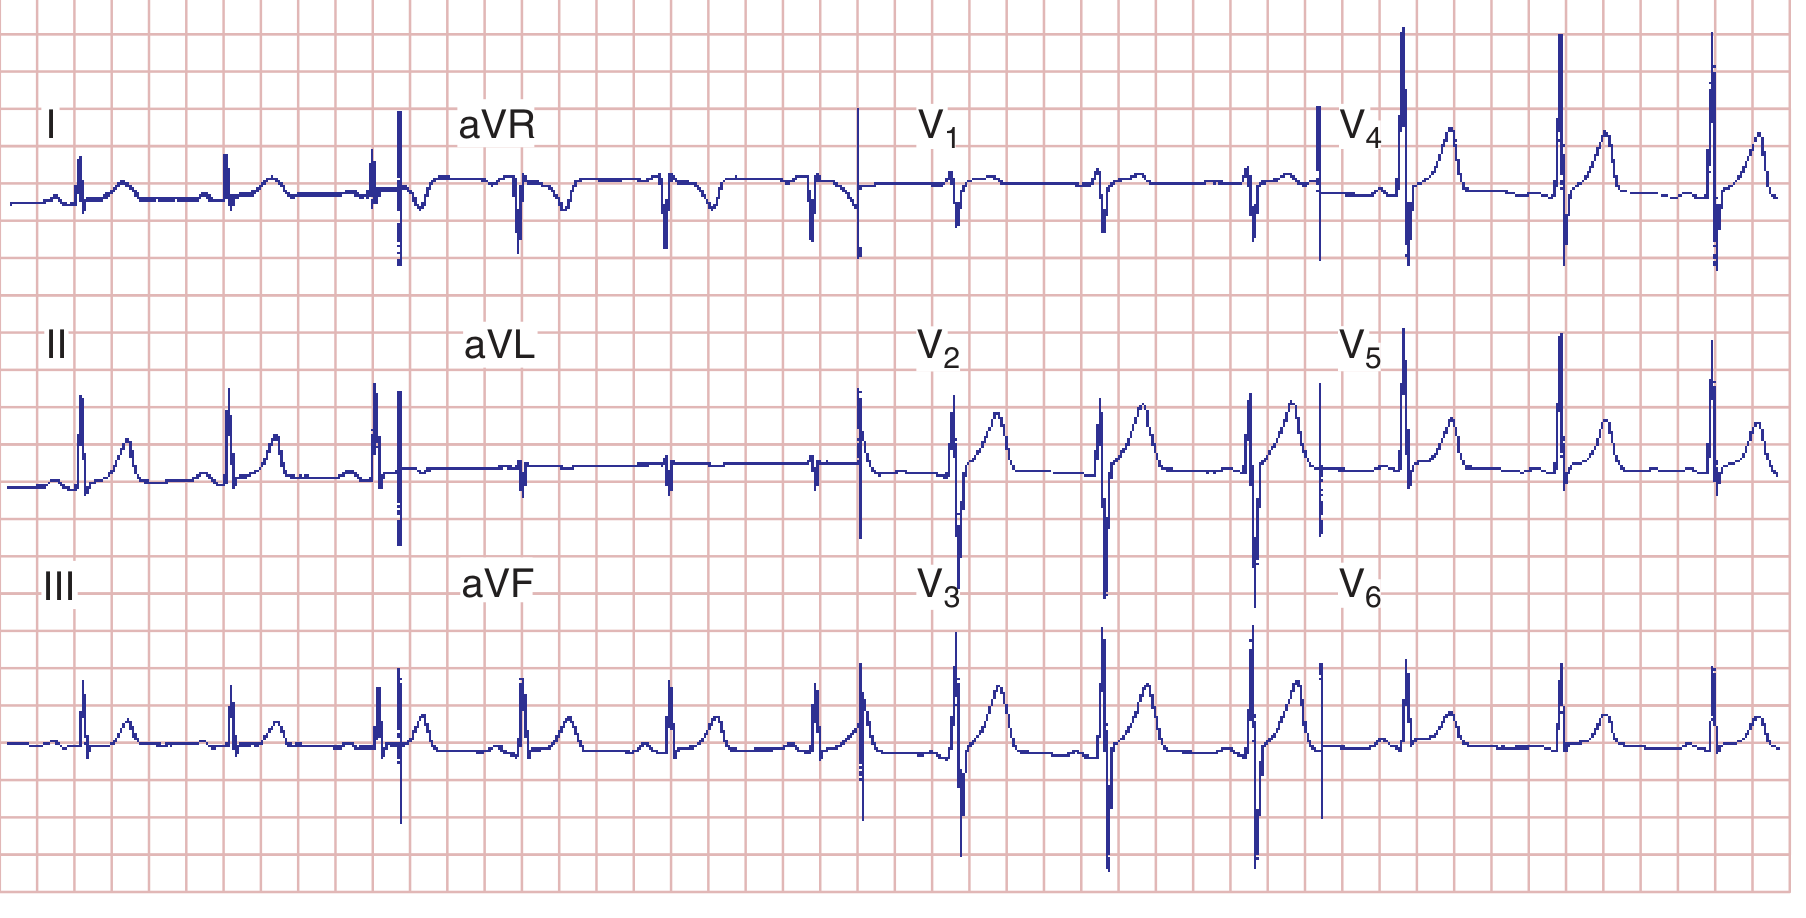
Normal 12-lead ECG from a healthy subject (Harrison's Fig. 247-7):
Limb Leads (Frontal Plane)
| Lead | View | Normal P wave | Normal QRS |
|---|---|---|---|
| I | Lateral | Upright | Predominantly positive |
| II | Inferior-lateral | Upright | Predominantly positive |
| III | Inferior | Variable | Variable |
| aVR | Right/Cavity | Negative | Predominantly negative |
| aVL | High lateral | Upright | Variable |
| aVF | Inferior | Upright | Variable |
Precordial (Chest) Leads (Horizontal Plane)
- V1-V2: Right ventricle - small r, large S
- V3-V4: Transition zone - R/S ratio approaches 1
- V5-V6: Left ventricle - large R, small or no S
- R-wave progressively increases from V1 to V5/V6 (called R-wave progression)
Calculating Heart Rate
- Regular rhythm: Rate = 300 ÷ (number of large squares between R-R intervals)
- 1 large square = 300 bpm; 2 = 150; 3 = 100; 4 = 75; 5 = 60; 6 = 50
- Irregular rhythm: Count QRS complexes in 10 seconds × 6 = rate per minute
Systematic ECG Interpretation (The RRIAMIS Approach)
| Step | What to Assess |
|---|---|
| 1. Rate | Normal 60-100 bpm; tachy >100; brady <60 |
| 2. Rhythm | Regular vs. irregular; P before every QRS? |
| 3. Intervals | PR (120-200 ms), QRS (<120 ms), QTc (<440 ms) |
| 4. Axis | Normal: -30° to +100°; LAD or RAD? |
| 5. Morphology | P wave, QRS, ST, T shape in each lead |
| 6. Ischemia/Infarction | ST elevation/depression, T inversions, Q waves |
| 7. Summary | Synthesize findings |
Normal ECG Intervals at a Glance
| Parameter | Normal Range |
|---|---|
| Heart rate | 60-100 bpm |
| PR interval | 120-200 ms |
| QRS duration | <120 ms |
| QTc | <440 ms (men), <460 ms (women) |
| QRS axis | -30° to +100° |
| P wave amplitude | <2.5 mm |
| P wave duration | <120 ms |
Key Cardiac Axis (QRS Axis)
- Normal: -30° to +100°
- Left axis deviation (LAD): more negative than -30° → LVH, left anterior fascicular block, inferior MI
- Right axis deviation (RAD): more positive than +100° → RVH, left posterior fascicular block, lateral MI, dextrocardia