Explain me 10 common of those diseases heart diseases with ECG changes and ECC images of those diseases
Reading File
Finding Sources
Searching the Web
10 common heart diseases ECG changes patterns images cardiology
Finding Sources
Finding Sources
Searching the Web
ECG images STEMI atrial fibrillation heart block LVH pericarditis pulmonary embolism cardiology diagrams
Finding Sources
Finding Sources
Loading Image
Reading File
Loading Image
Searching the Web
ECG atrial fibrillation STEMI complete heart block ventricular tachycardia LVH real ECG strip images
Loading Image
Loading Image
Reading Web Page
ECG changes heart diseases STEMI atrial fibrillation LVH bundle branch block pericarditis pulmonary embolism
Loading Image
Finding Sources
Searching the Web
site:ecg.utah.edu ECG images STEMI LVH atrial fibrillation pulmonary embolism S1Q3T3
Loading Image
Loading Image
Loading Image
Loading Image
Loading Image
I've used up my fetch_image budget. I have several good images already fetched. Let me now compile the comprehensive answer with all the information gathered.
10 Common Heart Diseases with ECG Changes
Here is a detailed guide covering 10 major cardiac conditions, their clinical features, and their characteristic ECG patterns - drawing from Braunwald's Heart Disease and Fuster and Hurst's The Heart.
Overview Reference - 10 Must-Know ECG Rhythms

1. ST-Elevation Myocardial Infarction (STEMI)
Pathophysiology: Complete and prolonged occlusion of a coronary artery causes transmural (full-thickness) myocardial ischemia and necrosis. The LAD typically causes anterior STEMI; RCA causes inferior STEMI.
ECG Changes (sequential):
- Hyperacute T waves - tall, peaked, broad T waves (very early, minutes after occlusion)
- ST elevation - convex ("tombstone") upward in leads facing the infarct zone (>1 mm limb leads, >2 mm precordial leads)
- Reciprocal ST depression - in leads opposite to the infarct
- Pathological Q waves - appear within hours to days, indicate necrosis (>40 ms wide, >25% of R wave height)
- T wave inversion - develops over hours/days
Localization by leads:
| Territory | ST Elevation Leads | Artery |
|---|---|---|
| Anterior | V1-V4 | LAD |
| Inferior | II, III, aVF | RCA |
| Lateral | I, aVL, V5-V6 | Circumflex |
| Posterior | V7-V9; reciprocal STD V1-V3 | RCA/Circumflex |
New LBBB in the setting of chest pain is treated as a STEMI equivalent (Sgarbossa criteria).
2. NSTEMI / Unstable Angina
Pathophysiology: Partial coronary occlusion or severe stenosis causing subendocardial (non-transmural) ischemia.
ECG Changes:
- ST depression (horizontal or downsloping) in ischemic leads
- T wave inversion - deep, symmetrical ("Wellens' syndrome" - deep TWI in V1-V4 = critical LAD stenosis)
- Hyperacute T waves (early, transient)
- Normal ECG in up to 30% of cases - diagnosis made by troponin elevation
- No pathological Q waves develop (subendocardial injury)
Key difference from STEMI: No ST elevation; troponins elevated but less than STEMI.
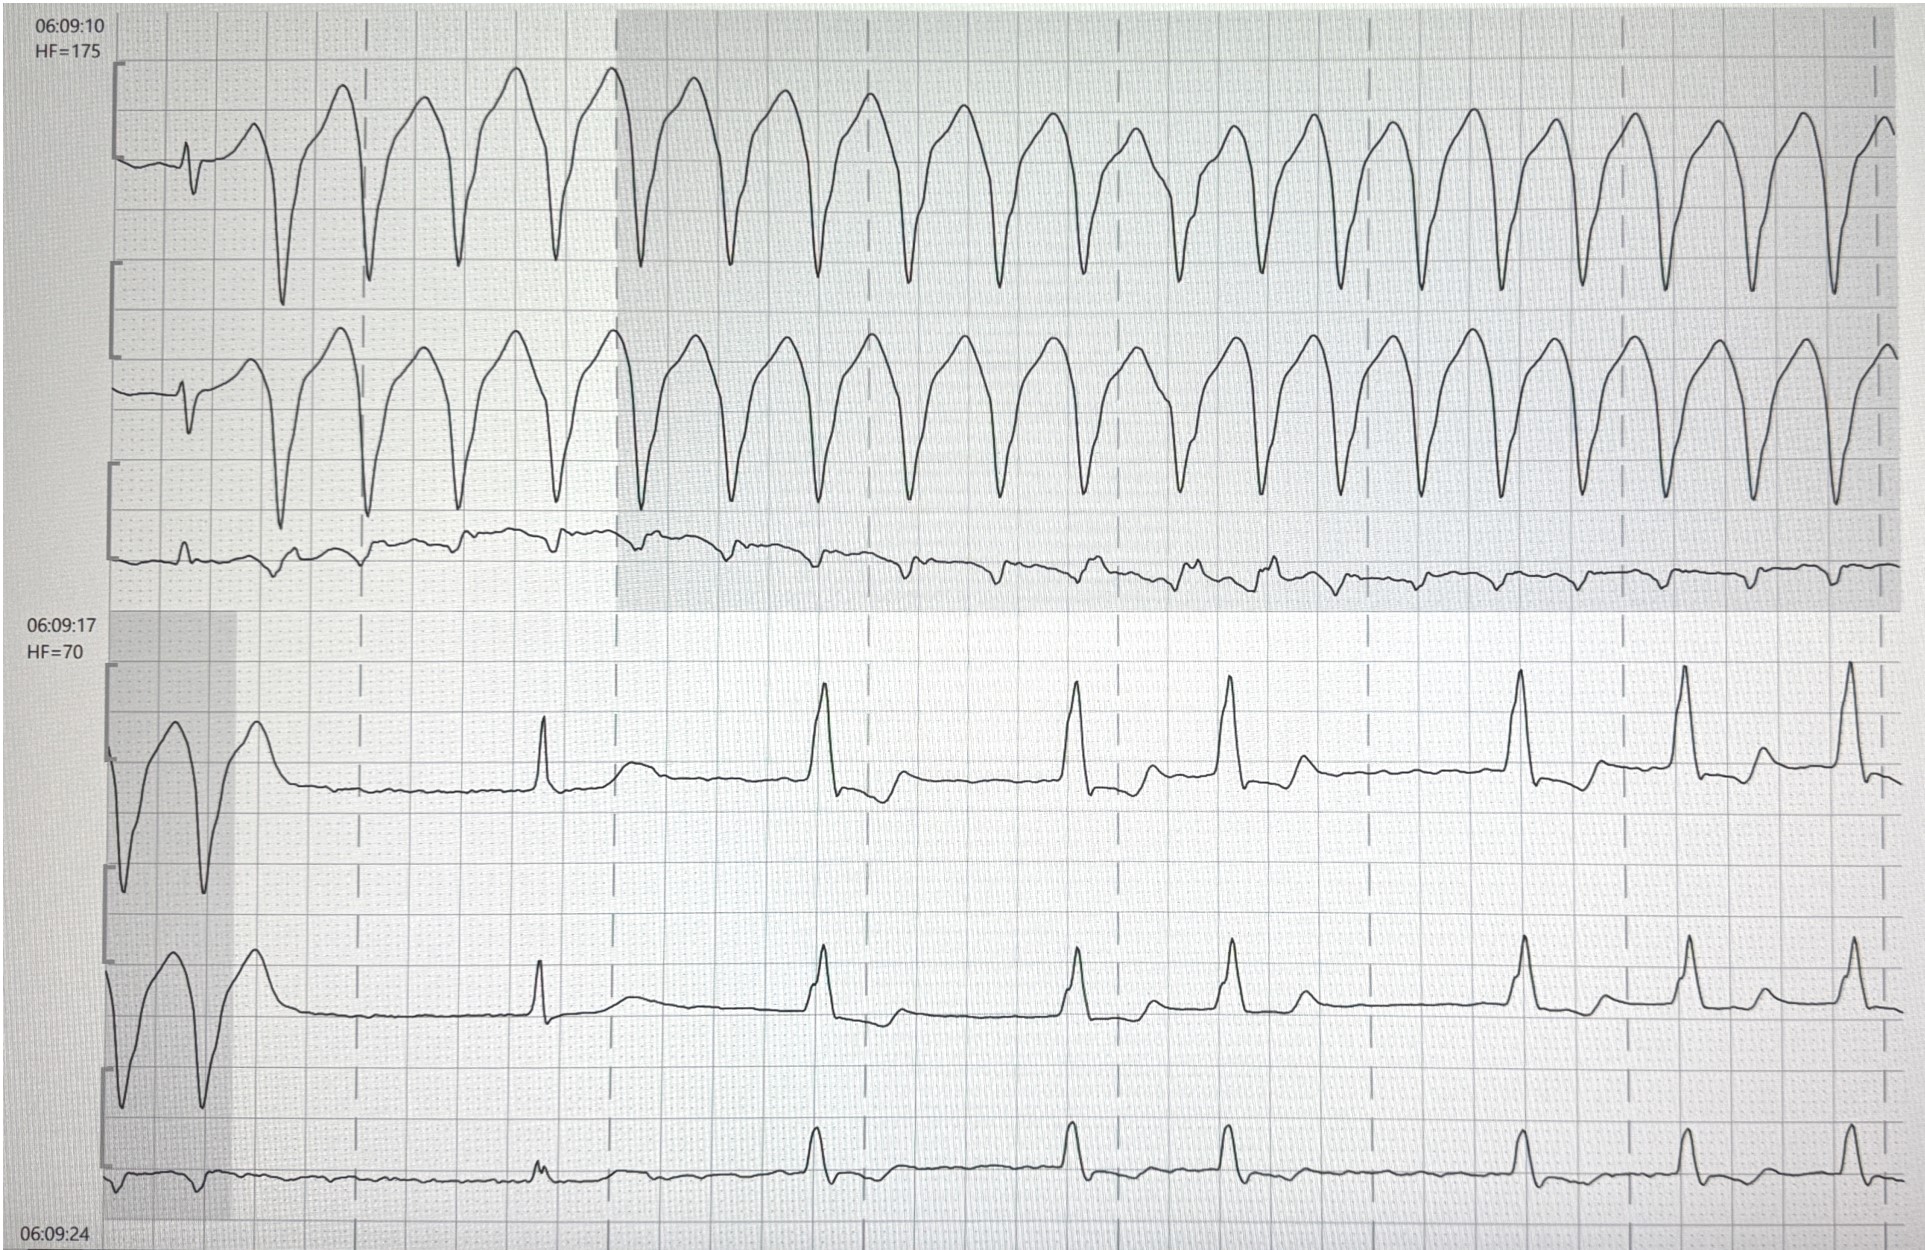
3. Atrial Fibrillation (AF)
Pathophysiology: Chaotic, disorganized atrial depolarization at 300-600 impulses/min. The AV node acts as a gatekeeper, conducting only a fraction irregularly to the ventricles.
ECG Changes:
- No P waves - replaced by irregular fibrillatory baseline (f waves)
- Irregularly irregular RR intervals - the hallmark
- Narrow QRS (unless aberrant conduction or pre-existing BBB)
- Rate may be fast (uncontrolled, >100 bpm), controlled (60-100), or slow (with AV nodal disease)
The image below shows VT transitioning to AF - note the wide-complex tachycardia at HF=175 converting to narrow irregular rhythm at HF=70:
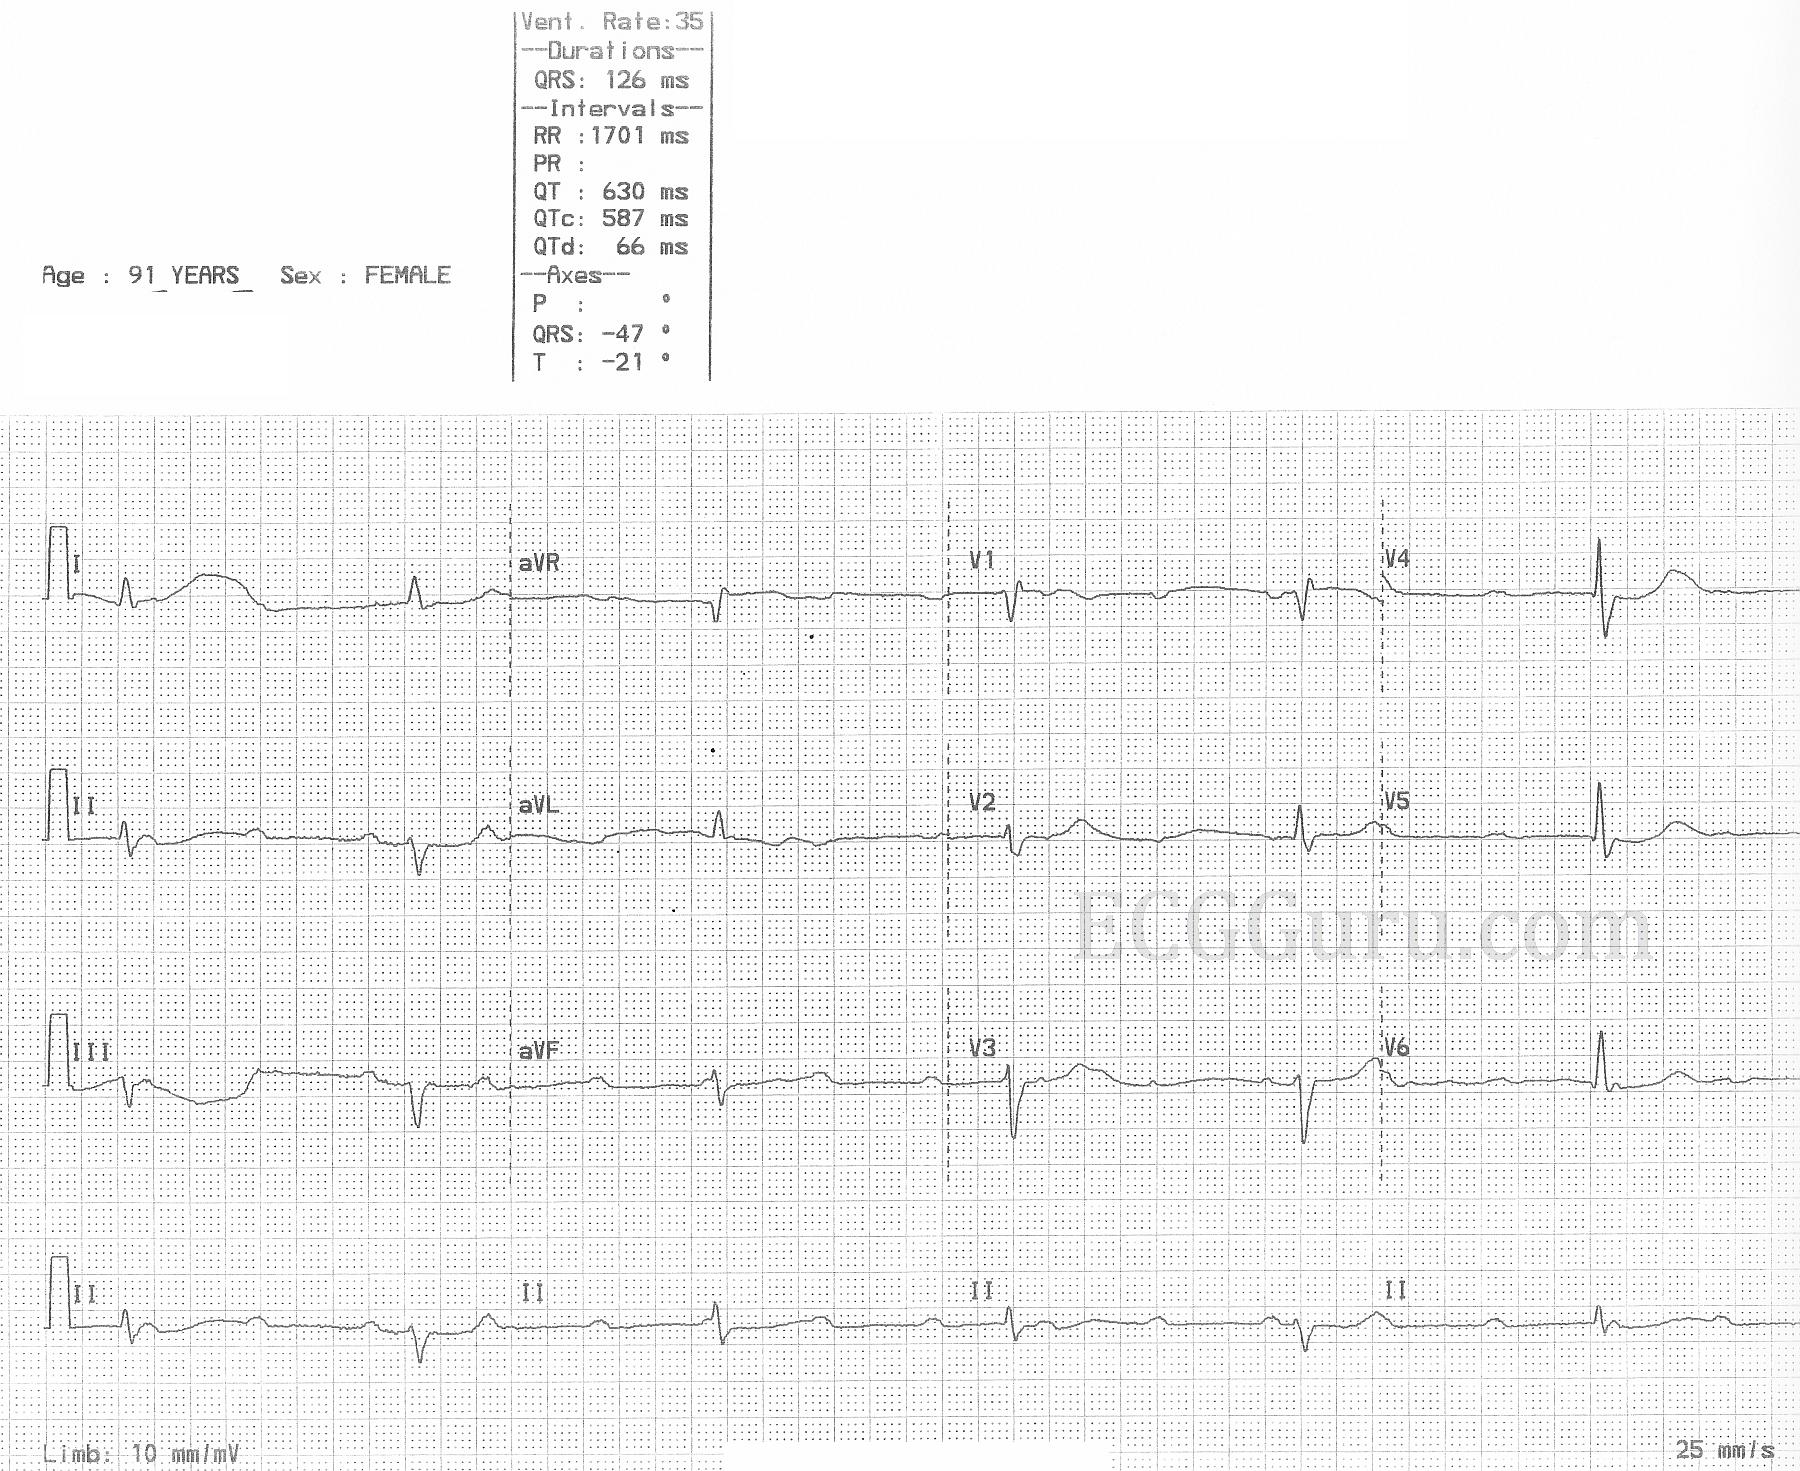
4. Complete (Third-Degree) AV Block
Pathophysiology: Complete failure of AV nodal/His-Purkinje conduction - atria and ventricles beat independently. A ventricular escape rhythm takes over at 20-40 bpm.
ECG Changes:
- P waves and QRS are dissociated - P-P interval is regular, R-R interval is regular, but PR interval is completely variable (AV dissociation)
- Slow ventricular rate (20-40 bpm junctional; 20-40 bpm ventricular escape)
- Wide QRS if escape is ventricular (>120 ms); narrow if junctional
- No relationship between P waves and QRS
The ECG below shows a 91-year-old female with complete AV block: ventricles fire at 35 bpm (RR = 1701 ms), QRS = 126 ms (wide escape), QTc = 587 ms (prolonged), with total AV dissociation:
5. Ventricular Tachycardia (VT)
Pathophysiology: Rapid, sustained ectopic ventricular activation originating below the bundle of His. Often occurs in the setting of prior MI (scar re-entry), cardiomyopathy, or electrolyte disturbance. Rate 100-250 bpm.
ECG Changes:
- Wide QRS tachycardia (>120 ms) - broad, bizarre complexes
- Rate 100-250 bpm, regular
- AV dissociation - P waves visible but unrelated to QRS (if visible)
- Capture beats - occasional narrow QRS (sinus beat captures ventricle briefly)
- Fusion beats - intermediate morphology between sinus and VT beat
- Concordance - all precordial leads point same direction (all positive = positive concordance; all negative = negative concordance) - suggests VT not SVT with aberrancy
The ECG below shows a 12-lead during VT (HF=175) - note the wide bizarre complexes, followed by conversion to a narrower escape rhythm at HF=70:
6. Left Ventricular Hypertrophy (LVH)
Pathophysiology: Chronic pressure overload (hypertension, aortic stenosis) or volume overload causes hypertrophy of the left ventricular myocardium, creating increased electrical forces.
ECG Changes - Voltage Criteria:
- Sokolow-Lyon: S in V1 + R in V5 or V6 > 35 mm
- Cornell voltage: R in aVL + S in V3 > 28 mm (men) or >20 mm (women)
- Romhilt-Estes point scoring system
Repolarization (Strain Pattern):
- ST depression + T wave inversion in lateral leads (I, aVL, V5-V6) - "strain pattern" - indicates subendocardial ischemia from hypertrophy
- Left axis deviation often present
- Left atrial enlargement (P mitrale) - broad, bifid P wave in lead II (>120 ms), negative terminal deflection in V1
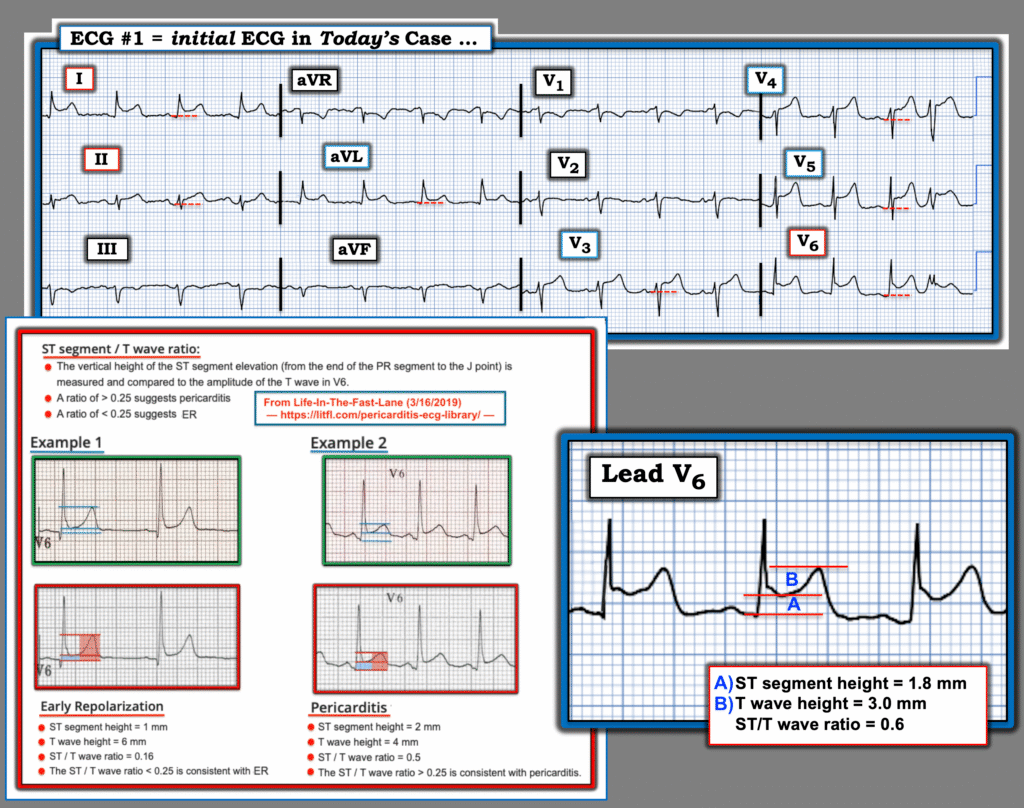
7. Pericarditis (Acute)
Pathophysiology: Inflammation of the pericardium from viral infection, autoimmune disease, uremia, post-MI (Dressler's), or post-cardiac surgery. The inflammation spreads superficially to the epicardium.
ECG Changes (4 classic stages):
| Stage | Timing | Changes |
|---|---|---|
| Stage 1 | Hours-days | Diffuse ST elevation (saddle-shaped/concave up) in nearly all leads EXCEPT aVR and V1; PR depression in II, III, aVF, V4-V6 |
| Stage 2 | Days | ST returns to baseline; T waves flatten |
| Stage 3 | Days-weeks | T wave inversion in leads that had ST elevation |
| Stage 4 | Weeks | ECG normalizes |
Key distinction from STEMI:
- Concave (saddle-shaped) ST elevation vs. convex in STEMI
- Diffuse (multiple territories) vs. localized
- PR depression in pericarditis (not in STEMI)
- No reciprocal ST depression (except aVR)
- ST/T wave ratio in V6: >0.25 suggests pericarditis, <0.25 suggests early repolarization
The ECG below shows pericarditis features with ST-T ratio analysis - ratio >0.25 in V6 indicates pericarditis:
8. Pulmonary Embolism (PE)
Pathophysiology: Acute RV pressure overload from pulmonary artery obstruction causes RV strain pattern on ECG.
ECG Changes:
- Sinus tachycardia - most common finding (~40%)
- S1Q3T3 pattern - S wave in lead I, Q wave in lead III, T wave inversion in lead III
- RBBB (complete or incomplete) - from RV dilation and strain
- T wave inversion in V1-V4 - right precordial TWI = RV strain (higher mortality in PE)
- Right axis deviation
- P pulmonale - peaked P waves in II (>2.5 mm) = right atrial enlargement
- Atrial fibrillation or flutter (less common)
- Normal ECG in ~20% - normal ECG does not exclude PE
Prognostic note: More T wave inversions across precordial leads = higher PE burden and mortality.
9. Bundle Branch Blocks
Left Bundle Branch Block (LBBB)
Pathophysiology: Block in the left bundle branch - depolarization travels normally down the right bundle, then slowly spreads through myocardium left-to-right. Almost always pathological (HTN, CAD, cardiomyopathy).
ECG Changes:
- QRS >120 ms (broad)
- Broad notched R wave (M pattern) in lateral leads (I, aVL, V5-V6)
- Deep broad S wave (W pattern) in V1 - "WiLLiaM pattern"
- No septal Q waves in lateral leads
- Discordant ST-T changes (ST and T wave opposite to QRS direction)
- Secondary repolarization abnormalities make STEMI harder to diagnose (Sgarbossa criteria needed)
Right Bundle Branch Block (RBBB)
Pathophysiology: Block in the right bundle - right ventricle depolarizes last via slow myocardial conduction.
ECG Changes:
- QRS >120 ms
- RSR' (bunny ears) in V1-V2 - "MaRRoW pattern"
- Wide S wave in I, V5-V6
- Can be normal variant in younger patients with no structural disease
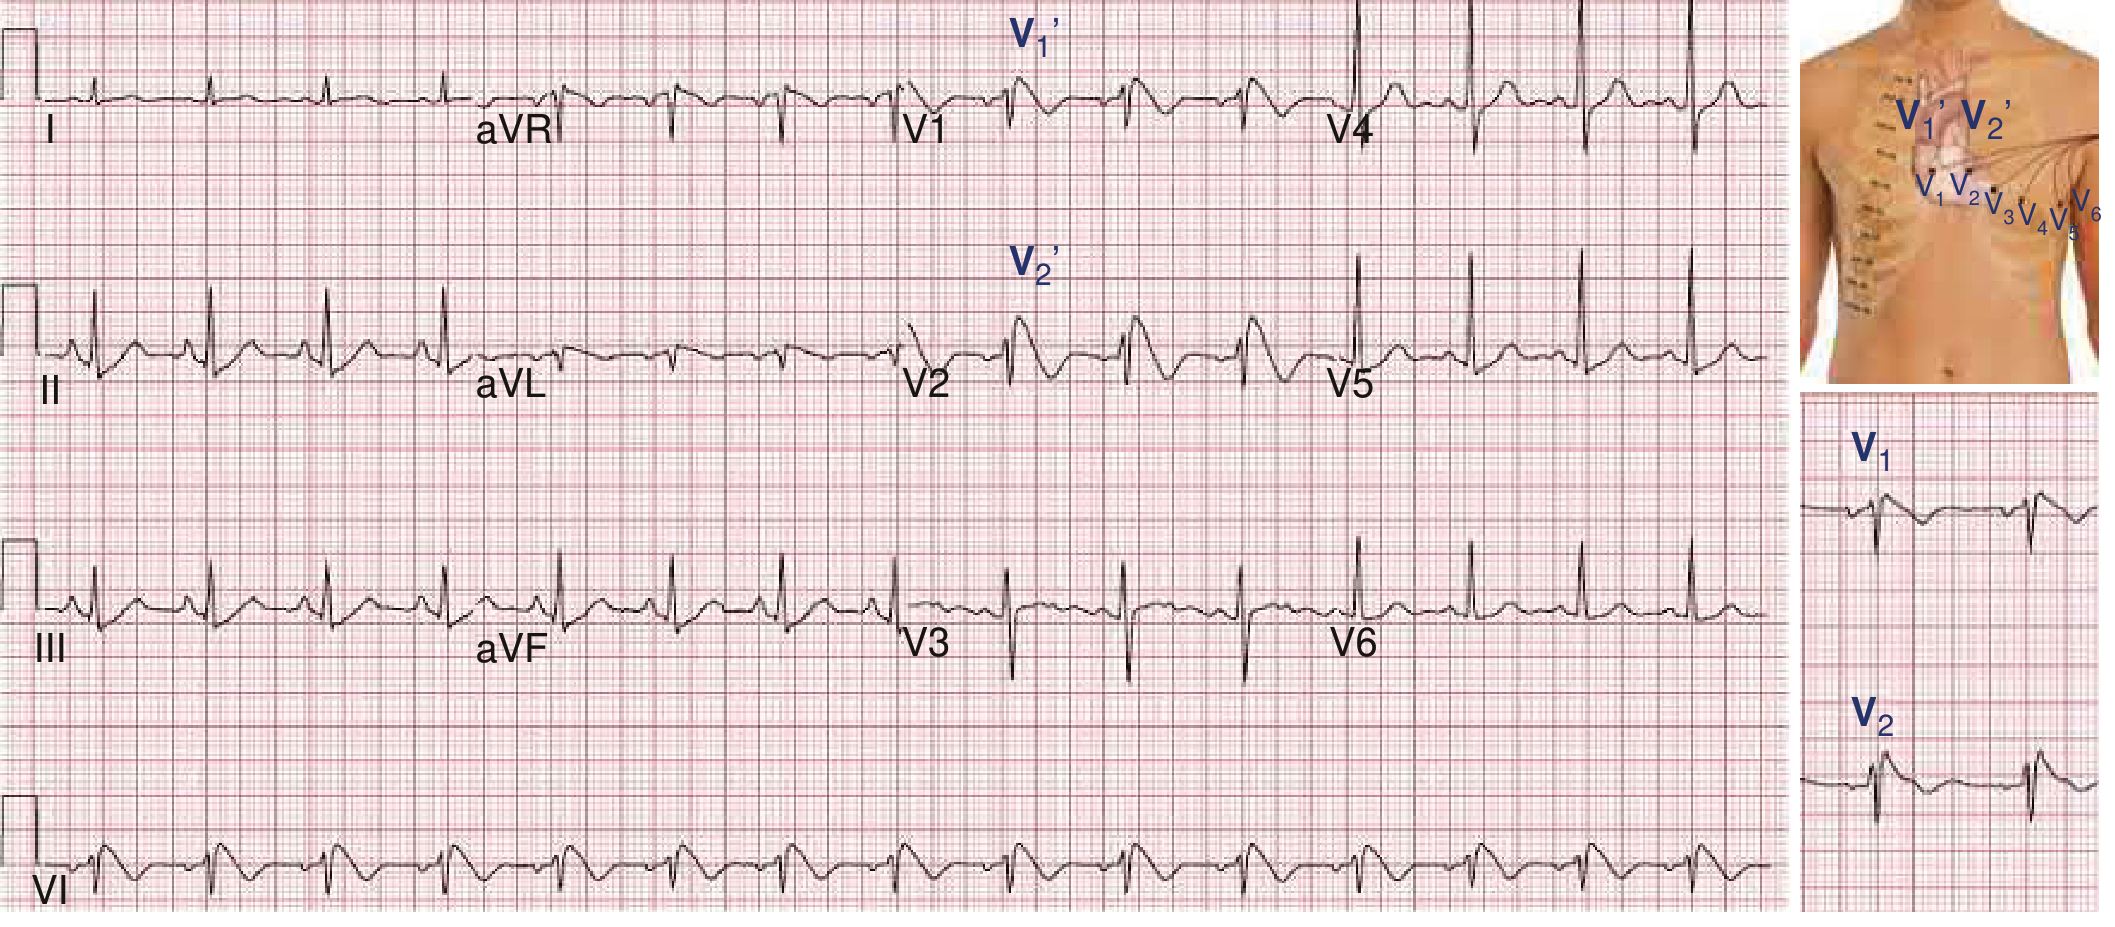
10. Brugada Syndrome
Pathophysiology: Sodium channelopathy (SCN5A gene mutation) affecting RV conduction. Causes risk of ventricular fibrillation and sudden cardiac death in structurally normal hearts. Can be spontaneous or unmasked by fever, sodium channel blockers, or cocaine.
ECG Changes (Type 1 - diagnostic):
- Coved ST elevation ≥2 mm in V1 (sometimes V2) followed by negative T wave - the "coved" or "fin-shaped" morphology
- Recorded with leads in standard position or placed in 2nd intercostal space (increases sensitivity)
- RBBB pattern in V1
Type 2 (saddle-back) and Type 3: Less specific, cannot diagnose Brugada alone.
From Braunwald's Heart Disease: Brugada syndrome shows "right precordial ST-segment abnormalities characteristic of Brugada syndrome" as a diagnostically important ECG signature. The figure below shows the characteristic Brugada pattern with V1/V2 in the 2nd intercostal space:
Quick Reference Summary Table
| # | Disease | Key ECG Finding | Rate | Rhythm |
|---|---|---|---|---|
| 1 | STEMI | ST elevation + Q waves | Variable | Sinus (or VT/VF) |
| 2 | NSTEMI/UA | ST depression, T inversion | Variable | Sinus |
| 3 | Atrial Fibrillation | No P waves, irregularly irregular | Variable | Irregular |
| 4 | Complete AV Block | P-QRS dissociation, slow escape | 20-40 | Regular (slow) |
| 5 | Ventricular Tachycardia | Wide QRS tachycardia | 100-250 | Regular |
| 6 | LVH | High voltage, strain pattern | Normal | Sinus |
| 7 | Acute Pericarditis | Diffuse concave ST elevation, PR depression | Normal-fast | Sinus |
| 8 | Pulmonary Embolism | S1Q3T3, RV strain, RBBB | Fast | Sinus tachycardia |
| 9 | LBBB/RBBB | Broad QRS, WiLLiaM/MaRRoW | Normal | Sinus |
| 10 | Brugada Syndrome | Coved ST elevation V1-V2 | Normal | Sinus (or VF) |
Sources: Braunwald's Heart Disease: A Textbook of Cardiovascular Medicine (10e), Fuster and Hurst's The Heart (15e), MESI Medical ECG Guide, ECG Guru clinical strips, Dr. Smith's ECG Blog.
Clinical Note: ECG interpretation must always be correlated with the clinical history, symptoms, and laboratory findings. A single ECG finding is rarely diagnostic in isolation.
This is a shared conversation. Sign in to Orris to start your own chat.