
Gout is purine metabolis
gout purine metabolism uric acid pathway monosodium urate crystals
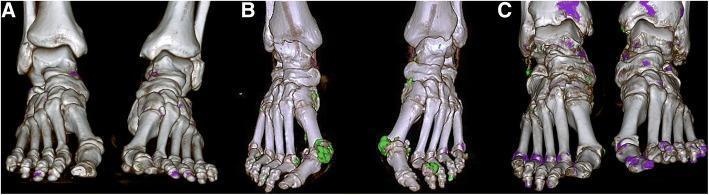
This diagnostic image set consists of three dual-energy computed tomography (DECT) reconstructions (labeled A, B, and C) of human feet, demonstrating monosodium urate (MSU) crystal deposition characteristic of gout. The 3D reconstructions use color-coding to highlight soft tissue uric acid deposits against the skeletal structure. Panel A illustrates a small deposit volume (0.17 cm³), with localized purple indicators near the phalanges and tarsal regions. Panel B shows a larger deposit load (5.29 cm³), with prominent green clusters primarily located at the first metatarsophalangeal (MTP) joints, representing significant tophi. Panel C displays a cutoff volume (0.81 cm³), showing intermediate distribution across the midfoot and toes. This image set is used in rheumatology to visualize tophaceous burden and assess the risk of clinical flares. The anatomical focus includes the tarsals, metatarsals, and phalanges, highlighting the predilection of MSU crystals for peripheral joints. These visualizations provide a non-invasive method for quantifying total urate burden that may not be apparent on standard radiography.
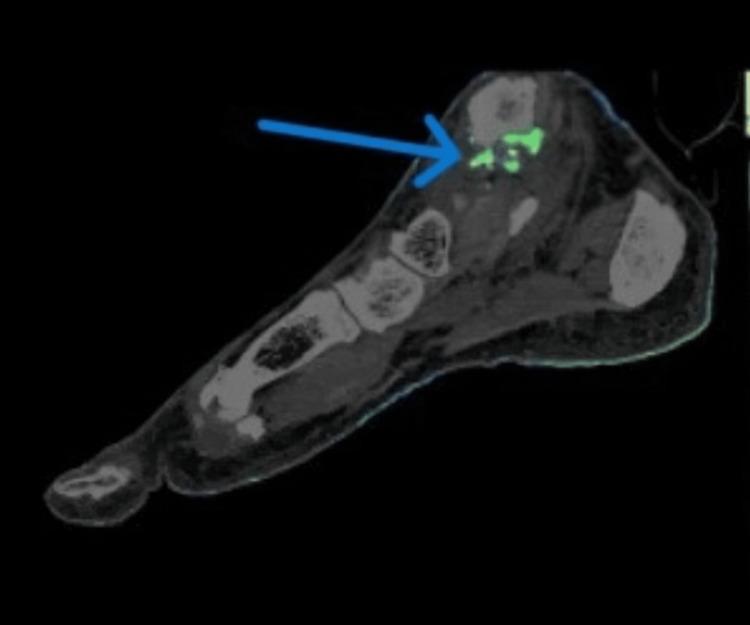
This diagnostic image is a sagittal reconstruction of a Dual-Energy Computed Tomography (DECT) scan of the right foot. The image serves as a specific modality for the non-invasive detection of gout by identifying monosodium urate (MSU) crystals. High-density anatomical structures, including the calcaneus, talus, and metatarsals, are visualized in traditional grayscale. Superimposed on the grayscale CT image are color-coded green voxels, which represent the presence and distribution of uric acid deposits. A prominent blue arrow indicates the primary site of deposition located at the superior aspect of the foot, specifically corresponding to the region of the deltoid and posterior talofibular ligaments near the ankle joint. This visualization demonstrates periarticular MSU crystal accumulation, a hallmark of chronic tophaceous gout, allowing for differentiation from other inflammatory arthropathies like rheumatoid arthritis. The educational focus is on the clinical utility of DECT in identifying specific chemical compositions in soft tissues and ligaments based on varied X-ray absorption properties.
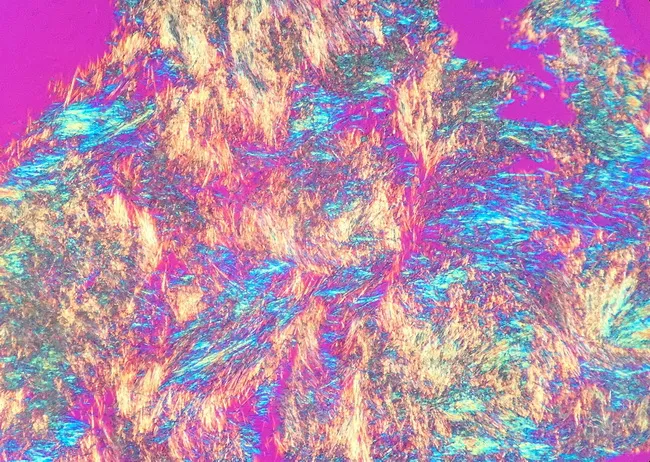
This image depicts polarized light microscopy of synovial fluid crystals from a suspected gout patient. The modality is Polarized Light Microscopy (PLM) with a first-order red compensator, producing characteristic birefringent colors. The focal specimens reveal numerous needle-shaped monosodium urate (MSU) crystals dispersed within the liquid medium, visible intracellularly and extracellularly. Under cross-polarized illumination, these MSU crystals exhibit negative birefringence: when aligned parallel to the slow red axis, they appear bright yellow, and when oriented perpendicular, they appear blue. The crystals are slender, needle-like, and variable in length, consistent with classic gout findings. The specimen type is synovial fluid obtained via arthrocentesis, and the image emphasizes the diagnostic hallmark of gout: MSU crystals in joints or tophi. Serum uric acid levels are unreliable and may be normal during an acute attack; thus, definitive diagnosis relies on crystal demonstration in joint fluid or tophus aspirates. The presence of MSU crystals supports crystal-induced inflammatory arthritis and guides therapy, including NSAIDs, colchicine, corticosteroids, and urate-lowering agents, while the clinician must still exclude septic arthritis. This image is valuable for education, microbiology and rheumatology training, and differential diagnosis exercises, illustrating crystal morphology and birefringence properties essential for accurate identification and teaching.
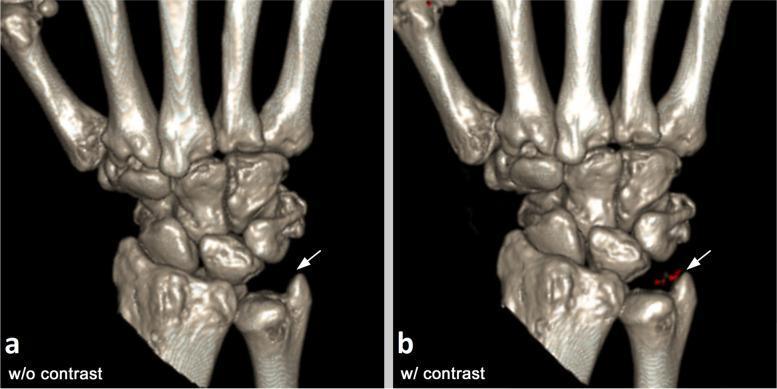
This diagnostic image shows side-by-side three-dimensional (3D) volume-rendered reconstructions from dual-energy computed tomography (DECT) scans of a human hand and wrist. The comparison illustrates the detection of monosodium urate (MSU) crystals, which are characteristic of gout. Panel (a), labeled 'w/o contrast', shows the anatomical structure of the carpal bones and distal radius and ulna before intravenous iodinated contrast administration; at the ulnocarpal joint (indicated by a white arrow), no specific pathology is highlighted. Panel (b), labeled 'w/ contrast', demonstrates the same anatomical region after the administration of iodinated contrast medium. In this enhanced scan, small red-colored voxels (arrow) appear in the ulnocarpal joint space, representing the successful DECT identification of MSU deposits or tophi. The image demonstrates a clinical scenario where intravenous contrast can influence the visualization and material decomposition algorithm's ability to identify uric acid crystals in a patient with gout. The educational focus is on the diagnostic imaging of rheumatological conditions using advanced CT modalities.
Gout - A Disorder of Purine Metabolism
1. Purines and Their Metabolism
- De novo synthesis: Purine rings are assembled from non-purine precursors in 10 enzymatic steps, starting with ribose-5-phosphate, which is converted to 5-phosphoribosyl-1-pyrophosphate (PRPP) - the key rate-limiting substrate. The end product of this pathway is inosine monophosphate (IMP), a branch point for forming adenylate or guanylate nucleotides, or entering the degradation pathway.
- Salvage pathway: Free purine bases (hypoxanthine, guanine) are recycled back into nucleotides via hypoxanthine-guanine phosphoribosyltransferase (HGPRT/HPRT) + PRPP. This conserves energy and provides metabolic flexibility.
- Guanine is deaminated to xanthine
- Hypoxanthine is oxidized to xanthine by xanthine oxidoreductase (XOR)
- Xanthine is further oxidized to urate (uric acid) - again by XOR
2. Hyperuricemia - The Prerequisite for Gout
| Mechanism | Examples |
|---|---|
| Overproduction of uric acid | High purine diet (red meat, shellfish, beer), HGPRT deficiency, PRPP synthetase superactivity, tumor lysis syndrome |
| Underexcretion by kidney | Most cases of primary gout (~90%), chronic kidney disease, thiazide diuretics, cyclosporin |
| Both | Lesch-Nyhan syndrome, glucose-6-phosphatase deficiency |
3. Key Enzyme Defects in Primary Gout
HGPRT Deficiency (Lesch-Nyhan Syndrome)
- HGPRT catalyzes the salvage of hypoxanthine → IMP and guanine → GMP
- Deficiency means hypoxanthine and guanine cannot be recycled; they are instead degraded to urate
- Also causes PRPP to accumulate, driving excessive de novo purine synthesis
- Complete deficiency = Lesch-Nyhan syndrome (hyperuricemia + severe neurological manifestations: self-mutilation, choreoathetosis, intellectual disability)
- Partial deficiency = hyperuricemia with gout but milder/no neurological features
PRPP Synthetase Superactivity
- PRPP synthetase (encoded by PRPS1) converts ribose-5-phosphate → PRPP
- Gain-of-function variants accelerate PRPP production → overproduction of purines → overproduction of urate
- X-linked inheritance
4. Pathogenesis of Gouty Arthritis
- Crystal deposition - favored by cooler peripheral joints (first MTP joint - podagra), low pH, and low protein binding
- Inflammasome activation - resident synovial macrophages phagocytose MSU crystals, activating the NLRP3 inflammasome
- IL-1β production - caspase-1 (activated by inflammasome) cleaves pro-IL-1β to active IL-1β
- Neutrophil recruitment - IL-1β drives massive neutrophil influx into the joint
- Amplification - neutrophils release cytokines, free radicals, and proteases; engulfed crystals rupture phagolysosomes, releasing lysosomal enzymes
- Self-limited acute attack - typically peaks in 1-2 days, resolves within a week
5. Clinical Stages of Gout
| Stage | Features |
|---|---|
| Asymptomatic hyperuricemia | Elevated urate, no symptoms; may persist 20-30 years before gout appears |
| Acute gouty arthritis | Sudden, exquisitely painful monoarthritis (often first MTP = podagra); self-limited |
| Intercritical gout | Asymptomatic intervals between attacks |
| Chronic tophaceous gout | Persistent tophi, polyarticular involvement, joint destruction |
6. Diagnosis
- Gold standard: Joint aspiration (arthrocentesis) showing needle-shaped MSU crystals that are negatively birefringent under polarized light (yellow when parallel to compensator axis, blue when perpendicular)
- Serum uric acid is unreliable - can be normal during an acute attack
- Imaging: X-ray (punched-out erosions with overhanging edges in chronic gout); Dual-energy CT (DECT) can directly visualize MSU deposits
7. Treatment - Pharmacological Basis from Purine Pathway
| Drug | Mechanism | Use |
|---|---|---|
| Colchicine | Inhibits neutrophil microtubule polymerization; blocks IL-1β processing | Acute attacks, prophylaxis |
| NSAIDs (indomethacin, naproxen) | COX inhibition → reduced prostaglandins | Acute attacks |
| Corticosteroids | Broad anti-inflammatory | Acute attacks when NSAIDs/colchicine contraindicated |
| Allopurinol | XOR inhibitor (xanthine oxidase inhibitor) - blocks conversion of hypoxanthine/xanthine → urate | Urate-lowering therapy (ULT) |
| Febuxostat | Selective XOR inhibitor | ULT (alternative to allopurinol) |
| Probenecid | Uricosuric - blocks tubular reabsorption of urate | ULT in underexcretors |
| Pegloticase | Recombinant uricase - converts urate to soluble allantoin | Refractory tophaceous gout |
Summary Diagram (Pathway)
Dietary purines + De novo synthesis
          ↓
    Purine nucleotides (AMP, GMP, IMP)
          ↓  (catabolism)
    Adenosine → Inosine → Hypoxanthine
    GMP → Guanosine → Guanine → Xanthine
                                    ↑
              Hypoxanthine → Xanthine  (via XOR)
                                    ↓  (via XOR)
                                  URATE
                                    ↓  (if supersaturated)
                         MSU crystal deposition in joints
                                    ↓
                         GOUTY ARTHRITIS (inflammasome → IL-1β)
Difference between purine and protein
purine pyrimidine ring structure nucleotide bases diagram
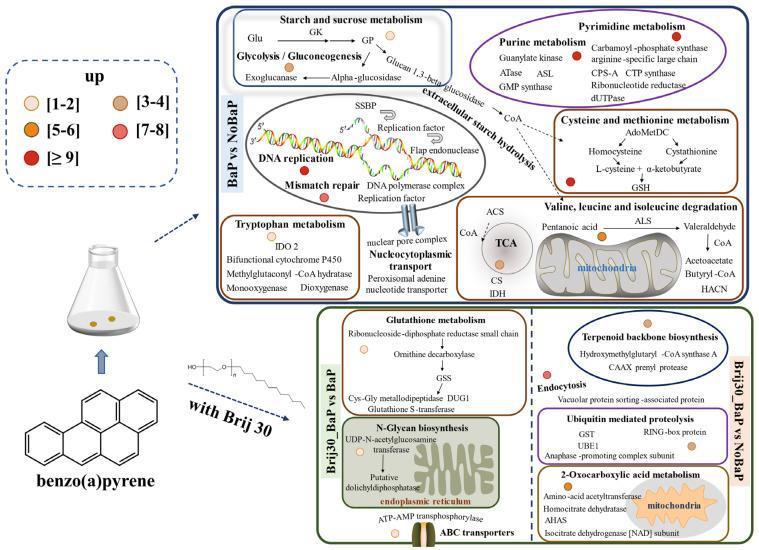
This pathophysiology diagram illustrates the complex metabolic pathways and differential gene expressions of the white-rot fungus P. acerina involved in the degradation of benzo(a)pyrene (BaP), both with and without the surfactant Brij 30. The diagram is organized into three comparative sections: BaP vs NoBaP, Brij30_BaP vs BaP, and Brij30_BaP vs NoBaP. Colored circles indicate the number of upregulated differentially expressed genes (DEGs) across various metabolic processes. Key pathways shown include carbohydrate metabolism (Starch/Sucrose, Glycolysis), Nucleotide metabolism (Purine/Pyrimidine), DNA replication, and the TCA cycle occurring within the mitochondria. Tryptophan, Cysteine, and Methionine metabolisms are also highlighted. The Brij 30 intervention specifically shows upregulation in Glutathione metabolism, N-Glycan biosynthesis in the endoplasmic reticulum, and 2-Oxocarboxylic acid metabolism. This visualization serves to map the biological mechanisms and enzymatic processes—such as cytochrome P450 activity and ABC transporters—utilized by fungi to detoxify and mineralize polycyclic aromatic hydrocarbons, which has significant implications for environmental medicine and bioremediation studies.
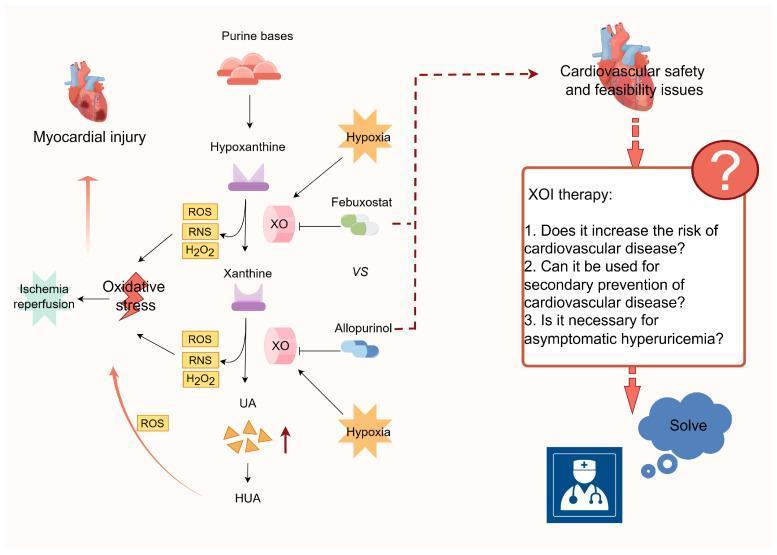
This pathophysiology diagram illustrates the metabolic pathway of purine degradation and its implications for cardiovascular health. The central pathway shows the sequential conversion of purine bases to hypoxanthine, then to xanthine, and finally to uric acid (UA) by the enzyme xanthine oxidase (XO). Excessive UA production leads to hyperuricemia (HUA). The diagram highlights that the XO-catalyzed steps concurrently generate reactive oxygen species (ROS), reactive nitrogen species (RNS), and hydrogen peroxide (H2O2), contributing to oxidative stress and subsequent myocardial injury, particularly during ischemia-reperfusion events. Hypoxia is shown to stimulate XO activity and UA levels. On the right, the clinical relevance is depicted through the use of xanthine oxidase inhibitors (XOIs), specifically Febuxostat and Allopurinol. The diagram raises critical clinical questions regarding XOI therapy, including its potential cardiovascular risks, its utility in secondary cardiovascular prevention, and its necessity in treating asymptomatic hyperuricemia. This flowchart integrates biochemistry with clinical cardiology to explore the therapeutic balance and safety profile of urate-lowering therapies in cardiovascular disease management.
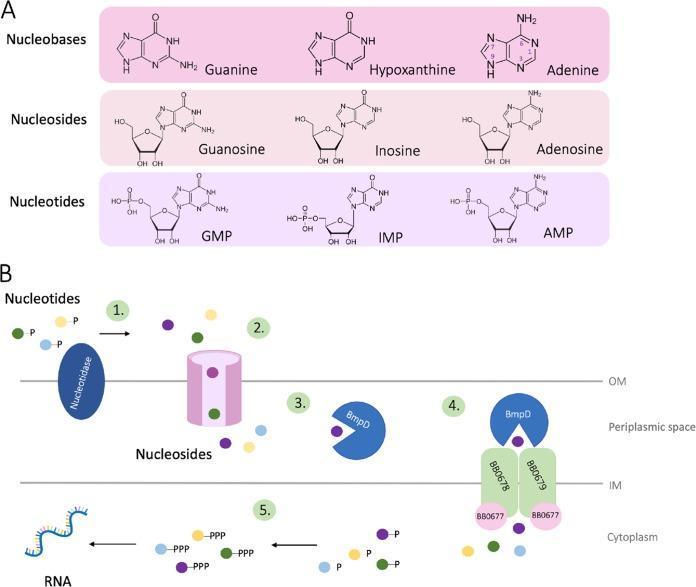
This educational medical illustration is divided into two panels focused on purine biochemistry and microbial physiology. Panel A is a comparison chart of 2D chemical structures, illustrating the progression from nucleobases (Guanine, Hypoxanthine, Adenine) to nucleosides (Guanosine, Inosine, Adenosine) through the addition of a ribose sugar, and finally to nucleoside monophosphate nucleotides (GMP, IMP, AMP) with the addition of a phosphate group. Standard purine atom-numbering is highlighted on the adenine structure. Panel B is a pathophysiology diagram showing the purine salvage pathway in Borrelia burgdorferi across cell membranes. It depicts five numbered steps: 1) extracellular nucleotidase converting nucleotides to nucleosides; 2) transport through the outer membrane (OM); 3) binding by substrate-binding proteins (SBP) like BmpD in the periplasmic space; 4) transport via the BB0677-BB0679 ABC transporter across the inner membrane (IM); and 5) cytoplasmic re-phosphorylation of nucleosides into monophosphates and subsequently triphosphates (ATP/GTP) for RNA incorporation. The diagram highlights the clinical significance of nutrient acquisition mechanisms in pathogenic spirochetes.
Purines vs. Proteins - Key Differences
1. Basic Definition
| Feature | Purine | Protein |
|---|---|---|
| What it is | A small nitrogenous heterocyclic organic molecule | A large macromolecule (polymer) made of amino acids |
| Building blocks | Not a polymer - single ring compound | Built from 20 standard amino acids linked by peptide bonds |
| Category | Nucleobase (part of nucleotides/nucleic acids) | Macromolecule / biopolymer |
2. Chemical Structure
Purine
- A bicyclic ring - a fused pyrimidine ring + imidazole ring forming a 9-atom (6+5) double-ring system
- Contains carbon and nitrogen atoms within the ring
- The two main purines in the human body are:
- Adenine (A) - found in DNA, RNA, ATP, NAD+
- Guanine (G) - found in DNA, RNA, GTP
- Small molecule (molecular weight ~135-150 Da)
- Highly soluble in water; its breakdown product, uric acid, is poorly soluble
Protein
- A polypeptide chain (or multiple chains) of amino acids
- Each amino acid has: a central carbon (α-carbon), an amino group (-NH₂), a carboxyl group (-COOH), a hydrogen, and a variable side chain (R group)
- Amino acids are linked by peptide bonds (covalent bonds between -COOH of one and -NH₂ of the next)
- Has 4 levels of structure:
- Primary - amino acid sequence
- Secondary - α-helices, β-sheets (hydrogen bonds)
- Tertiary - 3D folding (hydrophobic interactions, disulfide bonds, salt bridges)
- Quaternary - multiple polypeptide subunits
- Large molecules (MW ranges from thousands to millions of Daltons)
3. Composition - What Atoms Are Present
| Element | Purine | Protein |
|---|---|---|
| Carbon (C) | Yes | Yes |
| Hydrogen (H) | Yes | Yes |
| Nitrogen (N) | Yes - in the ring itself | Yes - in amino/peptide groups |
| Oxygen (O) | Minimal (not in ring) | Yes - in peptide bonds, side chains |
| Sulfur (S) | No | Yes - in cysteine, methionine |
| Phosphorus (P) | Only when part of a nucleotide | No (except in phosphoproteins) |
4. Biological Roles
| Role | Purines | Proteins |
|---|---|---|
| Genetic material | Core bases of DNA and RNA (A, G) | Histones help package DNA, but not the code itself |
| Energy currency | ATP (adenosine triphosphate) is the universal energy carrier | No direct role |
| Signaling | cAMP, cGMP are second messengers | Receptors, kinases, G-proteins |
| Enzyme activity | Part of coenzymes (NAD+, FAD, CoA) | Enzymes are proteins |
| Structural | None | Collagen, keratin, actin, tubulin |
| Transport | No | Hemoglobin (O₂), albumin, lipoproteins |
| Immunity | No | Antibodies (immunoglobulins) are proteins |
| Hormones | No | Insulin, growth hormone, glucagon |
5. Digestion and Metabolism
Purine Metabolism
- Dietary purines are absorbed but mostly metabolized by intestinal epithelial cells (Basic Medical Biochemistry, 6e)
- Purines are catabolized to hypoxanthine → xanthine → uric acid via xanthine oxidase
- Uric acid is the final end product in humans (excreted in urine)
- Excess uric acid → deposits as monosodium urate crystals → Gout
Protein Metabolism
- Dietary proteins are digested by proteases (pepsin in stomach, trypsin/chymotrypsin in small intestine) into individual amino acids
- Amino acids are absorbed and used for:
- Synthesizing new proteins
- Energy (via deamination → TCA cycle / gluconeogenesis)
- Making non-protein nitrogenous compounds (heme, neurotransmitters, creatine)
- The nitrogen from amino acids is converted to urea (via urea cycle) and excreted
6. Connection to Gout - Where People Get Confused
- Protein itself does NOT directly raise uric acid. Protein is broken down into amino acids → urea cycle → urea (not uric acid)
- Purines (found within the nucleic acids of cells in protein-rich foods) are what get converted to uric acid
- So: eating red meat raises uric acid because meat cells contain nucleic acids (with purines), not because of the protein content directly
- Interestingly, dairy protein (casein, whey) is high in protein but low in purines and actually lowers uric acid - so not all protein sources raise uric acid
7. Quick Summary Table
| Property | Purine | Protein |
|---|---|---|
| Type | Small heterocyclic molecule | Large polypeptide macromolecule |
| Monomers | Not applicable | Amino acids (20 types) |
| Rings | Bicyclic (pyrimidine + imidazole) | No ring backbone |
| End product of metabolism | Uric acid | Urea (+ CO₂ + water) |
| Disease when excess | Gout, kidney stones | Protein-energy malnutrition, amyloidosis |
| Found in | DNA, RNA, ATP, coenzymes | All tissues, enzymes, antibodies, hormones |
| Molecular weight | ~135-150 Da | Thousands to millions of Da |
| Dietary sources (rich) | Organ meats, shellfish, beer, anchovies | Meat, eggs, dairy, legumes, nuts |