
How to find association of a risk factor in medical research
The association between a risk factor and an outcome in medical research is measured using several study designs and statistical tools. Here's a quick overview:
- Cohort studies: compare incidence of disease in exposed vs. unexposed groups - calculate Relative Risk (RR)
- Case-control studies: compare exposure history in cases vs. controls - calculate Odds Ratio (OR)
- Cross-sectional studies: measure exposure and outcome simultaneously - calculate Prevalence Ratio
- Key statistics: RR, OR, Hazard Ratio (HR), confidence intervals, p-values, and attributable risk
Searching sources...
Let me pull detailed information from the medical library and current literature simultaneously.
Reading File
Searching the Web
measuring association risk factor outcome medical research epidemiology methods
Now let me search the medical library for epidemiology and measures of association:
Finding Sources
Finding Sources
Finding Sources
Finding Sources
The Berek & Novak's Gynecology result looks like it has a dedicated section on Odds Ratio and study design. Let me read it:
Reading File
Reading File
Reading File
Reading File
Reading File
Reading File
Reading File
I now have comprehensive information from the textbook. Let me also fetch the key 2x2 table diagram:
Loading Image
Now I have everything needed for a thorough, well-structured answer. Here it is:
Finding the Association of a Risk Factor in Medical Research
Association between a risk factor (exposure) and a disease (outcome) is measured using a combination of study design, statistical measures, and causal reasoning. Here is the full framework:
1. The 2x2 Contingency Table - The Foundation
All association measures come from this fundamental table:
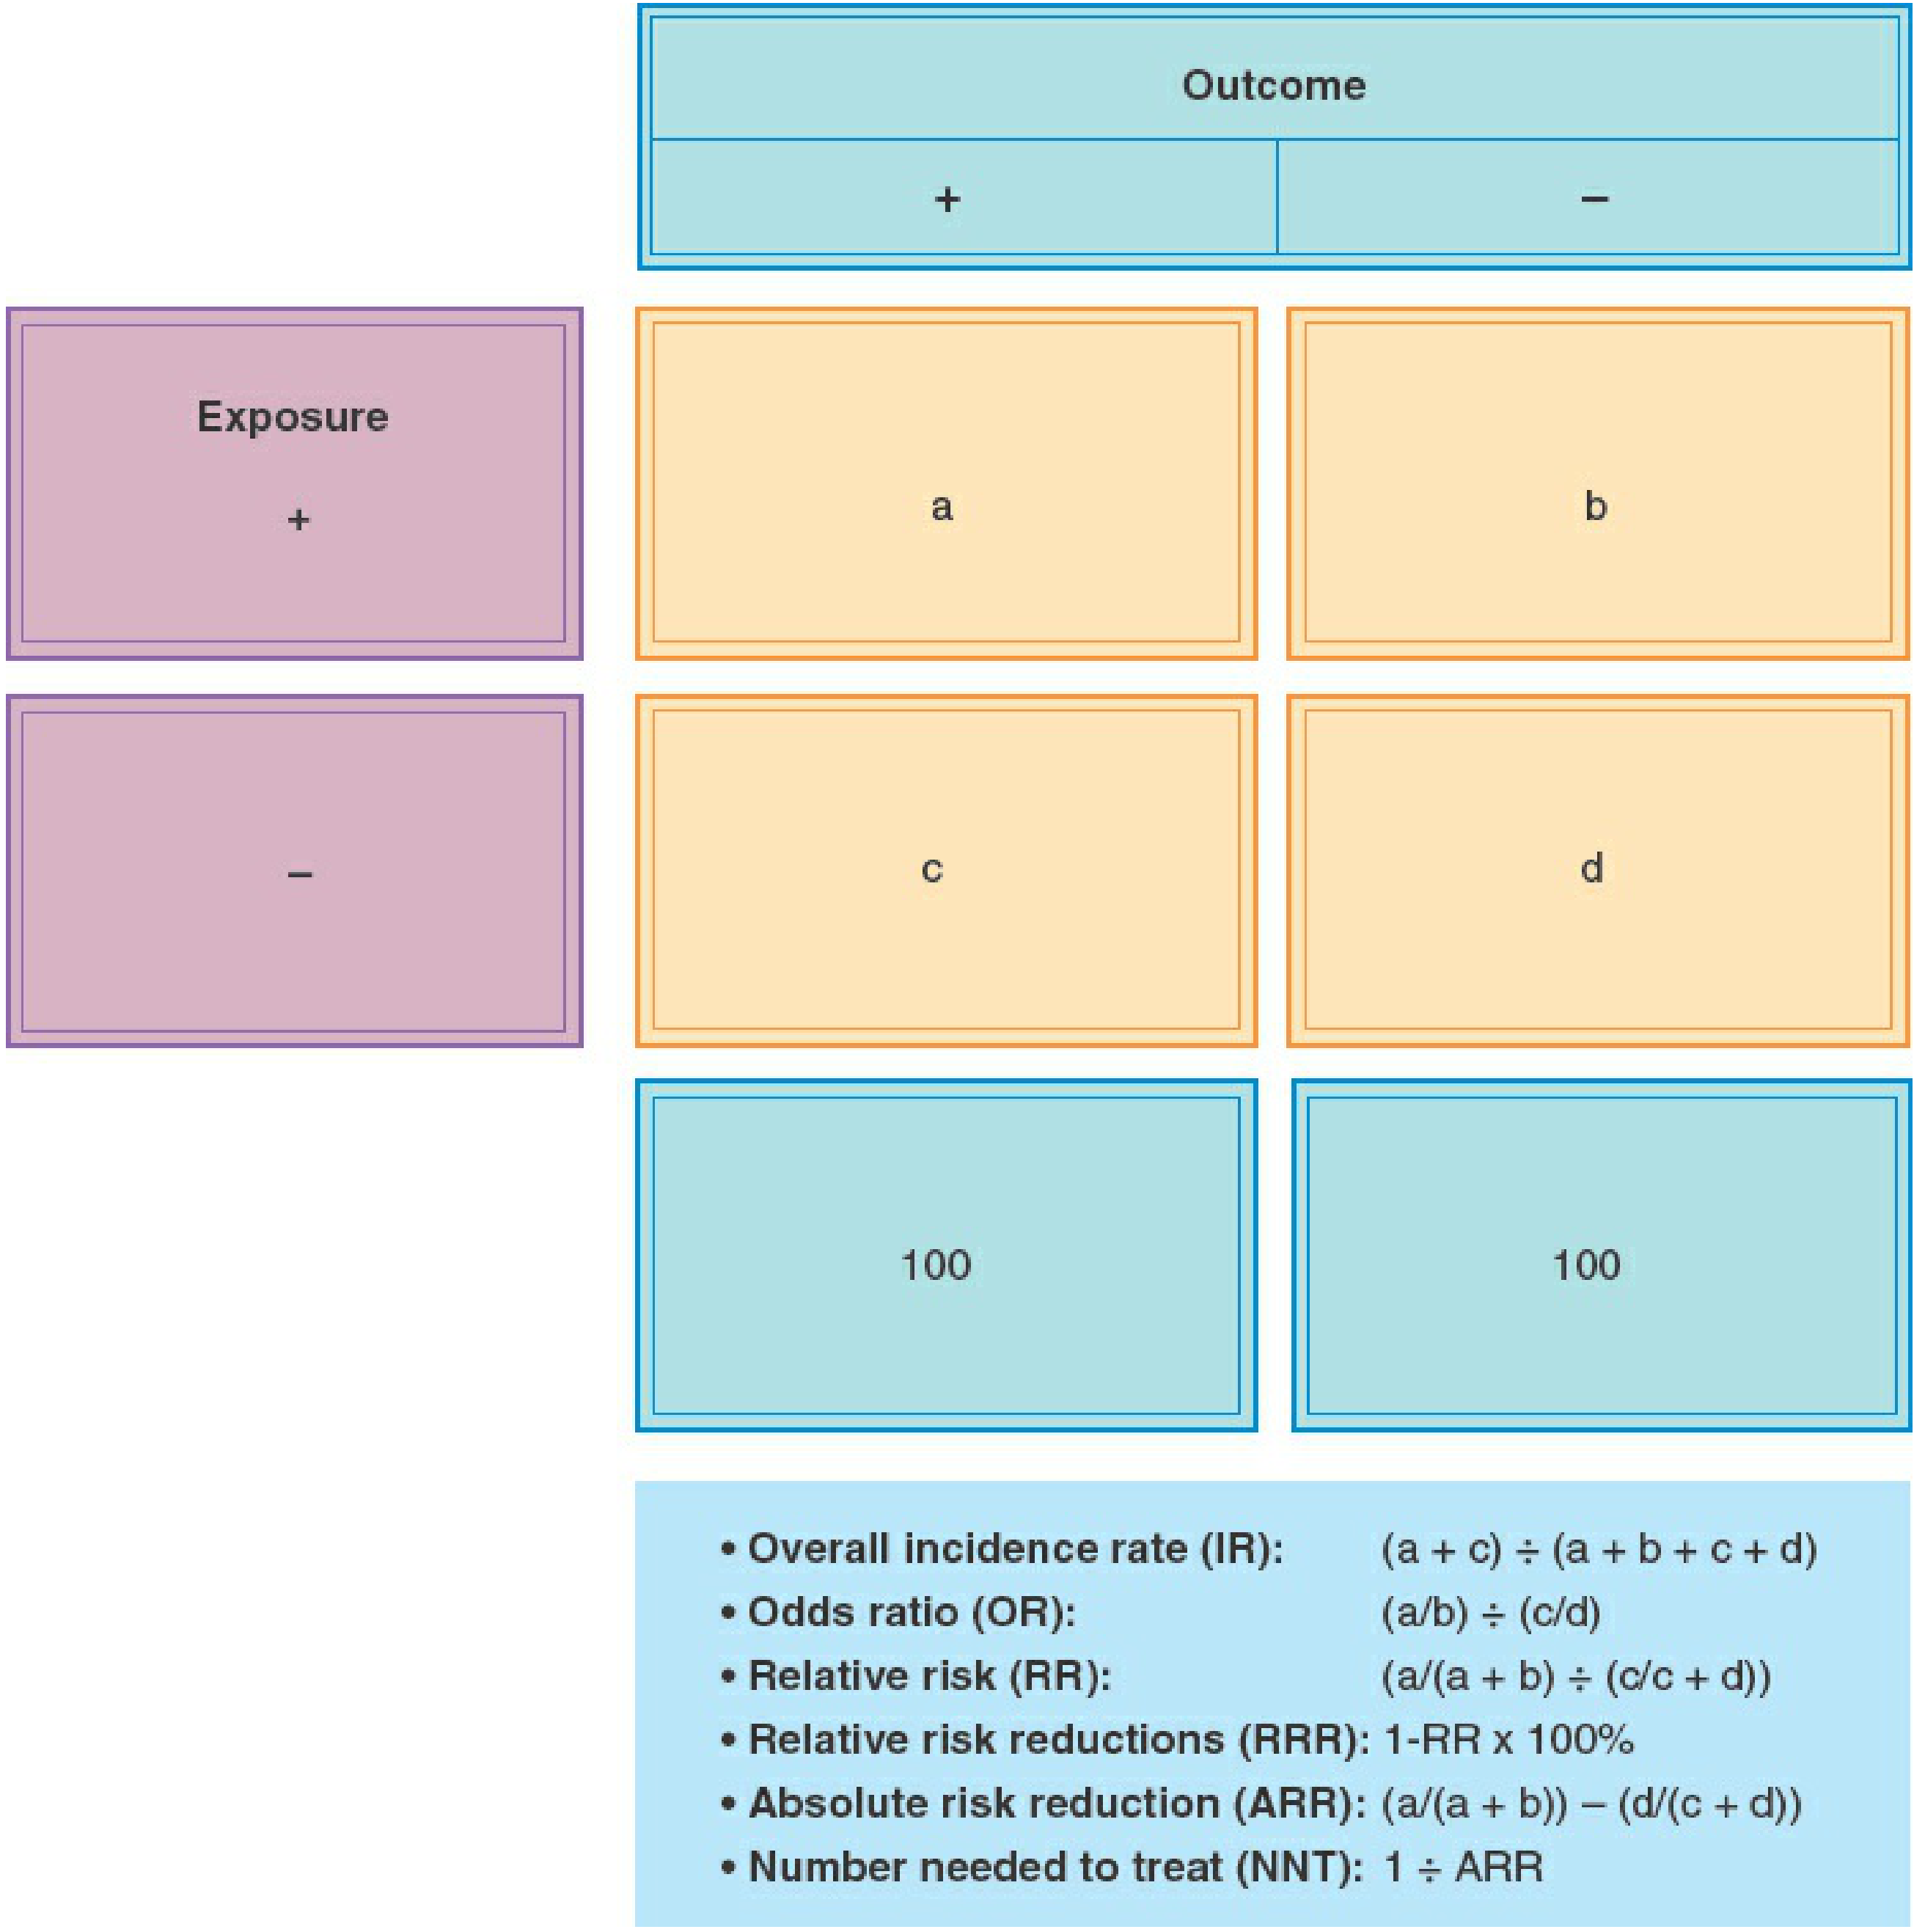
| Outcome + | Outcome - | |
|---|---|---|
| Exposure + | a | b |
| Exposure - | c | d |
- a = exposed WITH disease
- b = exposed WITHOUT disease
- c = unexposed WITH disease
- d = unexposed WITHOUT disease
2. Choosing the Right Study Design
The study design determines which measures of association you can calculate:
| Study Type | How It Works | Best For | Association Measure |
|---|---|---|---|
| Cohort | Identify exposed/unexposed, follow forward for outcome | Common outcomes, temporal relationship | Relative Risk (RR) |
| Case-Control | Identify cases/controls, look back at exposure | Rare diseases | Odds Ratio (OR) |
| Cross-Sectional | Measure exposure + outcome at same time | Prevalence, descriptive data | Prevalence Ratio |
| RCT | Randomly assign exposure/intervention | Causal inference | RR, ARR, NNT |
"Observational studies, including cohort, case-control, and cross-sectional studies, are analytic studies that take advantage of 'natural experiments' in which exposure is not assigned by the investigator." - Berek & Novak's Gynecology, p. 120
3. Key Measures of Association
Relative Risk (RR)
- Formula:
a/(a+b) ÷ c/(c+d) - Used in: Cohort studies and RCTs (where total population is known)
- Interpretation:
- RR = 1: no association
- RR > 1: exposure increases risk
- RR < 1: exposure is protective
- Example: RR = 1.6 means exposed individuals are 1.6 times as likely to develop the disease
Odds Ratio (OR)
- Formula:
(a/b) ÷ (c/d)=ad/bc - Used in: Case-control studies primarily
- Note: OR approximates RR when the outcome is rare (rare disease assumption)
- OR > 1 = greater odds of disease in exposed group; OR < 1 = lower odds
Attributable Risk (AR) - also called Risk Difference
- Formula:
a/(a+b) - c/(c+d) - Answers: "How much greater is the absolute risk in the exposed group?"
- "Attributable risk is not directly obtainable in a case-control study." - Berek & Novak's Gynecology, p. 125
Attributable Risk Percent (ARP)
- Formula:
AR / Risk in exposed group - Answers: "What percentage of disease in exposed individuals is attributable to the exposure?"
Absolute Risk Reduction (ARR)
- Formula: Risk in control group - Risk in intervention group
- Used when the exposure is protective/therapeutic
Number Needed to Harm (NNH) / Number Needed to Treat (NNT)
- Formula:
1 / ARR - NNT: how many need treatment to prevent one outcome
- NNH: how many exposures before one extra case of harm
4. Statistical Significance
Once an association measure is calculated, you need to determine if it is statistically real or could be due to chance:
p-value
- Probability the observed result occurred by chance alone under the null hypothesis
- Conventional threshold: p < 0.05 (5% chance the association is spurious)
- For genome-wide association studies (GWAS), this is set much lower (p < 10^-7) because hundreds of thousands of variants are tested
Confidence Intervals (CI)
- A 95% CI means: if the study were repeated many times, 95% of the calculated CIs would contain the true population value
- For OR or RR: if the 95% CI includes 1.0, the association is not statistically significant
- Narrow CI = more precision; wide CI = less precision (often from small sample size)
5. Controlling for Bias and Confounding
Association does not equal causation. You must account for:
Bias Types
- Selection bias: systematic error in who is included (e.g., controls are not representative)
- Information/misclassification bias: incorrect classification of exposure or disease
- Recall bias: cases remember past exposures better than controls - especially a problem in case-control studies
Confounding
A confounder is a variable associated with both the exposure AND the outcome. It can create a false association or mask a real one.
How to control confounding:
- Randomization (RCTs) - distributes confounders equally
- Restriction - limit study to one level of the confounder
- Matching - pair cases and controls on confounder variables
- Stratification - analyze within subgroups
- Multivariable analysis - statistically adjust for multiple confounders simultaneously, producing an adjusted OR or RR
"Multivariable analysis is a statistical technique commonly used in epidemiologic studies that simultaneously controls a number of confounding variables." - Berek & Novak's Gynecology, p. 130
6. From Association to Causation - Bradford Hill Criteria
Finding a statistical association is not enough to conclude causation. Bradford Hill's criteria help judge causality:
| Criterion | What It Means |
|---|---|
| Strength | The further RR/OR from 1.0, the more likely it's real |
| Temporality | Exposure must precede disease (most critical criterion) |
| Dose-response | Higher exposure = higher risk (biologic gradient) |
| Consistency | Association replicated by different investigators/settings |
| Plausibility | A biologic mechanism can explain the association |
| Coherence | Compatible with known biology of the disease |
| Experiment | Disease reduced when exposure is removed |
7. Worked Example (Smoking and Low Birth Weight)
| Low Birth Weight | Normal Birth Weight | |
|---|---|---|
| Smokers | 40 | 311 |
| Non-smokers | 331 | 4318 |
- Risk in smokers: 40/351 = 11.4%
- Risk in non-smokers: 331/4649 = 7.1%
- RR = 0.114/0.071 = 1.6 (smokers 1.6x more likely to have low-birth-weight baby)
- OR = (40 × 4318)/(331 × 311) = 1.68
- Attributable Risk = 0.114 - 0.071 = 0.043 (4.3 extra cases per 100 smokers)
- ARP = 0.043/0.114 = 38% of low birth weight in smokers is attributable to smoking
Summary: Which Measure to Use When
| Situation | Use |
|---|---|
| Cohort or RCT | Relative Risk (RR), Attributable Risk |
| Case-control | Odds Ratio (OR) |
| Therapeutic intervention | ARR, NNT, RRR |
| Harmful exposure | NNH, Attributable Risk % |
| Rare disease in any design | OR approximates RR |
| Multiple confounders | Adjusted OR/RR from multivariable regression |
The gold standard for establishing causation remains the randomized controlled trial, but observational studies with strong methodology, large sample sizes, and careful confounding control can provide compelling evidence of association. - Berek & Novak's Gynecology, p. 117-131
This is a shared conversation. Sign in to Orris to start your own chat.