
mixed frequency sound
mixed frequency sound acoustics physics explanation
Mixed Frequency Sound
How It Works
- 200 Hz sine wave + 600 Hz sine wave + 1200 Hz sine wave = one complex mixed-frequency sound wave
Key Concepts
| Term | Meaning |
|---|---|
| Fundamental frequency | The lowest frequency in a complex sound; determines the perceived pitch |
| Harmonics / Overtones | Integer multiples of the fundamental (2f, 3f, 4f...) |
| Timbre | The quality/character of a sound determined by the mix of frequencies present |
| Spectrum | A plot of all frequencies and their amplitudes present in a sound |
| Fourier analysis | The mathematical technique used to decompose any complex sound into its individual frequency components |
Types of Mixed Frequency Sound
-
Harmonic (periodic) sounds - Frequencies are integer multiples of a fundamental (e.g., musical notes from instruments). These sound musical and have a defined pitch.
-
Inharmonic sounds - Frequencies are NOT integer multiples (e.g., bells, gongs, drums). These can sound "clangorous" or less tonal.
-
Noise - Random mix of many frequencies:
- White noise - Equal energy at all frequencies
- Pink noise - Equal energy per octave (more bass-heavy than white noise)
- Brown noise - Even more low-frequency energy
Real-World Examples
- Human voice - Contains a fundamental + many harmonics shaped by the vocal tract
- Musical instruments - Each instrument produces a unique mix of harmonics (which is why a violin and a flute sound different on the same note)
- Environmental sounds - Traffic, wind, crowds - all broadband mixed-frequency noise
- Engine noise - Mix of mechanical vibration frequencies, often periodic
Fourier Analysis
Hearing Mixed Frequencies
ejection systolic murmur
ejection systolic murmur aortic stenosis heart sound diagram
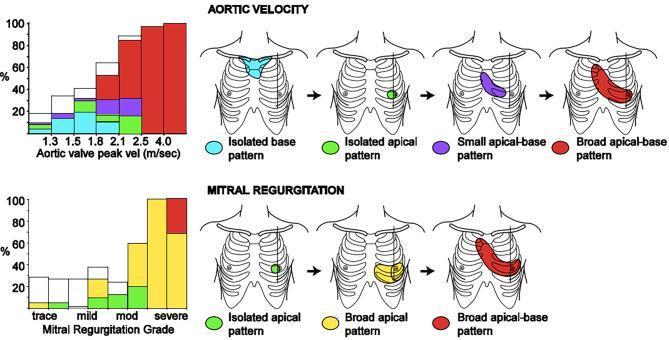
This medical comparison chart and diagram illustrate the distribution patterns of systolic murmurs in isolated Aortic Stenosis (AS) and Mitral Regurgitation (MR) based on disease severity. The upper section focuses on Aortic Velocity (n=247), showing a progression of murmur localization as peak velocity increases from 1.3 to 4.0 m/sec. Visualized patterns include isolated base (cyan), isolated apical (green), small apical-base (purple), and broad apical-base (red). As AS severity increases, the murmur evolves from localized base or apex patterns to a broad apical-base distribution. The lower section depicts Mitral Regurgitation patterns (n=174) graded from trace to severe. Murmur patterns are categorized as isolated apical (green), broad apical (yellow), and broad apical-base (red). The bar graphs quantify the percentage of patients exhibiting each pattern at different severity levels, highlighting that severe cases of both AS and MR are characterized by broader, more extensive apical-base murmur distributions on the chest wall.
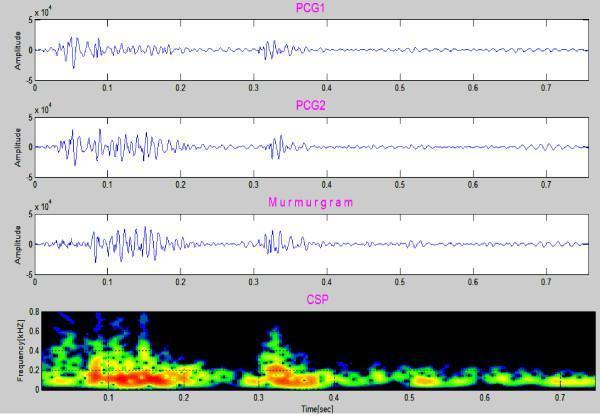
This diagnostic image displays a four-panel comparative analysis of cardiac acoustics in an 8-year-old patient with aortic stenosis. The top two panels, PCG1 and PCG2, show consecutive phonocardiogram waveforms plotted as amplitude over a 0.7-second interval. The third panel, labeled 'Murmurgram', illustrates the result of a signal subtraction method used to isolate abnormal heart sounds. The fourth panel is a Color Spectrogram (CSP), which provides a time-frequency analysis of the cardiac cycle. The CSP shows frequency components on the y-axis (kHz) and time on the x-axis, with color intensity indicating amplitude. Notably, the murmurgram demonstrates a non-flat, high-amplitude signal between S1 and S2, indicating a systolic murmur. The corresponding CSP highlights a concentration of frequency components extending up to approximately 400 Hz (0.4 kHz), peaking in mid-systole (0.1–0.2 seconds). This visual data characterizes the harsh mid-systolic murmur typical of aortic stenosis, localized between the first and second heart sounds.
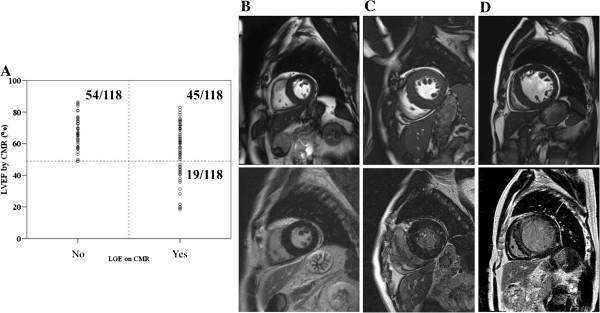
This composite educational image illustrates the classification of patients with aortic stenosis based on Cardiac Magnetic Resonance (CMR) findings. Section A features a scatter plot correlating Left Ventricular Ejection Fraction (LVEF, %) on the y-axis with the presence or absence of Late Gadolinium Enhancement (LGE) on the x-axis. A horizontal threshold at 50% LVEF divides the cohort into normal and depressed systolic function. Sections B, C, and D provide representative short-axis CMR images in two rows: the top row shows cine images (anatomic structure) and the bottom row shows corresponding LGE-CMR images (tissue characterization). Panel B (Group 1) displays normal LV size and no LGE. Panel C (Group 2) shows normal LV size but mid-wall/patchy hyperintensities indicative of replacement fibrosis (LGE positive). Panel D (Group 3) demonstrates a dilated left ventricle with both depressed LVEF and extensive, bright signal areas representing significant myocardial LGE. This material is used to teach subclinical adverse LV remodeling and the prognostic value of myocardial fibrosis in valvular heart disease.
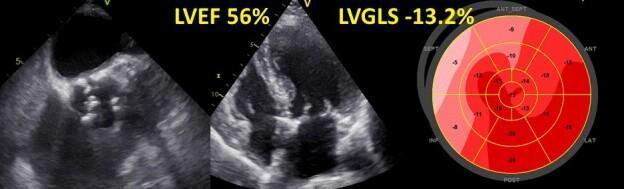
This composite diagnostic image features three panels representing a multimodal echocardiographic assessment of a patient with severe aortic stenosis. The left panel shows a grayscale 2D echocardiogram focusing on the aortic valve, demonstrating significant calcification and structural thickening. The central panel is an apical four-chamber view of the heart with an annotated Left Ventricular Ejection Fraction (LVEF) of 56%, indicating preserved systolic function. The right panel is a color-coded 'bullseye' polar plot illustrating speckle-tracking strain analysis. This plot maps regional longitudinal strain across segments of the left ventricle, including anterior (ANT), septal (SEPT), lateral (LAT), and posterior (POST) walls. A numerical value of -13.2% for Left Ventricular Global Longitudinal Strain (LVGLS) is displayed above the plot. The varying shades of red in the bullseye segments represent localized strain impairment, highlighting the clinical concept that global longitudinal strain can be significantly reduced even when the ejection fraction remains within normal limits. This visual is intended for cardiology and radiology education focusing on hemodynamic assessment and valvular heart disease.
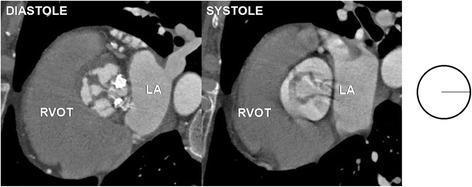
This diagnostic image consists of two axial computerized tomography (CT) scans and a supporting schematic diagram illustrating a rare unicuspid aortic valve (UAV). The CT images represent the heart during diastole (left) and systole (right). In the systolic frame, the aortic valve is seen as a single, lunar-shaped (teardrop) leaflet with only one visible commissure attached to the aortic wall. This morphology results in a significantly restricted, eccentric orifice area, which is a classic visual finding of severe valvular stenosis. Key anatomical landmarks are labeled, including the right ventricular outflow tract (RVOT) and the left atrium (LA). A line diagram to the right summarizes the single-commissure 'uncommissural' architecture. This visual material is used in cardiovascular radiology and cardiology education to differentiate congenital unicuspid variants from more common bicuspid or tricuspid aortic valve morphologies and to demonstrate the anatomical basis for early-onset aortic stenosis.
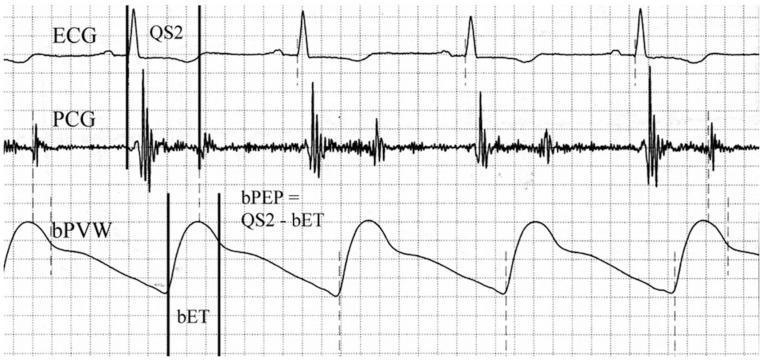
This physiological waveform diagram displays a simultaneous recording of three cardiac parameters used for assessing cardiovascular hemodynamics. The top trace is an Electrocardiogram (ECG) showing standard QRS complexes representing ventricular depolarization. The middle trace is a Phonocardiogram (PCG) capturing acoustic vibrations of heart sounds, specifically the S1 and S2 sounds. The bottom trace is a Brachial Pulse Volume Waveform (bPVW) illustrating the peripheral arterial pressure pulse. Vertical markers indicate temporal relationships between these signals to calculate systolic time intervals. The 'QS2' interval is marked from the onset of the QRS complex on the ECG to the aortic component of the second heart sound on the PCG, representing the total electromechanical systolic interval. The 'bET' (Brachial Ejection Time) is delineated on the bPVW from the waveform foot to the dicrotic notch. An annotated formula shows the calculation of the Brachial Pre-ejection Period (bPEP) as the difference between QS2 and bET (bPEP = QS2 - bET). This diagram is an educational tool for understanding the non-invasive assessment of cardiac systolic function and arterial stiffness.
Ejection Systolic Murmur (ESM)
Mechanism
- Starts after S1 (after isovolumetric contraction ends and the semilunar valves open)
- Peaks at the point of maximum flow velocity
- Ends before S2 (before semilunar valves close)
Causes
Left-sided (Aortic outflow)
| Cause | Key Features |
|---|---|
| Aortic stenosis (AS) | Harsh, late-peaking, heard best at aortic area (2nd right ICS), radiates to carotids |
| Bicuspid aortic valve | Often quieter over precordium, best at suprasternal notch |
| Hypertrophic obstructive cardiomyopathy (HOCM) | Harsh murmur at left sternal border, crescendo-decrescendo, increases with Valsalva/standing |
| Aortic sclerosis | Same position as AS but no gradient; softer |
| High-flow states | Anemia, thyrotoxicosis, pregnancy - flow murmur without stenosis |
| Supravalvular/subvalvular AS | Rare; similar murmur profile |
Right-sided (Pulmonary outflow)
| Cause | Key Features |
|---|---|
| Pulmonary stenosis (PS) | Best heard at left sternal border (pulmonic area, 2nd left ICS); radiates to left clavicle; associated with ejection click |
| Atrial septal defect (ASD) | Pulmonary ejection murmur from increased flow across pulmonary valve + fixed split S2 |
| Pulmonary artery stenosis | Murmur throughout the chest |
Innocent / Physiologic
- Pulmonary flow murmur of newborns
- Still's murmur (most common innocent murmur in children, musical/vibratory quality)
- Pulmonary ejection murmur of adolescence
- Pregnancy (high-flow state produces an ejection murmur resembling ASD)
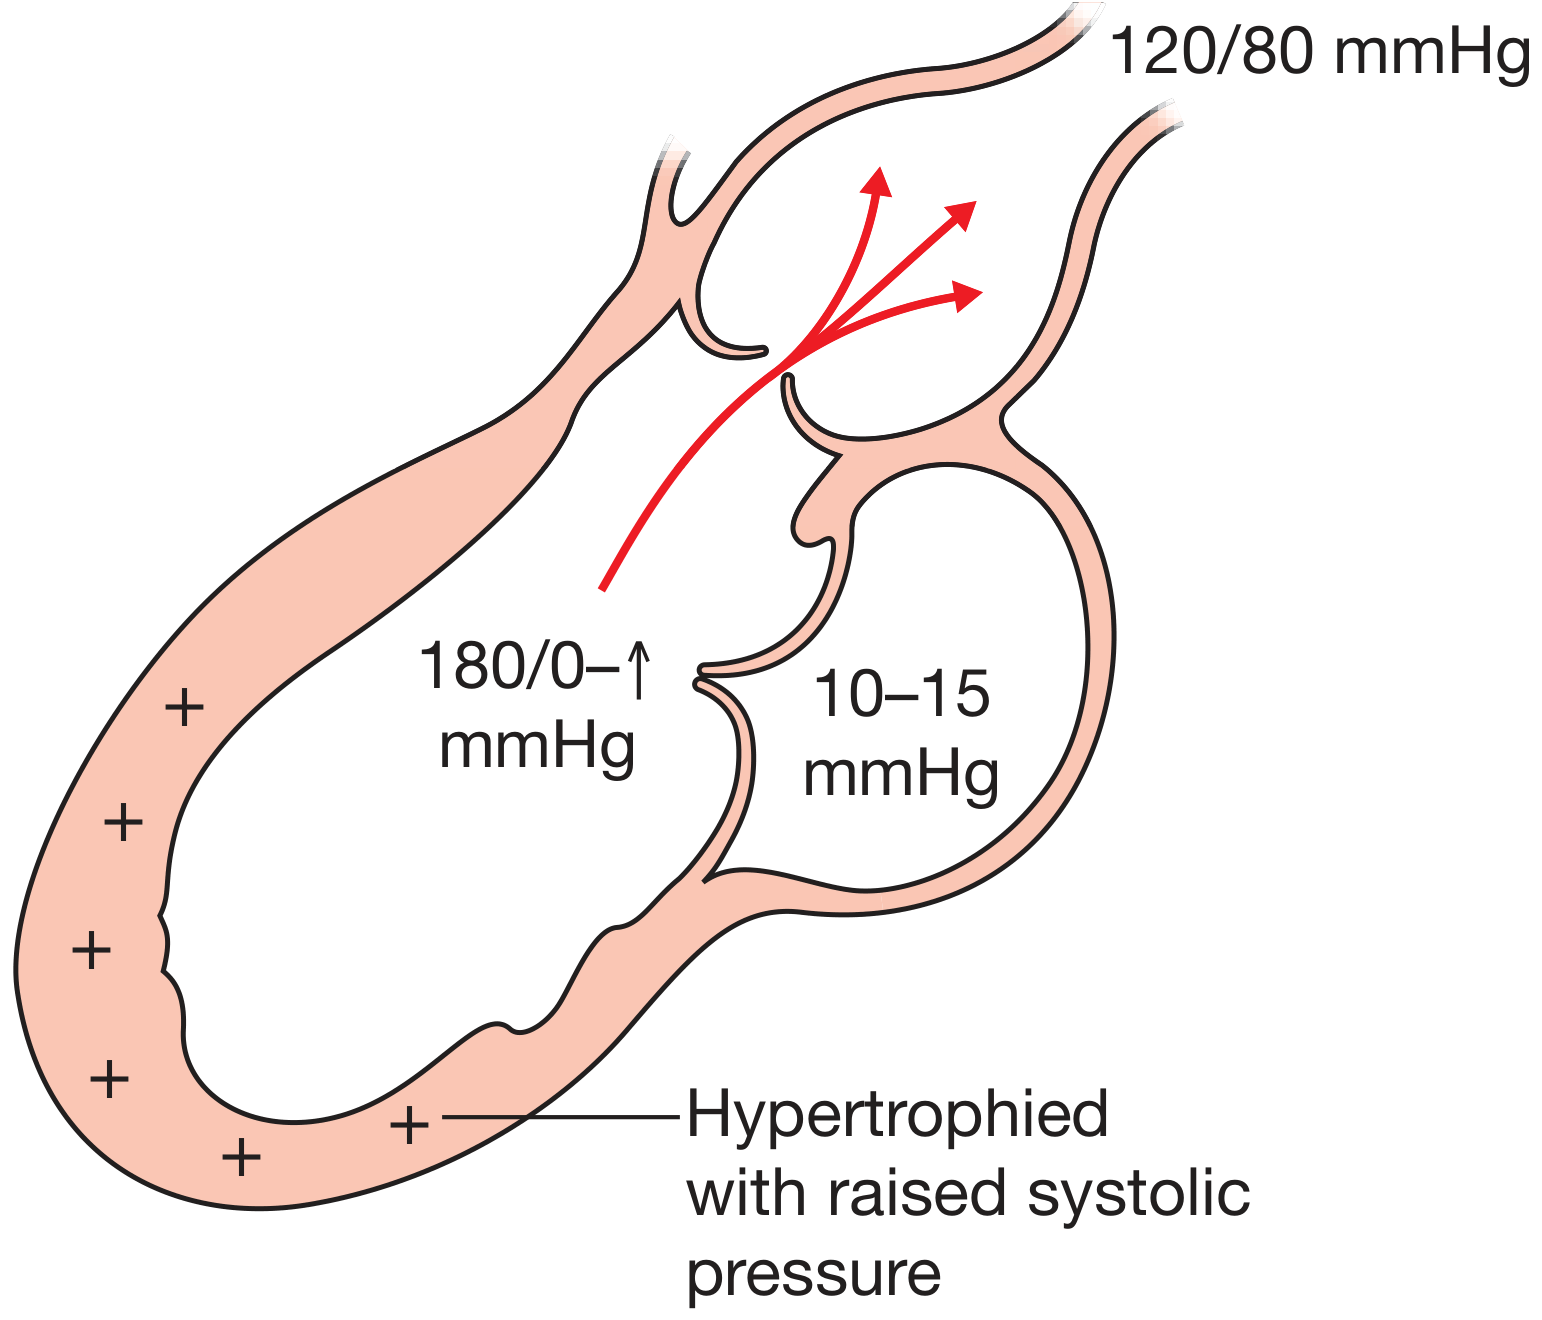
Characteristics of the ESM in Aortic Stenosis (Most Clinically Relevant)
- Quality: Harsh, rough, crescendo-decrescendo
- Location: Best at aortic area (2nd right ICS) with radiation to the carotids
- Timing: Late-peaking (the more severe the AS, the later the peak and the longer the duration)
- Severity correlation: In mild/moderate AS the peak is early; in severe AS the peak is late and the murmur may extend to S2
- Cessation before A2 helps distinguish it from a pansystolic mitral regurgitation murmur
- Gallavardin phenomenon: High-frequency components of the AS murmur radiate to the apex, where it sounds musical/higher-pitched and can be mistaken for mitral regurgitation
Grading (Levine Scale)
| Grade | Description |
|---|---|
| I | Barely audible (requires quiet room, experienced listener) |
| II | Soft but immediately audible |
| III | Moderately loud, no thrill |
| IV | Loud, associated with thrill |
| V | Very loud, thrill, audible with stethoscope edge |
| VI | Audible without stethoscope |
Differentiating ESM from Pansystolic Murmur
| Feature | Ejection Systolic | Pansystolic |
|---|---|---|
| Start | After S1 (gap present) | At S1 (no gap) |
| End | Before S2 | At or beyond S2 |
| Shape | Crescendo-decrescendo | Plateau/uniform |
| Causes | AS, PS, HOCM, flow states | MR, TR, VSD |
Maneuvers Affecting ESM Intensity
| Maneuver | AS/PS | HOCM |
|---|---|---|
| Valsalva (strain phase) | Decreases | Increases |
| Standing | Decreases | Increases |
| Squatting | Increases | Decreases |
| Amyl nitrite | Increases | Increases |
| Handgrip | Decreases | Decreases |
Associated Signs in Severe Aortic Stenosis
- Pulsus parvus et tardus - slow-rising, low-amplitude, late-peaking carotid pulse
- Sustained/heaving apex beat - from LV hypertrophy
- Soft or absent A2 - from reduced/immobile aortic leaflet movement
- Reversed splitting of S2 - in severe AS
- Systolic thrill at base/carotids
- S4 gallop - from LV hypertrophy and reduced compliance
valve apparatus
mitral valve apparatus anatomy leaflets chordae tendineae papillary muscles diagram
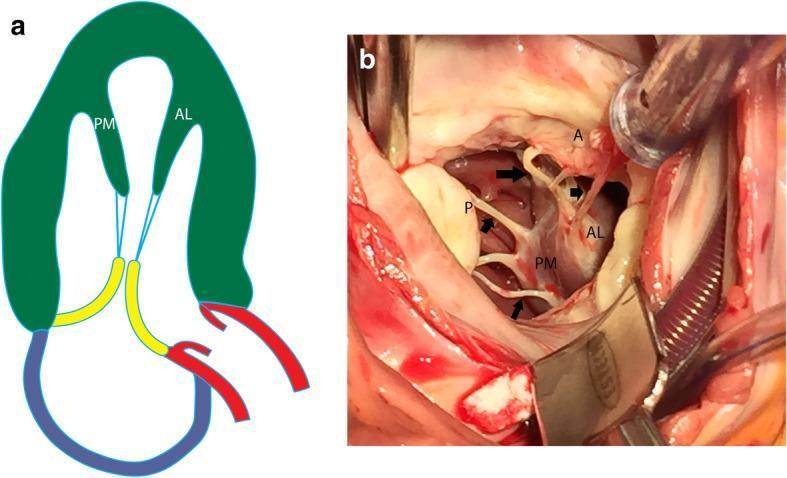
This dual-panel educational material illustrates the normal anatomy of the mitral valve apparatus within the left ventricle. Panel A is an anatomical diagram in a vertical long-axis projection showing the anterolateral (AL) and posteromedial (PM) papillary muscles (green) originating from the ventricular wall. Blue lines represent chordae tendineae connecting the papillary muscles to the mitral valve leaflets (yellow). Panel B is an intraoperative clinical photograph providing a direct surgical view of these structures. It clearly demonstrates the fleshy heads of the anterolateral (AL) and posteromedial (PM) papillary muscles. Multiple thin, white fibrous strands—the chordae tendineae (indicated by black arrows)—extend from the papillary muscle heads to insert into the anterior (A) and posterior (P) mitral valve leaflets. The image highlights the mechanical tethering system essential for valvular competence during the cardiac cycle, specifically demonstrating how both papillary muscles contribute chordae to both leaflets to prevent valve prolapse into the left atrium during systole.
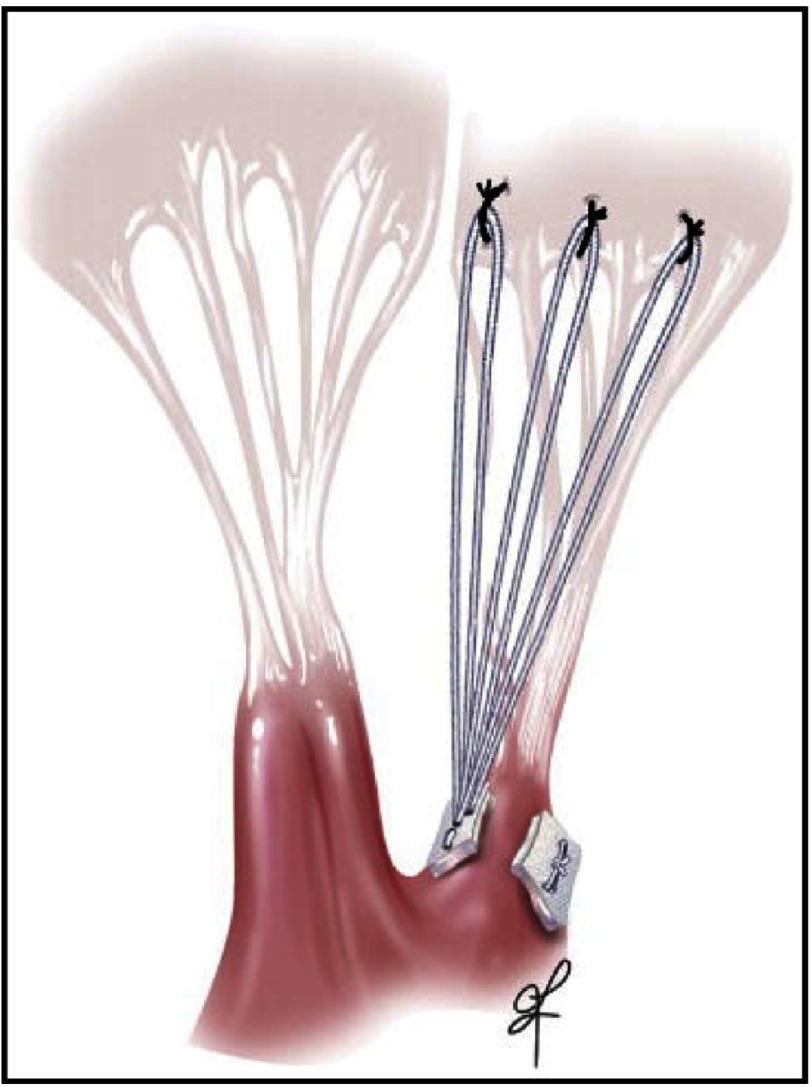
This medical illustration depicts a mitral valve repair utilizing artificial chordae tendineae (neochordae). The diagram shows a surgical view of the subvalvular apparatus, featuring the papillary muscles and mitral valve leaflets. Three sets of artificial chordal loops, represented as thin blue-grey lines made of PTFE, are anchored to the papillary muscle using white felt pledgets. The distal ends of these loops are sutured to the atrial aspect of the posterior mitral valve leaflet at the line of coaptation, visible as distinct black knots. Adjacent to the artificial cords, natural chordae tendineae are shown as thin, translucent string-like structures connecting the opposite leaflet to the papillary muscle. This illustration demonstrates a chordal replacement technique designed to treat mitral regurgitation—specifically for conditions like Barlow’s disease or fibroelastic deficiency—by restoring leaflet support and proper coaptation depth without the need for tissue resection.
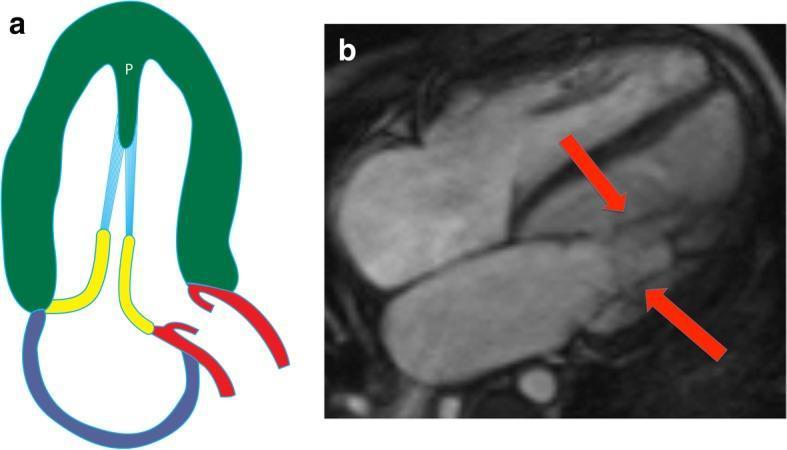
This composite image illustrates the anatomy of a parachute mitral valve (PMV) through a schematic diagram and a diagnostic cardiac MRI. Panel A is an anatomical diagram showing the characteristic single papillary muscle (labeled 'P') within the left ventricle, from which all chordae tendineae (blue) originate. This configuration forces the mitral valve leaflets (yellow) into a restricted, funnel-like shape resembling a parachute. Panel B shows a four-chamber steady-state free precession (SSFP) cardiac MRI sequence. Red arrows indicate the convergent attachment of multiple chordae tendineae to a solitary, centrally located papillary muscle, rather than the typical distribution between anterolateral and posteromedial muscles. This rare congenital anomaly is a significant finding in pediatric and adult cardiology, often associated with mitral stenosis due to reduced leaflet mobility and restricted valve orifice area. It may also present as part of the Shone complex. The image serves as an educational tool for identifying atypical subvalvular apparatus morphology in congenital heart disease.
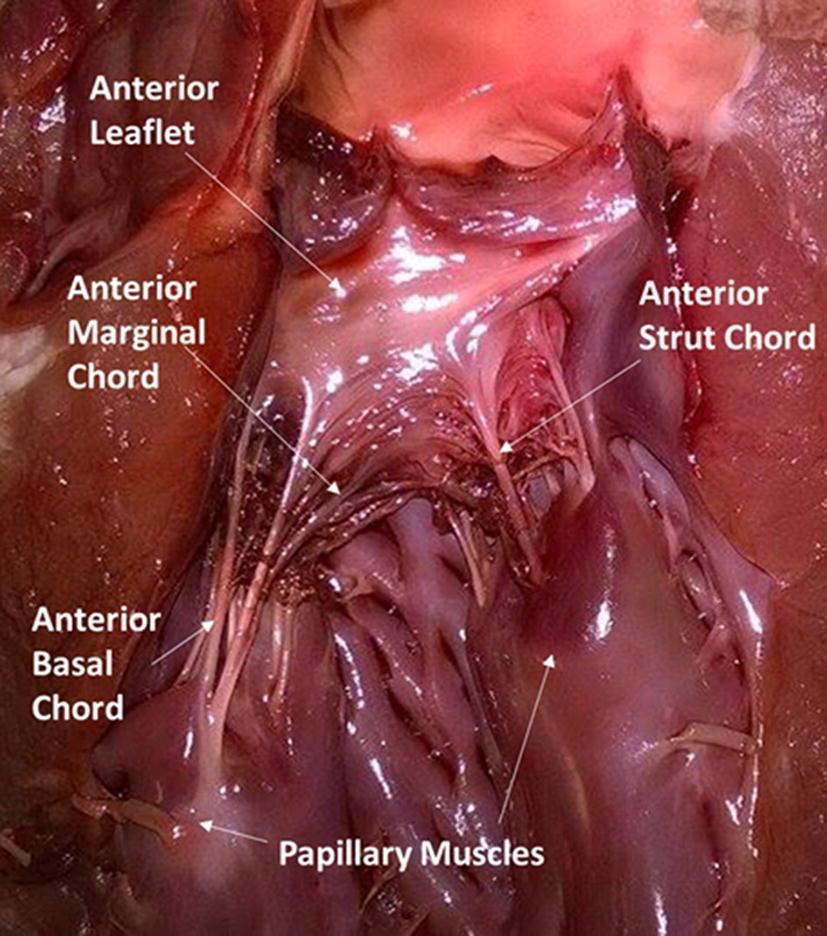
This clinical photograph of a porcine cardiac specimen (used as a model for human anatomy) illustrates the structural components of the mitral valve apparatus. The image highlights the anterior mitral valve leaflet and its associated chordae tendineae and papillary muscles. Key anatomical structures are labeled: the anterior leaflet appears as a translucent, pinkish-white fibrous sheet; the robust, reddish-purple papillary muscles serve as the inferior anchoring point. The description identifies three specific types of chordae tendineae based on their insertion points: the anterior marginal chord (attaching to the leaflet edge), the anterior basal chord (attaching to the leaflet base), and the anterior strut chord (thicker support structures attaching to the leaflet body). This specimen demonstrates the complex spatial relationship between the ventricular wall and the valvular leaflets, essential for understanding cardiac mechanics, valvular competence, and surgical repair techniques in cardiology and cardiothoracic surgery.
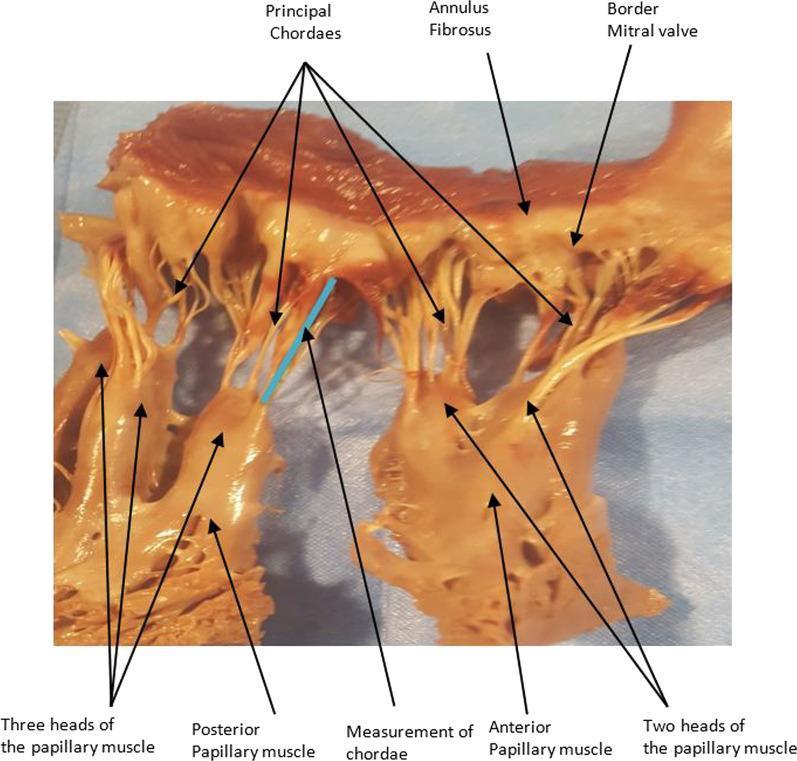
Anatomical photograph of a dissected human mitral valve apparatus, illustrating the subvalvular structures. The image features a detailed view of the anterior and posterior papillary muscles and their respective heads; specifically, the anterior papillary muscle is shown with two heads, while the posterior papillary muscle exhibits three heads. Multiple 'principal chordae' tendineae are clearly visible as fibrous cords connecting the papillary muscle heads to the mitral valve leaflets. The 'annulus fibrosus' (the fibrous ring of the valve) and the 'border of the mitral valve' are labeled at the superior portion of the specimen. A blue line indicates the 'measurement of chordae,' demonstrating the methodology for quantifying subvalvular dimensions. This clinical image is primarily used for anatomical study, surgical planning for mitral valve repair, and understanding the complex morphology of the left ventricular outflow tract and valvular support system.

A three-panel anatomical diagram (A-C) illustrating the step-by-step surgical implantation of artificial chordae using the CardioMech system for mitral valve repair. (A) Shows a transcatheter delivery system (blue catheter with a silver metallic distal tip) approaching the posterior mitral leaflet (PML) to perform a puncture. (B) Illustrates the deployment and anchoring of a blue ePTFE artificial chord into the papillary muscle within the left ventricle. (C) Depicts the final stage where the neochorda is tensioned to adjust the leaflet's position and ensure proper coaptation. The diagram highlights the interaction between the surgical instruments, the thin blue artificial chordae, and the cardiac anatomy, including the mitral leaflets and papillary muscles. This educational visual is designed to demonstrate minimally invasive, beating-heart techniques for correcting mitral regurgitation by replacing ruptured or elongated natural chordae tendineae.
The Valve Apparatus
Components of the Mitral Valve Apparatus
- Left atrium
- Mitral annulus
- Anterior and posterior leaflets
- Chordae tendineae
- Papillary muscles
- LV myocardium
1. Mitral Annulus
- A saddle-shaped fibrous ring (bent ellipse) that anchors the leaflets to the atrioventricular junction
- The most apical points of the saddle are seen in the apical four-chamber view; the most basal points in the long-axis view
- The annulus is smaller in systole than diastole - it actively contracts
- Annular dilation (from LV enlargement, atrial fibrillation) stretches the leaflets apart and causes functional MR
2. Leaflets
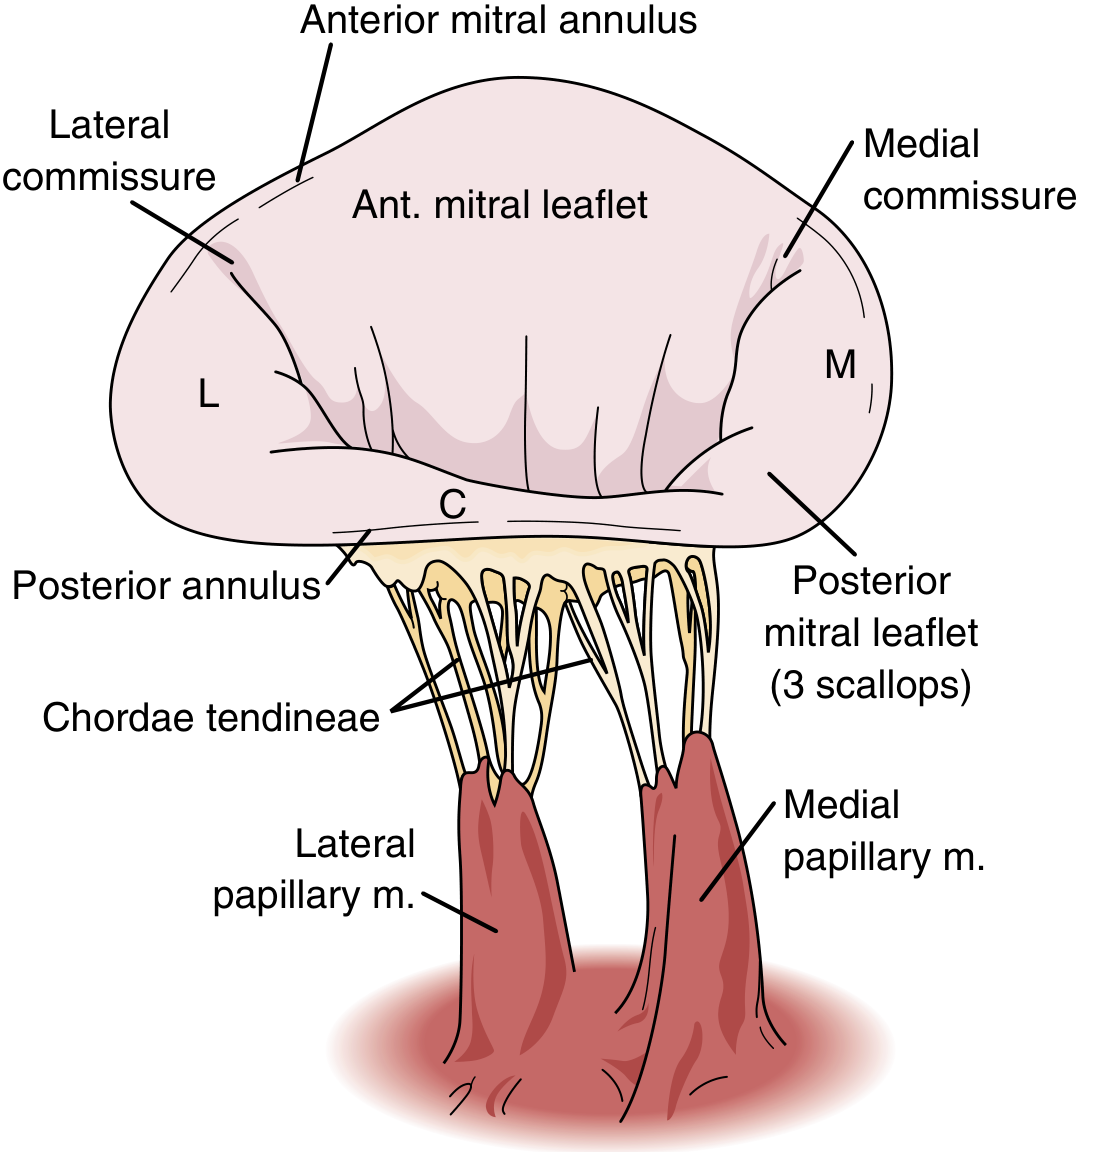
| Feature | Anterior Leaflet | Posterior Leaflet |
|---|---|---|
| Annular attachment | ~1/3 of annular circumference | ~2/3 of annular circumference |
| Length | Longer | Shorter |
| Scallops | None | 3 scallops: P1 (lateral), P2 (central), P3 (medial) |
- In systole, the leaflets coapt (overlap slightly), forming a C-shaped coaptation zone that prevents regurgitation
- In diastole, the anterior leaflet opens toward the ventricular septum, nearly touching it
3. Chordae Tendineae
| Type | Insertion | Function |
|---|---|---|
| Primary (marginal) | Free edge of leaflet | Prevent prolapse |
| Secondary (strut chords) | Ventricular surface, body of leaflet | Structural support; maintain LV geometry |
| Tertiary (basal) | Base of posterior leaflet only | Anchor the leaflet base |
- Rupture of primary chords → leaflet flail → acute severe MR
- Both papillary muscles send chordae to both leaflets (not each to its respective leaflet) - this is clinically important
4. Papillary Muscles
| Anterolateral (AL) | Posteromedial (PM) | |
|---|---|---|
| Heads | Usually 1 body/head | 2 or more bodies/heads |
| Blood supply | Dual - left anterior descending + circumflex (or marginal branches of LCA) | Single - terminal branch of posterior descending artery (from RCA or circumflex) |
| Vulnerability to ischemia | Lower (dual supply) | Higher - more commonly ruptured in MI |
5. LV Myocardium
Functional Role of the Apparatus
- During diastole: Leaflets open passively as mitral valve pressure gradient drives blood from LA to LV. Chordae relax.
- During systole: LV contracts, papillary muscles contract simultaneously, tightening the chordae and pulling the leaflets toward each other, ensuring competent closure. The annulus constricts, reducing the valve area by ~20-25%.
Clinical Importance: Preservation of the Mitral Apparatus in Surgery
- Maintains the prolate ellipsoid shape of the LV
- Prevents a sudden fall in LV ejection fraction post-operatively
- Improves long-term survival
Analogous Right-Sided Apparatus (Tricuspid Valve)
- 3 leaflets: anterior, posterior, septal
- 3 papillary muscles: anterior (largest), posterior, septal (smallest)
- Chordae tendineae connecting all
- The septal leaflet is the defining feature - its chordae attach directly to the interventricular septum (unlike the mitral valve)
factors affecting intensity of S1
Factors Affecting the Intensity of S1
What Generates S1
- The distance the anterior mitral leaflet must travel back to its annular plane before closure
- Leaflet mobility
- LV contractility
- The PR interval
Causes of LOUD S1
| Factor | Mechanism | Clinical Example |
|---|---|---|
| Short PR interval | Mitral valve is wide open when systole begins; has to snap shut rapidly with great excursion, generating forceful vibration | WPW/pre-excitation, sinus tachycardia |
| Tachycardia / hyperdynamic states | Short PR + high contractility; most common cause of a loud S1 in clinical practice | Fever, anaemia, thyrotoxicosis, exercise, anxiety |
| Mitral stenosis (pliable leaflets) | Leaflets are held open throughout diastole by the pressure gradient; they are still held wide apart when systole begins, snapping shut with great force. The "tapping" S1 is often the only early sign of rheumatic involvement | Early/mild rheumatic MS with mobile, non-calcified leaflets |
| High-output states | Increased stroke volume and contractility | Pregnancy (S1 louder + more widely split in ~90% of pregnant women), anaemia, thyrotoxicosis |
| Ebstein's anomaly | Exceptionally large, sail-like anterior tricuspid leaflet produces a loud T1 component (an exception - most S1 abnormalities affect only M1) | Ebstein's anomaly |
Causes of SOFT S1
| Factor | Mechanism | Clinical Example |
|---|---|---|
| Prolonged PR interval (1st degree AV block) | Mitral valve partially closes during the long PR interval before ventricular systole; by the time systole begins, the valve is nearly shut and the excursion is minimal | 1st degree heart block, digoxin toxicity |
| Long R-R intervals | Same mechanism - diastole is prolonged, valve drifts towards closure | Atrial fibrillation (long cycles have soft S1; short cycles have loud S1 - hence variable intensity S1 in AF) |
| Mitral stenosis (calcified, immobile leaflets) | Severely calcified/fibrotic valve cannot move freely; cannot generate forceful vibration on closure | Late/severe calcific rheumatic MS |
| LV systolic dysfunction / cardiomyopathy | Reduced contractility = less forceful valve closure | Dilated cardiomyopathy, acute MI |
| Acute severe aortic regurgitation | Markedly elevated LV end-diastolic pressure causes premature closure of the mitral valve during diastole; valve is nearly shut before S1 | Acute AR (e.g. endocarditis, aortic dissection) |
| Mitral regurgitation (primary) | Damaged, poorly coapting leaflets that cannot generate a normal closing force | Flail mitral leaflet, rheumatic MR |
| Beta-blocker therapy | Reduces contractility |
Causes of VARIABLE S1
| Condition | Reason |
|---|---|
| Atrial fibrillation | Variable R-R intervals: short cycles (short diastole, valve open wide) → loud S1; long cycles (long diastole, valve partially closed) → soft S1 |
| Complete heart block (3rd degree AV block) | PR interval changes continuously as P waves "march through" - the S1 varies in intensity with each beat as the AV relationship changes; cannon a-waves in JVP are the jugular counterpart |
| Ventricular tachycardia / AV dissociation | Same principle - PR interval varies with each beat |
Extracardiac Factors Reducing S1 (and all heart sounds)
- Obesity (thick chest wall)
- COPD / emphysema (hyperinflated lungs interpose air)
- Pericardial effusion (fluid attenuates sound transmission)
- Pneumothorax
- Mechanical ventilation (increased intrathoracic air)
- Pleural effusion
Summary Table
| S1 | Key Causes |
|---|---|
| Loud | Short PR, tachycardia/hyperdynamic state, mitral stenosis (pliable), Ebstein's anomaly |
| Soft | Long PR (1st degree block), cardiomyopathy/LV dysfunction, calcific MS, acute AR, beta-blockers |
| Variable | Atrial fibrillation, complete AV block, VT with AV dissociation |
Clinical Pearl
- Loud S1 = pliable, mobile leaflets = good candidate for percutaneous balloon mitral valvuloplasty (PBMV)
- Soft S1 = calcified, immobile leaflets = valvuloplasty less likely to succeed; surgical replacement may be needed