insulin resistance
Reading File
Finding Sources
Searching PubMed
"insulin resistance"[MeSH Terms] AND mechanism
Reading File
Reading File
Reading File
Reading File
Loading Image
Here is a comprehensive overview of insulin resistance drawn from Harrison's, Robbins, and Goodman & Gilman's.
Insulin Resistance
Definition
Insulin resistance is the failure of target tissues to respond normally to insulin. It is measured as the amount of glucose cleared from the blood in response to a fixed dose or plasma concentration of insulin. There is considerable variability among cells, tissues, and individuals, and it is affected by age, body weight, physical activity, illness, and medications.
— Goodman & Gilman's, p. 1049
Primary Target Tissues
The three major insulin-responsive tissues are skeletal muscle, adipose tissue, and liver:
| Tissue | Normal Insulin Action | Effect When Resistant |
|---|---|---|
| Liver | Suppresses gluconeogenesis & glycogenolysis | Excess fasting glucose production |
| Skeletal muscle | Stimulates glucose uptake & glycogen synthesis | High postprandial glucose; intramuscular TG accumulation |
| Adipose tissue | Inhibits hormone-sensitive lipase (anti-lipolysis) | Excess free fatty acid (FFA) release → systemic IR |
— Robbins & Kumar Basic Pathology, p. 2519–2525
Pathophysiology
1. Free Fatty Acid–Driven Cycle (Central Mechanism)
The most important early driver is an overabundance of circulating free fatty acids (FFAs), released by adipose tissue lipolysis:
- FFAs impair insulin-mediated glucose uptake in muscle
- In the liver, FFAs increase endogenous glucose production and triglyceride synthesis → VLDL secretion → dyslipidemia
- Ectopic lipid deposition in muscle and liver directly impedes insulin signaling
Critically, inhibition of lipolysis is the most sensitive pathway of insulin action, so early IR causes more lipolysis → more FFAs → more IR (a self-amplifying cycle).
— Harrison's, p. 3297
2. Inflammation
Enlarged adipose tissue is infiltrated by macrophages. Adipocytokines secreted by adipocytes and immune cells impair insulin signaling:
- Pro-IR: TNF-α, IL-6, resistin, retinol-binding protein 4, visfatin, fetuin-A, asprosin, PAI-1
- Anti-IR (reduced in obesity): adiponectin (improves insulin sensitivity in adipose and muscle)
3. Leptin Resistance
Physiologically, leptin reduces appetite, promotes energy expenditure, and enhances insulin sensitivity. Obesity leads to hyperleptinemia and leptin resistance in the brain → compounding IR, hyperlipidemia, and cardiovascular risk.
4. Mitochondrial Dysfunction
A defect in mitochondrial oxidative phosphorylation leads to accumulation of triglycerides and lipid metabolites in muscle, liver, and β-cells — seen in insulin-resistant individuals with obesity, T2D, offspring of T2D patients, and the elderly. This is the basis of the oxidative stress hypothesis.
5. Gut Microbiome
An increased Firmicutes/Bacteroidetes ratio is associated with obesity-related IR. Mechanisms involve diet, bile acid metabolism, and pro-inflammatory signaling.
6. Cellular Signaling Defects
At the cellular level, IR involves blunted steps in the cascade from insulin receptor tyrosine kinase → PI3K/Akt → GLUT4 translocation. However, specific mutations in the signaling cascade are not responsible in most individuals. Very rare mutations in the insulin receptor's extracellular α-chain cause severe IR syndromes and lipodystrophy.
Pathophysiology Diagram
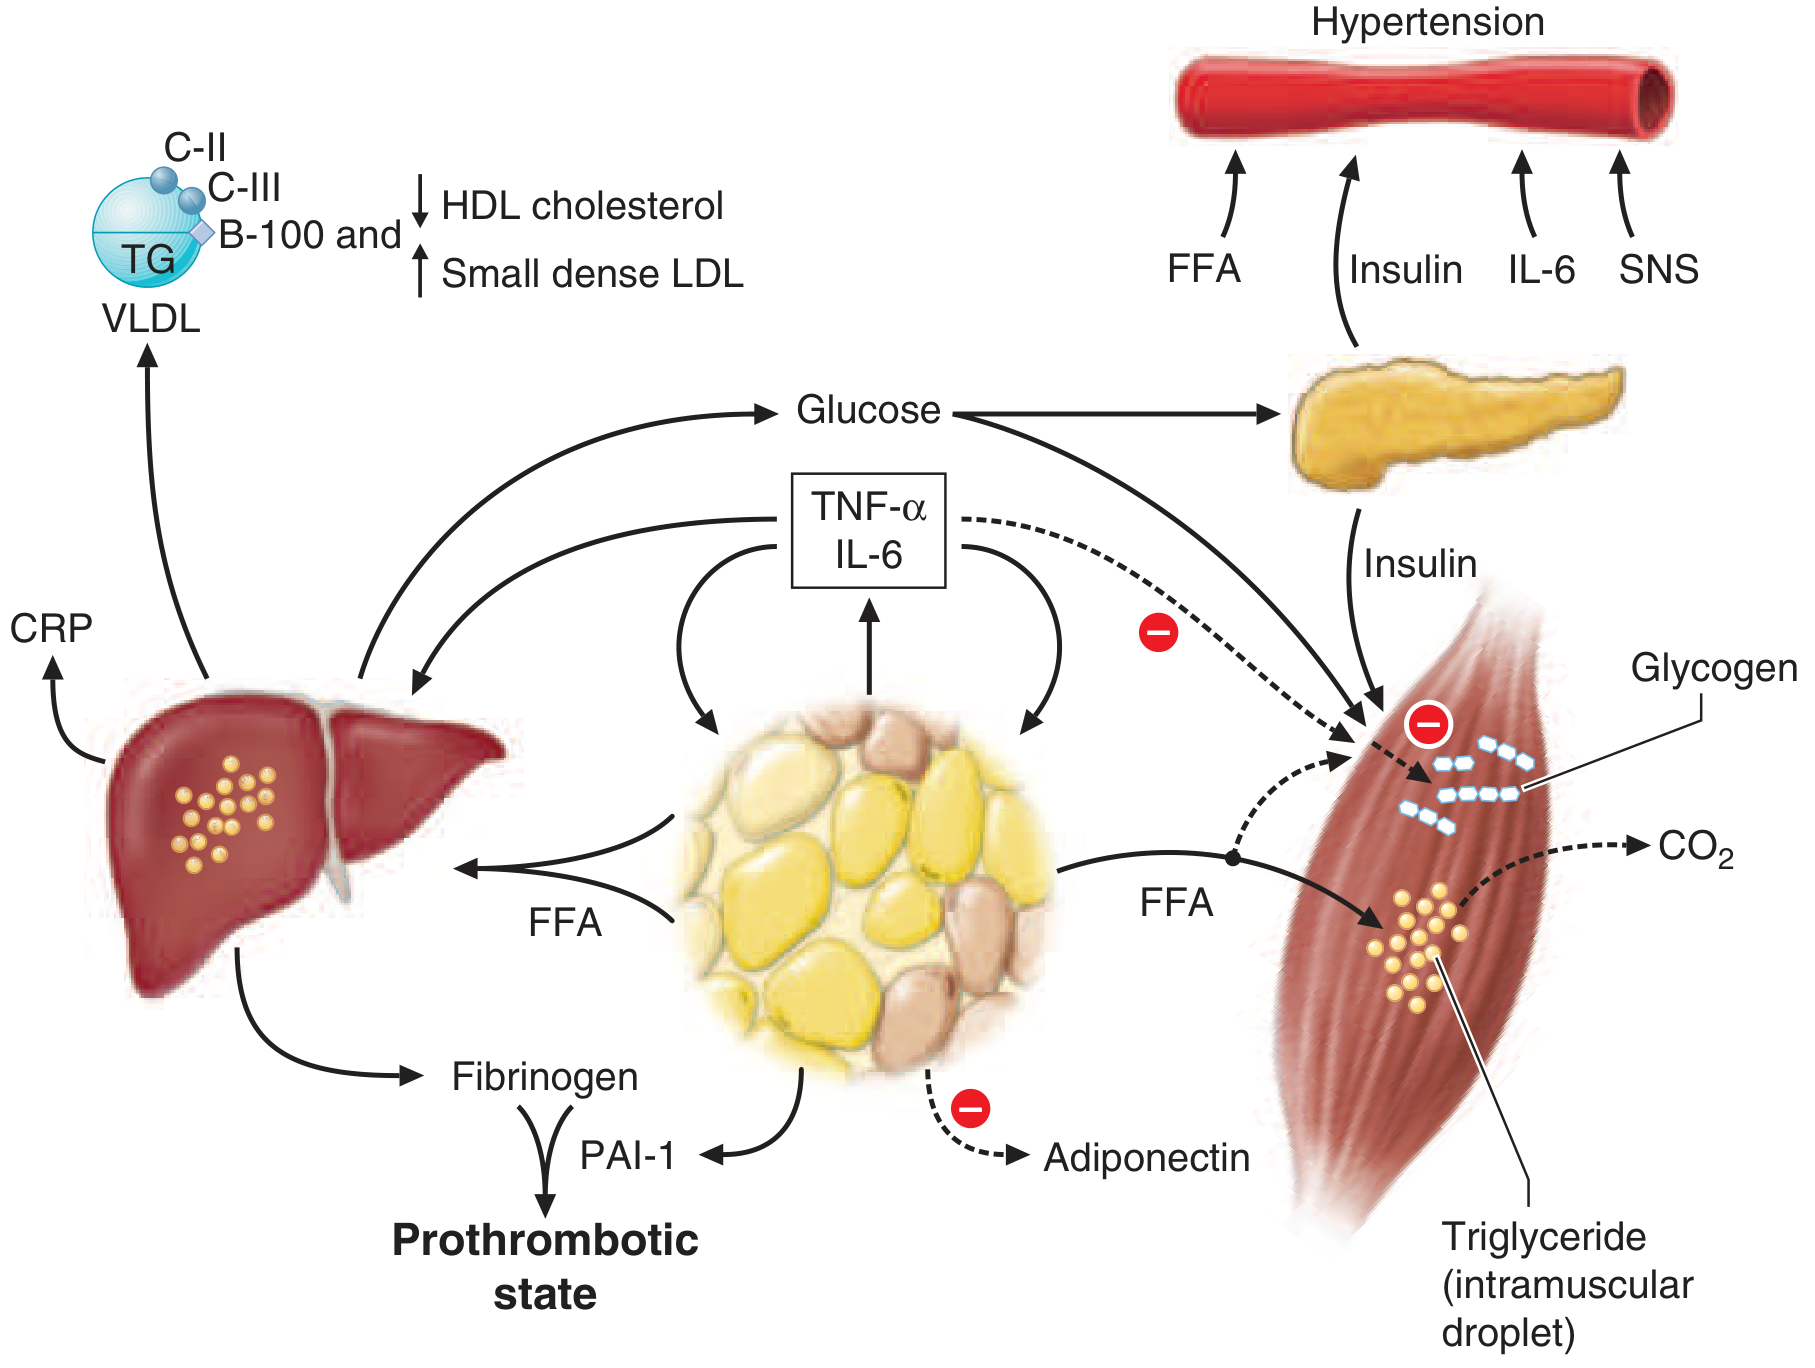
FFAs from expanded adipose tissue drive hepatic VLDL overproduction, muscle glucose uptake failure, and β-cell overstimulation. TNF-α/IL-6 from adipose macrophages amplify IR. Reduced adiponectin removes protective signaling. The net result is dyslipidemia, hypertension, hyperglycemia, a prothrombotic state, and elevated CRP. — Harrison's, Fig. 420-2
Consequences & Associated Conditions
| System | Consequence |
|---|---|
| Pancreas | Compensatory hyperinsulinemia → eventual β-cell exhaustion → T2D |
| Liver | NAFLD/MASLD; excess gluconeogenesis; hepatic steatosis |
| Lipids | ↑ TG, ↑ VLDL, ↑ small dense LDL, ↓ HDL |
| Cardiovascular | Hypertension (via hyperinsulinemia → renal Na⁺ retention + ↑ SNS activity); atherosclerosis |
| Coagulation | ↑ Fibrinogen, ↑ PAI-1 → prothrombotic state |
| Inflammation | ↑ CRP |
| Adiposity | Visceral adiposity > subcutaneous fat in driving IR |
Key Risk Factors
- Visceral obesity (waist circumference; visceral > subcutaneous fat)
- Physical inactivity
- Aging
- Medications (glucocorticoids, antipsychotics, certain antiretrovirals)
- Genetic predisposition (family history of T2D)
- Ethnic background (higher prevalence in South/East Asians, partly due to visceral fat predominance)
Clinical Progression
Postprandial hyperinsulinemia → fasting hyperinsulinemia → hyperglycemia (impaired fasting glucose/IGT → T2D)
β-cells initially compensate by increasing insulin secretion. Over time, lipotoxicity from excess FFAs and glucotoxicity impair β-cell function → relative insulin deficiency superimposed on IR → overt T2D.
Measurement
Insulin sensitivity is assessed clinically via:
- Fasting insulin / HOMA-IR (homeostatic model assessment)
- Euglycemic hyperinsulinemic clamp (gold standard)
- OGTT with insulin levels
- Surrogate markers: fasting TG, TG/HDL ratio, waist circumference
Sources: Harrison's Principles of Internal Medicine 22E (2025), Robbins & Kumar Basic Pathology, Goodman & Gilman's Pharmacological Basis of Therapeutics
uric acid renal excretion and hyperuricemia
Finding Sources
Searching PubMed
"uric acid"[MeSH Terms] AND "hyperuricemia"[MeSH Terms] AND "renal"[All Fields]
Reading File
Reading File
Reading File
Reading File
Reading File
Finding Sources
Reading File
Finding Sources
Reading File
Reading File
Reading File
Loading Image
I now have everything needed for a comprehensive answer. Here it is:
Uric Acid Renal Excretion & Hyperuricemia
1. Uric Acid Production
Uric acid is the final oxidation product of purine catabolism in humans (humans lack uricase). The two routes:
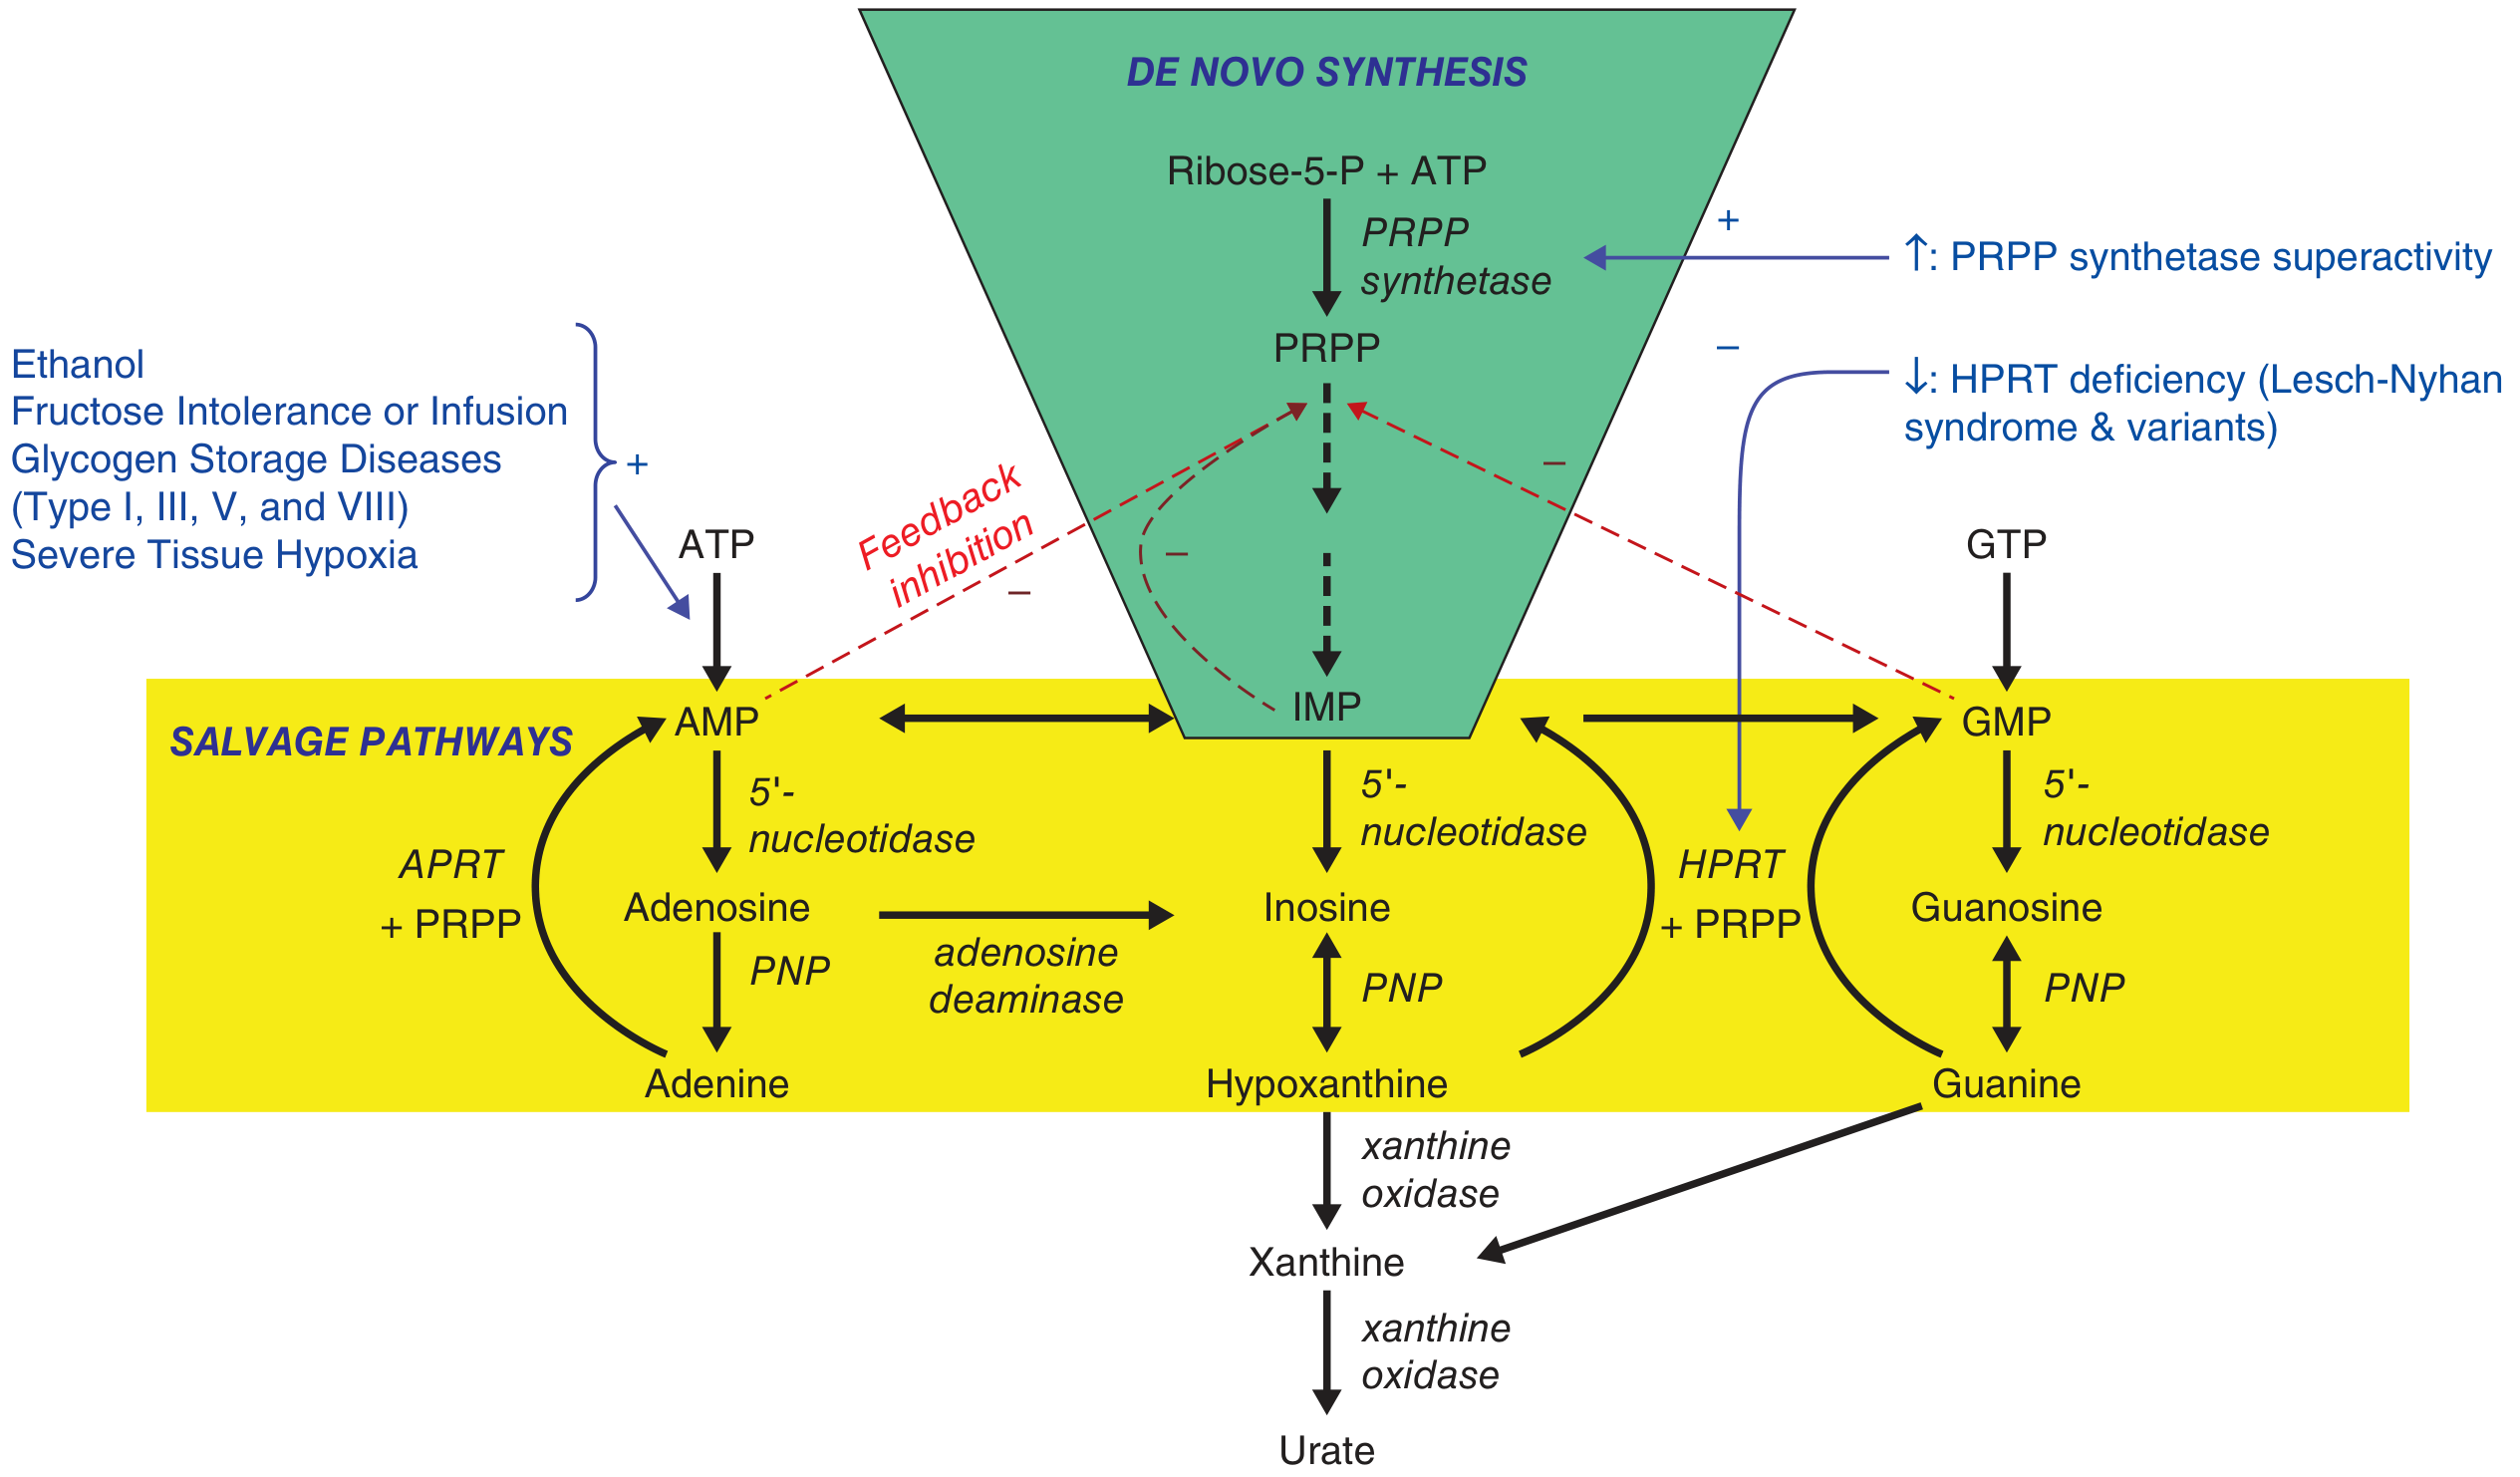
De novo synthesis (green) feeds into salvage pathways (yellow). Both converge on hypoxanthine/xanthine → xanthine oxidase → urate. PRPP synthetase superactivity and HPRT deficiency (Lesch-Nyhan) are the key enzyme errors. — Harrison's 22E, Fig. 384-2
2. Renal Excretion of Uric Acid
~2/3 of daily uric acid elimination is renal; ~1/3 is via the GI tract (intestinal uricolysis by gut bacteria).
The kidney handles urate through four sequential processes in the proximal tubule:
| Step | Process | Key Transporters |
|---|---|---|
| 1 | Glomerular filtration | Freely filtered (urate is ~95% unbound in plasma) |
| 2 | Proximal tubular reabsorption (dominant) | URAT1 (SLC22A12), OAT4, OAT10, GLUT9b (apical); GLUT9a (basolateral) |
| 3 | Tubular secretion | MRP4, UAT, ABCG2, NPT1 (apical); OAT1 (SLC22A6), OAT3 (SLC22A8) (basolateral) |
| 4 | Post-secretory reabsorption | URAT1, GLUT9 |
Net result: ~90% of filtered urate is reabsorbed; only ~10% of filtered load appears in urine.
Key Transporter Details
URAT1 (SLC22A12):
- Located at the apical membrane of the proximal tubule
- Exchanges intracellular organic anions (e.g., lactate, pyrazinoate, nicotinate) for luminal urate → drives urate back into the tubule cell
- This is why lactate (alcohol), pyrazinoate (pyrazinamide), and nicotinate are anti-uricosuric — they provide the exchange substrate that promotes urate reabsorption
- Loss-of-function mutations → familial renal hypouricemia; gain-of-function polymorphisms → hyperuricemia and gout
GLUT9 (SLC2A9):
- Basolateral efflux transporter — moves reabsorbed urate from tubule cell into the bloodstream
- Polymorphisms in SLC2A9 are the most statistically significant genetic determinants of serum urate in GWAS studies
ABCG2:
- ATP-driven efflux transporter at the apical membrane of the proximal tubule and in intestinal epithelial cells
- Secretes urate into the tubular lumen (renal) and into the gut (extra-renal)
- In CKD, intestinal ABCG2-mediated excretion compensates for impaired renal handling (up to 70% of excretion may shift to the gut)
- Polymorphisms → reduced intestinal secretion → cases previously labelled as "overproducers" are actually extra-renal underexcretors
OAT1/OAT3 (SLC22A6/8):
- Basolateral uptake of urate from peritubular blood into tubule cell — drive the secretory limb
— Brenner & Rector's The Kidney, p. 346; Goldman-Cecil Medicine, E-Fig. 252-1; Harrison's 22E, p. 3001
3. Hyperuricemia
Definition: Serum urate > 6.8 mg/dL (408 μmol/L) — the saturation threshold at physiological pH 7.40 and body temperature. Above this, monosodium urate (MSU) crystals can precipitate.
Mechanisms — Overproduction vs. Underexcretion
| Category | Examples |
|---|---|
| Overproduction | Lympho/myeloproliferative disorders, psoriasis, hemolytic anemia, polycythemia vera, glycogen storage diseases (types I/III/V/VIII), alcohol (accelerates ATP → AMP → urate), fructose ingestion, PRPP synthetase superactivity, HPRT deficiency (Lesch-Nyhan/Kelley-Seegmiller) |
| Renal underexcretion | CKD, thiazide/loop diuretics, cyclosporine (CNI), pyrazinamide, ethambutol, low-dose aspirin, lead nephropathy, hypothyroidism, metabolic syndrome/insulin resistance |
| Extra-renal underexcretion | ABCG2 polymorphisms (gut secretion defect) — may account for many cases previously labelled as overproducers |
Clinically important: 24-hour urinary uric acid >1000 mg on a standard Western diet traditionally defined overproduction. However, ABCG2-mediated gut underexcretion blurs this classification.
Quantitative Threshold in Gout
Gouty patients excrete only 70% as much uric acid as normal individuals at any given serum urate level, and require a serum urate ~1.7 mg/dL higher to achieve the same urinary excretion rate as non-gouty individuals. — Goldman-Cecil Medicine, p. 2879
Genetic Contribution
- Common polymorphisms in SLC2A9 (GLUT9), ABCG2, SLC22A12 (URAT1) explain ~6% of the total variance in serum urate between gouty and non-gouty individuals
- 67% of variance is driven by non-genetic factors: serum creatinine, alcohol consumption, components of metabolic syndrome — Goldman-Cecil, p. 2879
4. Drug Effects on Renal Urate Handling
| Drug | Effect on Serum Urate | Mechanism |
|---|---|---|
| Thiazides | ↑ (↑~35%) | Volume depletion → ↑ reabsorption; competition for secretion |
| Loop diuretics | ↑ | Same mechanisms as thiazides |
| Cyclosporin/tacrolimus (CNIs) | ↑ | ↓ Tubular secretion of urate |
| Pyrazinamide | ↑ | Pyrazinoate inhibits URAT1 exchange (provides exchange substrate) |
| Low-dose aspirin | ↑ | Inhibits tubular secretion |
| Losartan | ↓ (weak uricosuric) | Inhibits URAT1 reabsorption |
| Probenecid | ↓ (uricosuric) | Inhibits URAT1 and proximal tubular reabsorption |
| Allopurinol / febuxostat | ↓ | Xanthine oxidase inhibition → ↓ urate synthesis |
| Lesinurad / dotinurad | ↓ (uricosuric) | Selective URAT1 inhibitor |
5. Hyperuricemia and the Kidney — Bidirectional Relationship
Hyperuricemia both results from and contributes to CKD:
- Hyperuricemia → CKD: Uric acid decreases nitric oxide production → endothelial dysfunction, hypertension, renal fibrosis, pro-inflammatory cytokine (TNF-α, IL-6) release → T-cell activation. Independent association with contrast-induced AKI (adjusted OR 1.68; 95% CI 1.38–2.04 in meta-analysis of 13,084 patients).
- CKD → Hyperuricemia: As GFR falls, renal urate clearance declines; intestinal ABCG2 compensates but eventually insufficient.
- Urate-lowering therapy (xanthine oxidase inhibitors) in CKD with hyperuricemia: some trials show eGFR preservation (MD +6.82 mL/min/1.73 m² vs. placebo), but current evidence is insufficient to recommend uric acid lowering in CKD without clinical gout.
— Brenner & Rector's The Kidney, p. 996–997; Comprehensive Clinical Nephrology 7E, p. 1318
Sources: Harrison's Principles of Internal Medicine 22E (2025); Goldman-Cecil Medicine; Brenner & Rector's The Kidney; Comprehensive Clinical Nephrology 7E; Goodman & Gilman's Pharmacological Basis of Therapeutics
etiology of hyperuricemia
Finding Sources
Finding Sources
Reading File
Reading File
Reading File
Reading File
Reading File
Reading File
Reading File
I now have comprehensive, well-sourced content from four textbooks. Here is the structured answer:
Etiology of Hyperuricemia
Hyperuricemia = serum urate > 6.8 mg/dL (the physiological saturation threshold at pH 7.40 and body temperature). It results when urate production exceeds renal (and intestinal) elimination.
Key proportion: >90% of cases are caused by renal underexcretion; <10% by urate overproduction alone. — Goldman-Cecil Medicine; Lippincott Biochemistry 8e
I. Renal Underexcretion (>90% of cases)
Normal kidneys filter urate freely, then reabsorb ~90% of the filtered load in the proximal tubule via the transportasome (URAT1, GLUT9, OAT1/3, ABCG2, etc.). Underexcretion occurs when this balance is disrupted.
A. Primary / Idiopathic
- Inherent, uncharacterised excretory defects in tubular urate handling (most common cause of hyperuricemia in the general population)
B. Reduced GFR / Intrinsic Renal Disease
| Condition | Mechanism |
|---|---|
| Acute or chronic kidney disease | Fewer functioning nephrons → ↓ urate clearance |
| Lead nephropathy (saturnine gout) | Lead damages proximal tubule → ↓ secretion |
| Medullary cystic kidney disease | Structural tubular damage |
| Familial juvenile hyperuricemic nephropathy | Autosomal dominant tubulointerstitial disease |
C. Enhanced Tubular Reabsorption / Reduced Secretion — Clinical States
| Condition | Mechanism |
|---|---|
| Hypertension | Reduced renal perfusion; often compounded by diuretics |
| Obesity / metabolic syndrome | ↑ insulin → ↑ renal urate reabsorption |
| Lactic acidosis | Lactate drives URAT1 exchange → ↑ urate reabsorption |
| Ketoacidosis (diabetic, starvation, alcoholic) | Acetoacetate/β-hydroxybutyrate drive URAT1 reabsorption |
| Hypothyroidism | ↓ GFR and ↓ tubular secretion |
| Hyperparathyroidism | ↓ renal urate clearance |
| Preeclampsia | ↓ GFR + tubular dysfunction |
| Dehydration | Volume contraction → ↑ proximal reabsorption |
| Down syndrome (Trisomy 21) | Reduced renal clearance |
D. Drug-Induced Underexcretion
| Drug | Mechanism |
|---|---|
| Thiazide diuretics | Volume depletion → ↑ reabsorption; competition for tubular secretion; ↑ serum urate ~35% |
| Loop diuretics | Same mechanism as thiazides |
| Cyclosporine > tacrolimus (CNIs) | Direct tubular secretion inhibition; common post-transplant |
| Low-dose salicylates (0.06–3.0 g/day) | Block urate secretion at low doses (paradox: high-dose ASA is uricosuric) |
| Pyrazinamide | Pyrazinoate drives URAT1 exchange → ↑ reabsorption |
| Ethambutol | Reduces tubular secretion |
| Nicotinic acid (niacin) | Competes with urate secretion |
| Levodopa | Competes for tubular secretion |
| ACE inhibitors / β-blockers | Minor reduction in renal urate clearance |
| Pancreatic enzyme extracts | Reduce renal urate clearance |
| Ethanol | Lactic acid production (drives URAT1) + accelerated ATP → AMP → urate |
II. Urate Overproduction (<10% of cases)
Defined operationally as urinary uric acid >1,000 mg/24 h on a standard Western diet. Reflects either accelerated purine synthesis (de novo or salvage pathway) or rapid nucleic acid catabolism.
Note: ABCG2 gut transporter dysfunction may reclassify many apparent "overproducers" — they are actually extra-renal underexcretors.
A. Primary Enzymatic Defects (Rare, Genetic)
| Defect | Mechanism | Phenotype |
|---|---|---|
| HPRT deficiency — complete (Lesch-Nyhan) / partial (Kelley-Seegmiller) | ↓ Purine salvage → ↑ free PRPP → ↑ de novo synthesis → ↑ urate | Neurologic dysfunction + early-onset gout (complete); gout alone (partial) |
| PRPP synthetase superactivity | ↑ PRPP production → ↑ de novo purine synthesis | Neurologic dysfunction + early-onset gout; X-linked |
B. Accelerated Cell Turnover (Secondary)
| Condition | Mechanism |
|---|---|
| Lymphoproliferative neoplasms (Burkitt lymphoma, myeloma) | Massive nucleic acid release |
| Myeloproliferative neoplasms (AML, polycythemia vera) | Rapid cell division and destruction |
| Tumor lysis syndrome | Sudden massive purine release after chemotherapy/radiotherapy |
| Chronic hemolytic anemia | ↑ RBC turnover → ↑ purine catabolism |
| Psoriasis (severe) | ↑ keratinocyte turnover |
C. Metabolic/Enzymatic Causes of ↑ ATP Degradation
| Condition | Mechanism |
|---|---|
| Glycogen storage disease type I (von Gierke — G6Pase deficiency) | Hypoglycaemia → ↑ glucagon → accelerated ATP → AMP → urate; also lactate → ↓ renal excretion |
| GSD type III, V, VII | Excessive muscle glycolysis → ATP depletion → ↑ purine catabolism |
| Fructose-1-phosphate aldolase deficiency (hereditary fructose intolerance) | Fructose-1-P traps phosphate → ↑ AMP degradation |
| Myoadenylate deaminase deficiency | ↑ AMP → inosine → urate pathway |
| Carnitine palmitoyltransferase II deficiency | Rhabdomyolysis → muscle ATP depletion |
| Severe muscle exertion / rhabdomyolysis | Same as above |
| Severe tissue hypoxia | ↑ AMP catabolism |
D. Dietary Overproduction
| Factor | Mechanism |
|---|---|
| Red meat, organ meat, shellfish | High purine content → ↑ urate load |
| Beer | Guanosine content + alcohol effect |
| High-fructose corn syrup / fructose | Fructose phosphorylation traps phosphate → ↑ ATP degradation → ↑ urate; also ↓ renal excretion |
| Alcohol (all types) | Acetate/lactate → ↑ URAT1-driven reabsorption; ↑ purine catabolism; dehydration |
III. Extra-Renal Underexcretion — The Third Mechanism
Newly recognised as a distinct and significant category:
- ABCG2 polymorphisms (gut transporter): Intestinal ABCG2 normally handles ~1/3 of daily urate excretion. Loss-of-function variants reduce intestinal urate secretion → systemic accumulation. Many patients previously labelled overproducers on 24-h urine testing are in fact gut underexcretors.
IV. Genetic Causes — Summary Table
(Goldman-Cecil Table 252-2)
| Category | Syndrome |
|---|---|
| Inborn errors of purine metabolism | HPRT deficiency (Lesch-Nyhan, Kelley-Seegmiller); PRPP synthetase superactivity |
| Excessive cell death / urate generation | GSD I, III, V, VII; Fructose-1-P aldolase deficiency; Myoadenylate deaminase deficiency; CPT-II deficiency |
| Reduced renal excretion | Medullary cystic kidney disease; Familial juvenile hyperuricemic nephropathy; Transportasome mutations (GLUT9/SLC2A9, ABCG2, URAT1/SLC22A12) |
Common transportasome polymorphisms explain only ~6% of serum urate variance; 67% of variance between gouty and non-gouty individuals is driven by non-genetic factors (serum creatinine, ethanol, metabolic syndrome components). — Goldman-Cecil Medicine, p. 2879
Sources: Goldman-Cecil Medicine; Lippincott Illustrated Reviews: Biochemistry 8e; Tietz Textbook of Laboratory Medicine 7e; Dermatology 2-Volume Set 5e (Bolognía); Harrison's Principles of Internal Medicine 22E
how insulin resistance starts
Finding Sources
Finding Sources
Reading File
Reading File
Finding Sources
Finding Sources
Finding Sources
Finding Sources
Reading File
Reading File
Finding Sources
Reading File
Reading File
Loading Image
Reading File
I now have all the pieces needed — normal signaling, where it breaks down, and what triggers the breakdown. Here is the integrated answer:
How Insulin Resistance Starts
To understand how insulin resistance begins, you first need to understand what normal insulin signaling looks like — because IR is specifically a disruption of that cascade.
Step 1 — Normal Insulin Signaling (What Gets Disrupted)
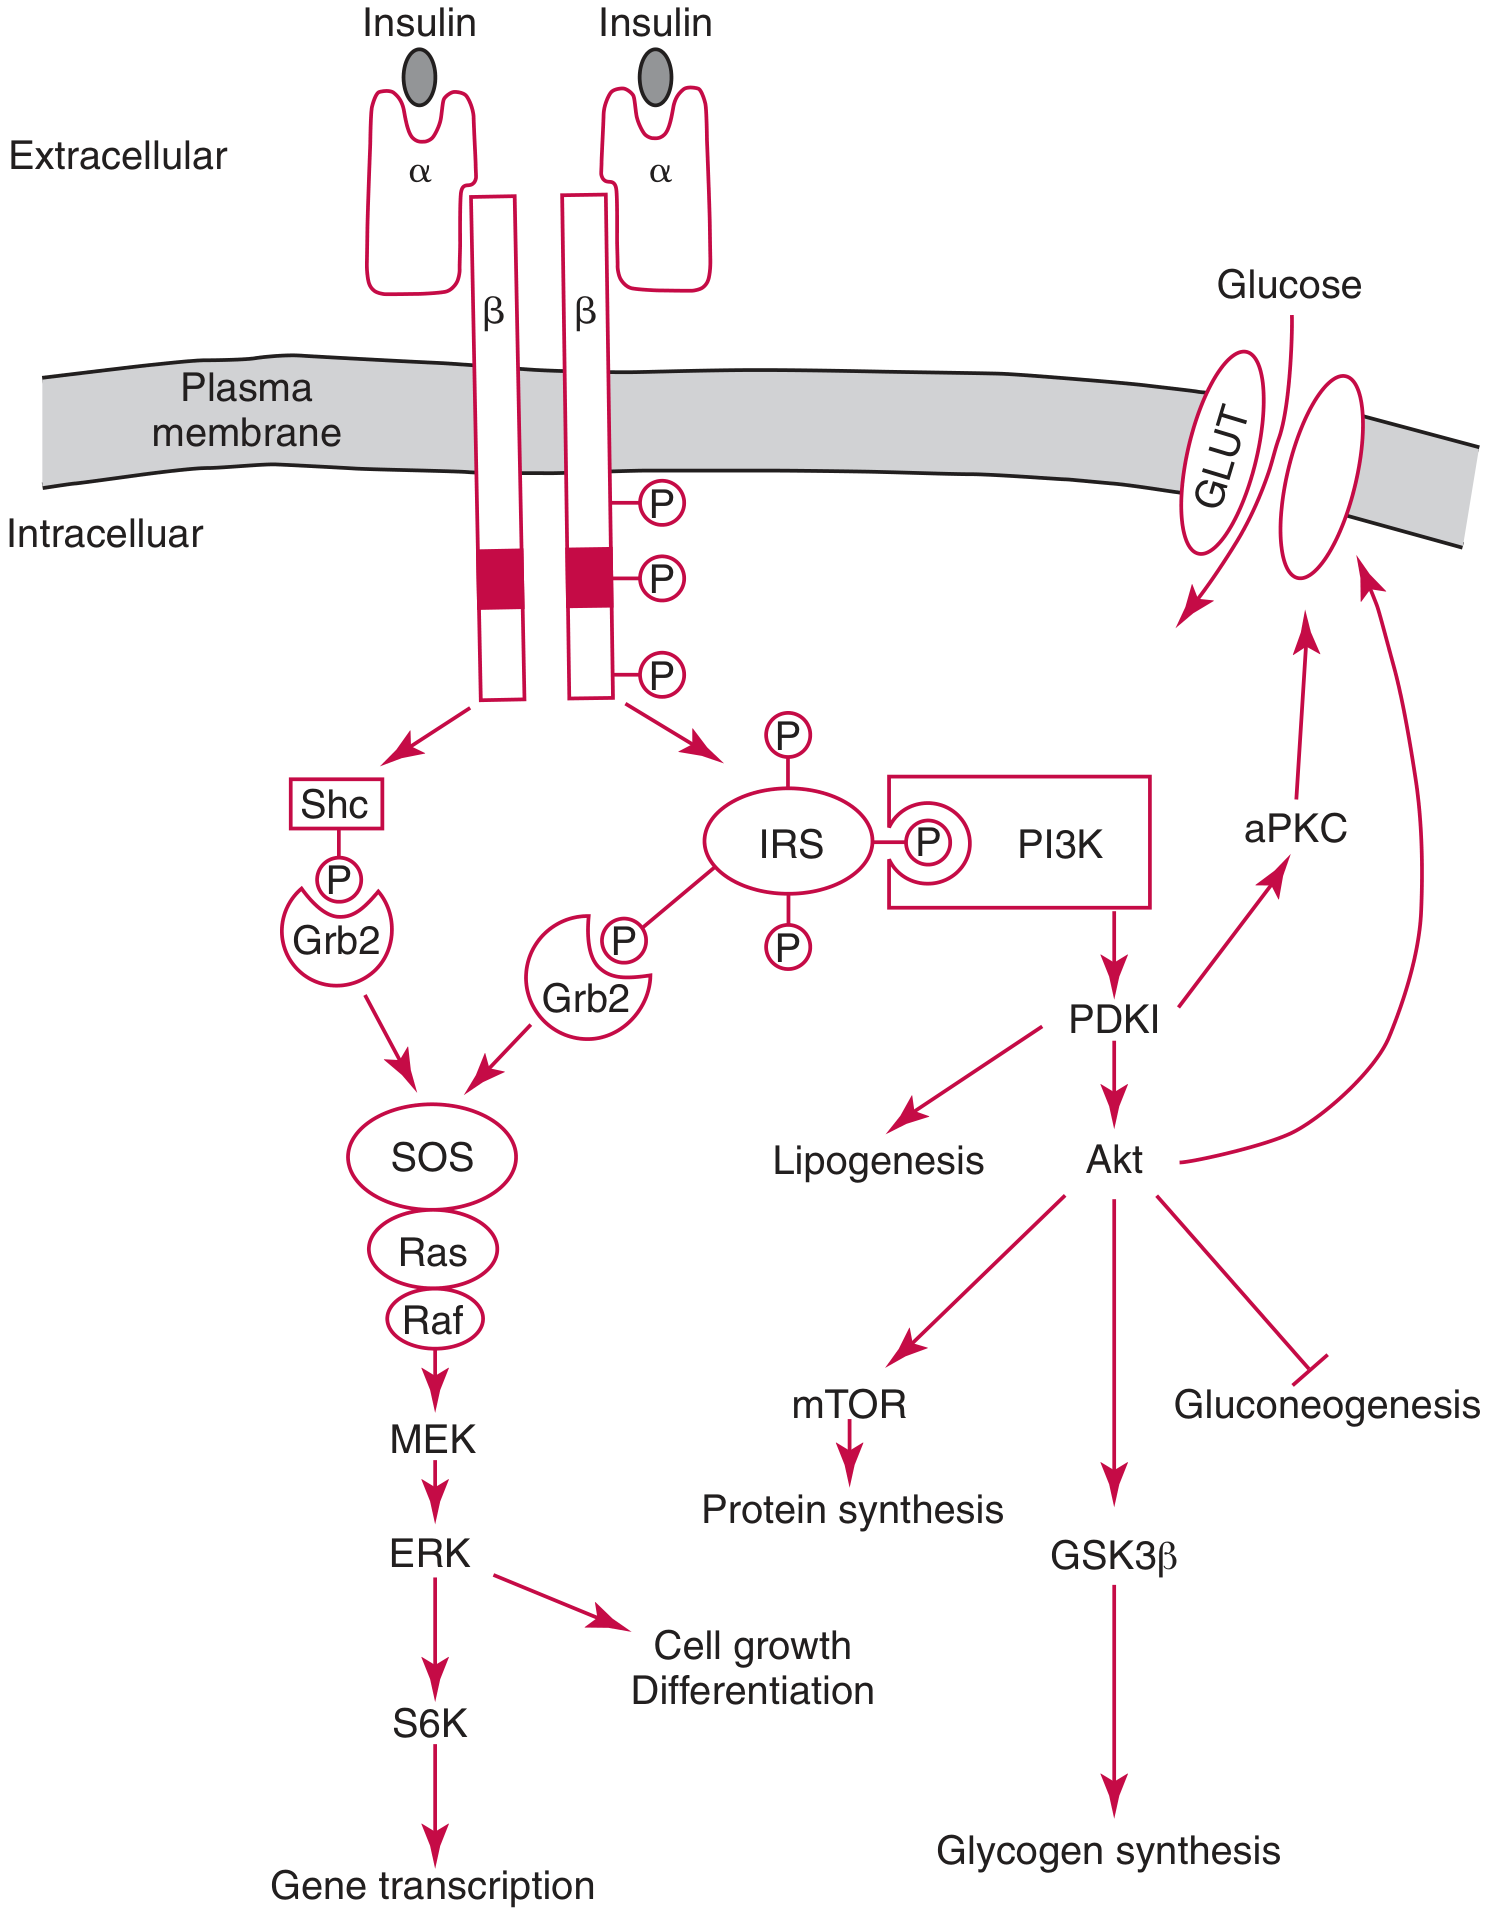
Insulin → α-subunit binding → β-subunit tyrosine kinase activation → IRS phosphorylation → PI3K → PDK1 → Akt → GLUT4 translocation + glycogen synthesis + suppression of gluconeogenesis. — Tietz Textbook of Laboratory Medicine 7e, Fig. 47.5
The insulin receptor is a heterotetrameric tyrosine kinase receptor (2α + 2β subunits):
- Insulin binds extracellular α-subunits → conformational change
- Intracellular β-subunits autophosphorylate on tyrosine residues → tyrosine kinase activated
- Receptor phosphorylates IRS proteins (IRS-1, IRS-2, IRS-3, IRS-4) on tyrosine
- Phospho-IRS recruits and activates PI3K
- PI3K → PIP₃ → PDK1 → Akt (PKB)
- Akt drives:
- GLUT4 vesicle translocation to plasma membrane (muscle, adipose) → glucose uptake
- GSK-3β inactivation → glycogen synthesis (liver, muscle)
- FOXO1 phosphorylation → suppression of gluconeogenesis
- mTOR activation → protein synthesis
A parallel branch (Shc → Grb2 → Ras → ERK) mediates mitogenic/growth effects.
Insulin resistance involves blunted steps in this cascade, particularly at the IRS → PI3K → GLUT4 level. The molecular mechanisms are incompletely understood. — Goodman & Gilman's
Step 2 — The Initiating Event: Excess Lipid Accumulation
The development of insulin resistance is usually a gradual process, beginning with excess weight gain and obesity. The central initiating mechanism is lipotoxicity — the toxic effect of lipid accumulation in non-adipose tissues (skeletal muscle, liver) as a result of excess weight gain. — Guyton & Hall, p. 974
How it unfolds:
1. Visceral adipose expansion
- Excess caloric intake → adipocyte hypertrophy, especially in visceral/abdominal depots
- Visceral fat releases FFAs directly into the portal circulation
- Adipocytes become dysfunctional: ↑ lipolysis, ↑ pro-inflammatory adipokine secretion, ↓ adiponectin
2. FFA overflow → ectopic lipid deposition
- FFAs flood skeletal muscle and liver beyond their oxidative capacity
- Intramyocellular and intrahepatic triglycerides accumulate
- Toxic lipid intermediates form: diacylglycerol (DAG) and ceramide
3. DAG → PKC activation → IRS-1 serine phosphorylation
- DAG activates protein kinase C (PKCθ in muscle, PKCε in liver)
- PKC phosphorylates IRS-1/IRS-2 on serine residues (instead of tyrosine)
- Serine phosphorylation of IRS inhibits its normal function as a PI3K docking scaffold → downstream PI3K/Akt/GLUT4 signaling is blunted
- This is the core molecular lesion at the cellular level
4. Inflammation amplifies the defect
- Expanded adipose tissue becomes infiltrated by macrophages (M1-polarised)
- TNF-α and IL-6 are released systemically
- TNF-α independently activates IRS-1 serine kinases (JNK, IKKβ) → further serine phosphorylation of IRS-1 → worsening IR
- This creates a feed-forward inflammatory loop
5. Receptor downregulation
- Chronic hyperinsulinemia → insulin receptor downregulation (↓ receptor synthesis, ↑ receptor degradation via endocytosis)
- Fewer surface receptors → less signal initiated even before the downstream cascade is impaired
- This is part of why obesity-associated hyperinsulinemia paradoxically worsens IR — Costanzo Physiology 7e
Step 3 — The Self-Amplifying Cycle
Once initiated, insulin resistance amplifies itself:
Visceral fat ↑
    ↓ FFA release ↑
        ↓ Ectopic lipid (muscle, liver)
            ↓ DAG → PKC → IRS-1 serine-P
                ↓ ↓ PI3K/Akt/GLUT4
                    ↓ Impaired glucose uptake
                        ↓ Compensatory hyperinsulinemia
                            ↓ Receptor downregulation
                                ↓ Deeper IR
In adipose tissue, the inhibition of lipolysis is the most sensitive pathway of insulin action — so even mild early IR causes more lipolysis → more FFA → more IR. — Harrison's 22E
Step 4 — Tissue-Specific Onset
IR does not start simultaneously everywhere. The sequence:
| Tissue | When IR Appears | Key Consequence |
|---|---|---|
| Adipose tissue | Earliest — most insulin-sensitive pathway (anti-lipolysis) | ↑ FFA release → feeds muscle and liver |
| Skeletal muscle | Early — largest glucose disposal site | Post-prandial hyperglycemia |
| Liver | Later | Fasting hyperglycemia; NAFLD; ↑ VLDL |
| Pancreatic β-cells | Late (compensation → exhaustion) | Relative insulin deficiency → T2D |
Summary — The Initiating Sequence
| Stage | Event |
|---|---|
| Trigger | Caloric excess → visceral adipose expansion |
| Lipid overflow | ↑ FFA → ectopic fat in muscle/liver |
| Molecular lesion | DAG → PKC → IRS-1 Ser phosphorylation → ↓ PI3K/Akt |
| Inflammatory amplifier | TNF-α/IL-6 → JNK/IKKβ → more IRS-1 Ser-P |
| Receptor loss | Hyperinsulinemia → receptor downregulation |
| Compensation | ↑ Insulin secretion → postprandial euglycemia maintained (early) |
| Decompensation | β-cell exhaustion → frank hyperglycemia → T2D |
Sources: Tietz Textbook of Laboratory Medicine 7e; Guyton & Hall Medical Physiology 14e; Costanzo Physiology 7e; Harrison's Principles of Internal Medicine 22E; Schwartz's Principles of Surgery 11e
This is a shared conversation. Sign in to Orris to start your own chat.