
Digoxin and hypokalemia
digoxin toxicity hypokalemia
digoxin toxicity ECG arrhythmia
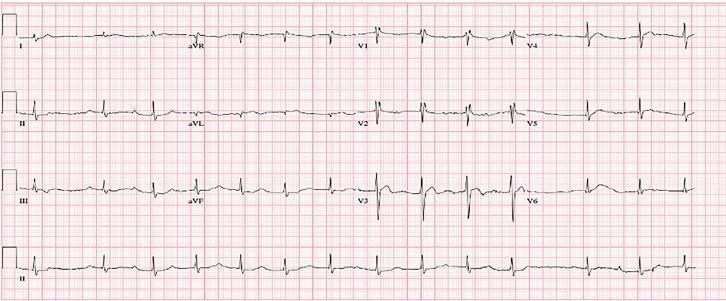
A standard 12-lead diagnostic electrocardiogram (ECG) printed on grid paper, demonstrating key clinical features of cardiac glycoside toxicity. The tracing shows a sinus rhythm with a prolonged PR interval, indicative of a first-degree atrioventricular (AV) block. There is widespread, persistent ST-segment depression, most prominent in the precordial leads (V1 through V6), characterized by a down-sloping morphology often described as the 'digoxin effect.' Associated with this depression are biphasic T-waves across multiple leads. These findings represent a transition from a higher-degree heart block to a more stable conduction pattern following the administration of digoxin immune fab. The educational focus of this image is the recognition of ECG changes associated with cardiotoxic glycosides (e.g., Cerbera odollam or digoxin) and the assessment of treatment response in a clinical toxicology or emergency medicine context.
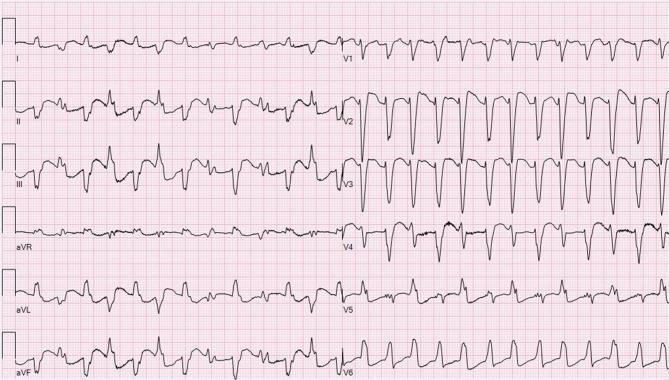
A 12-lead electrocardiogram (ECG) demonstrating a broad complex tachycardia with distinct morphological variations across the leads. In the limb leads (I, II, III, aVR, aVL, aVF) and some precordial leads (V1, V5, V6), the rhythm appears irregularly irregular with narrow to slightly widened QRS complexes and absent P waves, consistent with atrial fibrillation and possible aberrant conduction. However, in leads V2, V3, and V4, the tracing transitions into a regular, wide-complex rhythm characterized by bizarre, sharply peaked, and uniform QRS complexes with a rapid steep descent. The morphology in these specific leads is suggestive of bidirectional ventricular tachycardia or a ventricular origin. This visual comparison illustrates the transition between a supraventricular arrhythmia (atrial fibrillation) and a more organized wide-complex ventricular rhythm, potentially related to digoxin toxicity or cardiac electrophysiological instability. The educational focus is on rhythm recognition, QRS morphology analysis, and the identification of potentially life-threatening ventricular arrhythmias.
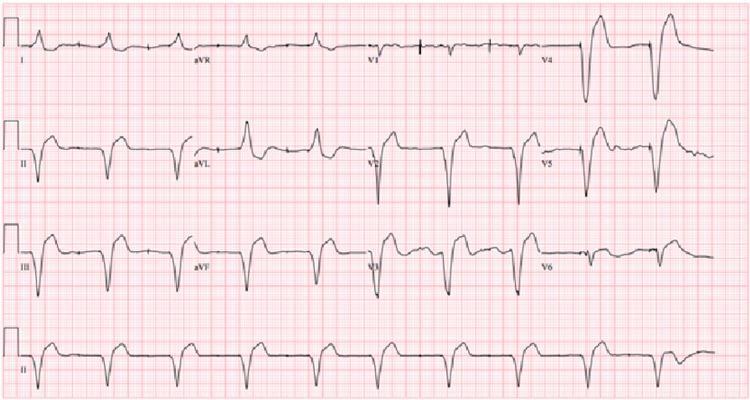
This diagnostic image is a 12-lead electrocardiogram (ECG) demonstrating a ventricular-paced rhythm. The tracing shows a consistent pattern across all leads (I-III, aVR-aVF, and V1-V6) characterized by sharp, vertical pacing artifacts (spikes) immediately preceding each QRS complex. The QRS complexes are significantly widened with a bundle branch block-like morphology, typical of ventricular depolarization originating from an artificial pacemaker electrode. In the inferior leads (II, III, aVF), the pacing spikes appear as sharp downward deflections followed by broad, slurred QRS complexes and discordant T waves. Notably, there is an absence of discernible P waves preceding the pacing spikes, indicating an underlying rhythm managed by ventricular pacing. This ECG was obtained 24 hours following treatment with Digoxin Immune Fab (DIF) for digoxin toxicity, illustrating the conversion from an unstable arrhythmia to a stable, paced rhythm in a patient with heart failure.
Digoxin and Hypokalemia
Mechanism
"Hypokalemia predisposes to digoxin toxicity by a number of mechanisms, including reduced competition between K+ and digoxin for shared binding sites on cardiac Na+/K+-ATPase subunits."
- Goldman-Cecil Medicine, p. 626
Clinical Significance
| Factor | Effect |
|---|---|
| Hypokalemia (K+ < 3.5 mEq/L) | Enhances digoxin binding → toxicity at "normal" levels |
| Hypomagnesemia (co-exists with hypokalemia) | Additional risk factor; also exacerbates Na+/K+-ATPase inhibition |
| Diuretic use | Causes both hypokalemia AND reduces digoxin clearance via dehydration |
ECG Changes in Digoxin Toxicity
- Scooped/sagging ST-segment depression
- T-wave flattening or inversion
- QT interval shortening
- Increased U-wave amplitude
- Premature ventricular contractions (most common)
- Bradycardic rhythms (heart block)
- Bidirectional ventricular tachycardia (rare but highly characteristic)
Acute vs. Chronic Toxicity
| Feature | Acute Toxicity | Chronic Toxicity |
|---|---|---|
| Typical patient | Intentional overdose | Elderly, on diuretics |
| Potassium | Hyperkalemia (generalized ATPase blockade) | Hypokalemia (predisposing factor) |
| Symptoms | Prominent GI (nausea, vomiting) | Vague - fatigue, confusion, weakness |
| Arrhythmias | Bradyarrhythmias common | Ventricular arrhythmias more frequent |
- In acute overdose: hyperkalemia develops from generalized Na+/K+-ATPase blockade and is a marker of severity. K+ >5.0 mEq/L is an indication for antidote administration.
- In chronic toxicity: hypokalemia is the predisposing factor that should be corrected.
Management of Hypokalemia in Digoxin Toxicity
- Correct hypokalemia - especially in chronic toxicity; this reduces myocardial sensitivity to digoxin
- Correct hypomagnesemia - must replete Mg2+ to successfully correct K+ (hypomagnesemia causes refractory hypokalemia)
- Target K+ >4.0 mEq/L in patients on digoxin (Morgan & Mikhail's Clinical Anesthesiology recommends plasma K+ values above 4 mEq/L in digoxin patients)
- Digoxin-specific Fab fragments (Digifab/Digibind) - treatment of choice for life-threatening toxicity; indicated for:
- Life-threatening dysrhythmias
- Severe bradycardia/heart block unresponsive to atropine
- Hyperkalemia >5.0 mEq/L in acute poisoning
- Hemodynamic instability
Drugs That Worsen the Interaction
- Loop/thiazide diuretics - cause hypokalemia directly
- Amiodarone, verapamil, diltiazem - increase serum digoxin concentrations
- Erythromycin - increases digoxin absorption by altering gut flora
- Quinidine - displaces digoxin from binding sites, increases levels
Summary
Corrected reticulocyte count
reticulocyte count correction anemia classification diagram
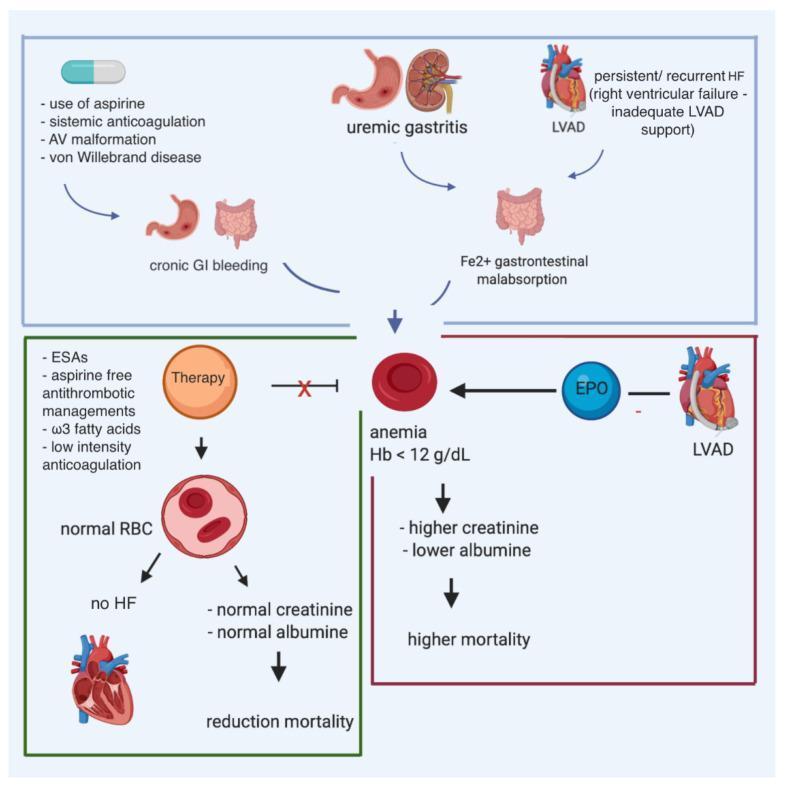
This pathophysiology diagram illustrates the multifactorial causes and consequences of anemia in patients with heart failure (HF) and a left ventricular assist device (LVAD). The top section identifies contributors to anemia, including chronic gastrointestinal (GI) bleeding secondary to aspirin use, systemic anticoagulation, arteriovenous (AV) malformations, and von Willebrand disease. Other contributing factors shown are uremic gastritis, iron (Fe2+) malabsorption, and persistent right ventricular failure. Central to the diagram is the manifestation of anemia (defined as Hemoglobin < 12 g/dL), which correlates with elevated creatinine, decreased albumin, and increased mortality. The diagram also highlights therapeutic interventions such as erythropoiesis-stimulating agents (ESAs), aspirin-free antithrombotic management, omega-3 fatty acids, and low-intensity anticoagulation. Successful therapy is depicted as leading to normal red blood cell (RBC) counts, resolution of heart failure symptoms, and reduced mortality. The role of erythropoietin (EPO) is also noted in the context of LVAD-related anemia management.
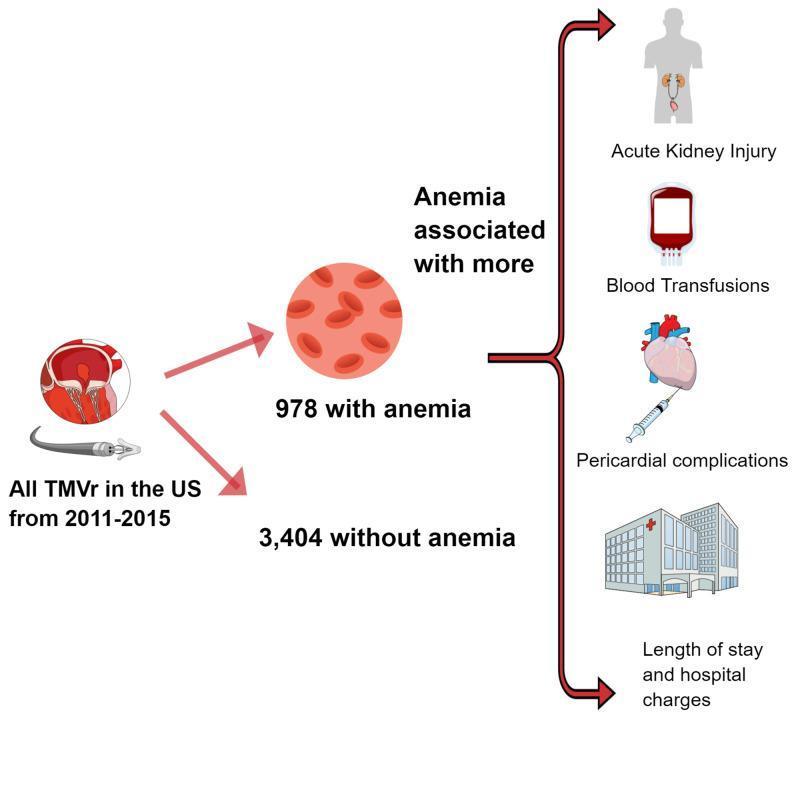
This medical infographic summarizes the clinical outcomes associated with baseline anemia in patients undergoing Transcatheter Mitral Valve Repair (TMVr). The diagram illustrates a cohort analysis of US procedures from 2011 to 2015, categorizing 4,382 total patients into two groups: 978 with anemia (represented by a red blood cell cluster) and 3,404 without anemia. A central flow arrow directs the viewer to the adverse outcomes significantly associated with the anemic group. These complications are visually depicted through icons and labels, including Acute Kidney Injury (AKI) represented by a renal system silhouette, Blood Transfusions shown with a blood bag icon, Pericardial Complications illustrated by a heart with a pericardiocentesis needle, and increased healthcare utilization (Length of Stay and Hospital Charges) represented by a hospital building icon. This clinical algorithm serves as a summary of the impact of pre-procedural anemia on postoperative morbidity and hospital resource management in cardiovascular medicine.
Corrected Reticulocyte Count
Why Correction Is Needed
Step 1 - Corrected Reticulocyte Count (CRC)
Using Hematocrit:
Using Hemoglobin:
- Goldman-Cecil Medicine, Table 144-3
Step 2 - Reticulocyte Production Index (RPI)
Maturation Factor Table
| Hematocrit | Maturation Factor (days) |
|---|---|
| 36-45% | 1.0 |
| 26-35% | 1.5 |
| 16-25% | 2.0 |
| ≤15% | 2.5 |
- Quick Compendium of Clinical Pathology, 5th ed. | Goldman-Cecil Medicine, Table 144-3
Worked Example
- Reticulocyte count: 7%
- Hct: 25%
- Shift reticulocytes visible on smear
- Henry's Clinical Diagnosis and Management by Laboratory Methods, p. 1909-1920
Interpretation of RPI
| RPI | Interpretation | Cause |
|---|---|---|
| < 2 | Hypoproliferative - inadequate marrow response | Iron deficiency, B12/folate deficiency, aplastic anemia, anemia of chronic disease, renal failure |
| 2-3 | Borderline / partially adequate | |
| > 3 | Hyperproliferative - appropriate bone marrow response | Hemolytic anemia, acute blood loss |
Absolute Reticulocyte Count
Summary Flow
Raw Retic %
    ↓ × (Patient Hct / 45)
Corrected Reticulocyte Count (CRC)
    ↓ ÷ Maturation Factor (if shift retics present)
Reticulocyte Production Index (RPI)

RPI < 2 → Hypoproliferative anemia (marrow failure/nutritional)
RPI > 3 → Hyperproliferative (hemolysis/blood loss)
Fena
FENa (Fractional Excretion of Sodium)
What It Measures
Formula
- U = urine, P = plasma (serum)
- Na = sodium, Cr = creatinine
- Comprehensive Clinical Nephrology, 7th ed. | Washington Manual of Medical Therapeutics
Interpretation
| FENa | Interpretation |
|---|---|
| < 1% | Prerenal AKI - tubules avidly reabsorbing Na (intact function) |
| 1-2% | Indeterminate zone |
| > 2-3% | Intrinsic renal AKI (ATN) - tubules damaged, cannot reabsorb Na |
- Quick Compendium of Clinical Pathology, 5th ed.
Urinary Indices Comparison Table (Prerenal vs. Intrinsic/ATN)
| Parameter | Prerenal AKI | Intrinsic (ATN) |
|---|---|---|
| FENa | < 1% | > 2% |
| FEUrea | < 35% | > 35-50% |
| Urine Na | < 15-20 mEq/L | > 40 mEq/L |
| Urine osmolality | > 500 mOsm/kg | 300-400 mOsm/kg (isosthenuria) |
| Urine specific gravity | > 1.020 | < 1.010 |
| BUN:Creatinine ratio | > 20:1 | < 20:1 |
| Urine sediment | Normal / hyaline casts | Muddy brown granular casts, tubular epithelial cells |
- Quick Compendium of Clinical Pathology, 5th ed.
Important Limitations - When FENa Misleads
False Low FENa (< 1%) DESPITE intrinsic AKI - suggests prerenal but is NOT:
| Condition | Reason |
|---|---|
| Diuretic use | Diuretics cause natriuresis - FENa is falsely elevated, not applicable |
| Contrast nephropathy | Vasoconstriction mechanism; tubular injury with low FENa |
| Myoglobinuria / rhabdomyolysis | Tubular obstruction maintains some Na reabsorption |
| Hemoglobinuria | Same mechanism as myoglobinuria |
| Early sepsis-associated AKI | FENa can be low early in course |
| Acute glomerulonephritis | Volume depletion + intact tubules = low FENa despite intrinsic disease |
| Hepatorenal syndrome | Intense Na avidity despite functional AKI |
| Advanced cirrhosis / heart failure | Neurohormonal activation drives Na retention |
False High FENa (> 2%) DESPITE prerenal - suggests ATN but is NOT:
| Condition | Reason |
|---|---|
| Diuretic use | Forced natriuresis |
| CKD with salt-wasting | Baseline tubular dysfunction |
| Bicarbonaturia | Na excreted with bicarbonate (e.g., RTA, vomiting) |
| IV saline administration | Sodium loading |
| Glycosuria | Osmotic diuresis carries Na |
"FENa has the most utility in oliguric patients who are not given diuretics." - Harrison's Principles of Internal Medicine, 22e
FEUrea - The Alternative in Diuretic Users
| FEUrea | Interpretation |
|---|---|
| < 35% | Prerenal AKI |
| > 35-50% | ATN |
- Symptom to Diagnosis, 4th ed. | Harriet Lane Handbook, 23rd ed.
Special Population - Neonates/Infants
- Harriet Lane Handbook, 23rd ed.
Bonus: FEHCOз for RTA Typing
| FEHCO₃ | Interpretation |
|---|---|
| < 5% | Normal / Distal (Type I) RTA |
| > 15% | Proximal (Type II) RTA |