
Oxygen dissociation curve
The oxygen-hemoglobin dissociation curve is a sigmoid (S-shaped) curve that plots the saturation of hemoglobin (SpO2) against the partial pressure of oxygen (PaO2). It reflects how hemoglobin loads oxygen in the lungs and unloads it in tissues. Key points: P50 (the PaO2 at 50% saturation) is normally ~26 mmHg. The curve shifts right (reduced affinity, more O2 release) with increased CO2, acidosis, fever, and 2,3-DPG. It shifts left (increased affinity, less O2 release) with alkalosis, hypothermia, fetal hemoglobin, and CO poisoning.
Searching sources...
Reading File
Finding Sources
Finding Sources
Reading File
Reading File
Reading File
Reading File
Reading File
Loading Image
Loading Image
Reading File
Loading Image
Reading File
Loading Image
Here is a thorough breakdown of the oxygen dissociation curve, compiled from Fishman's Pulmonary Diseases, Lippincott's Biochemistry, Guyton and Hall, and Mulholland's Surgery.
Oxygen Dissociation Curve
What It Represents
The oxygen dissociation curve plots the relationship between hemoglobin oxygen saturation (%) on the Y-axis and the partial pressure of oxygen (PO2, in mm Hg) on the X-axis. It describes how blood loads oxygen in the lungs and unloads it in the tissues.
The Classic Curve
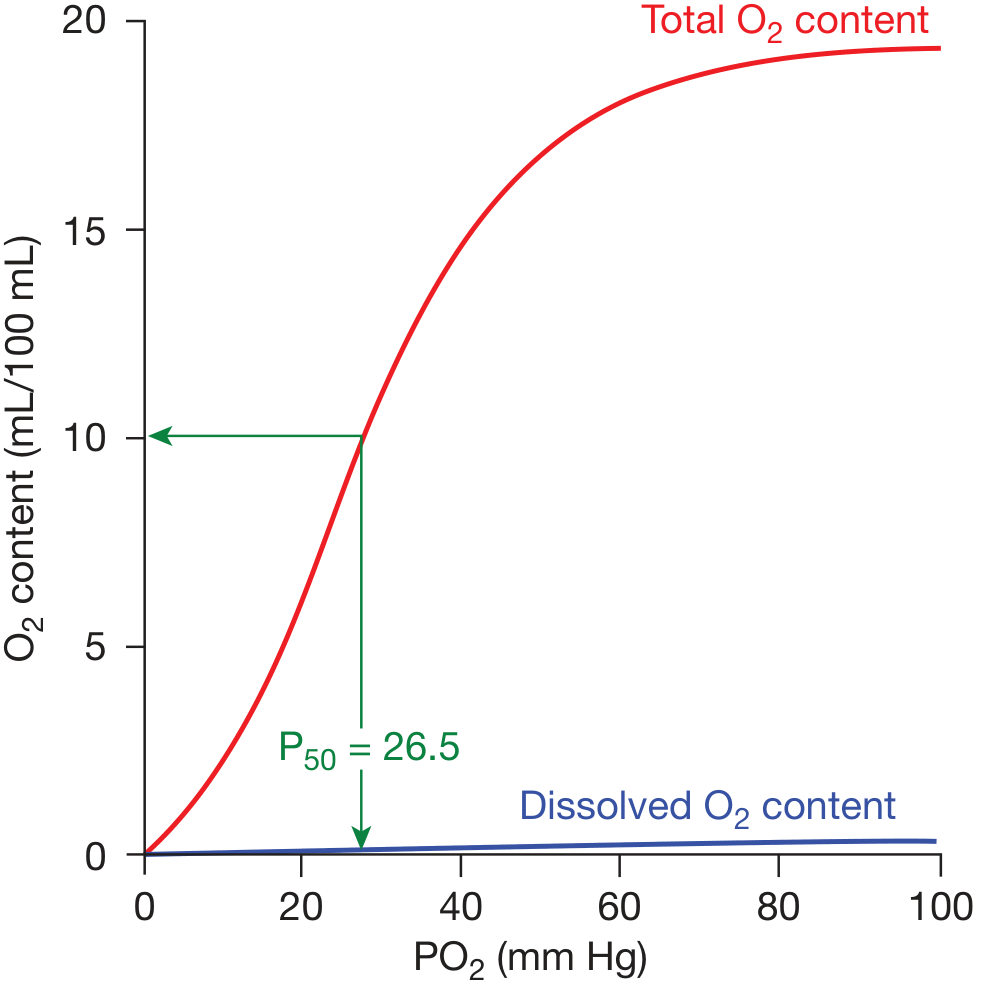
Key features:
- The curve is sigmoid (S-shaped) - not hyperbolic. This shape arises from the cooperative nature of hemoglobin's four subunits. Binding of one O2 molecule increases affinity for subsequent O2 molecules approximately 300-fold from first to last binding.
- Almost all oxygen in blood is carried bound to hemoglobin. Dissolved O2 (blue line) is a tiny fraction.
- P50 = 26.5 mm Hg - the PO2 at which hemoglobin is 50% saturated under standard conditions (pH 7.4, 37°C, PCO2 40 mm Hg).
Physiological Importance of the Sigmoid Shape
| Region of Curve | PO2 Range | Significance |
|---|---|---|
| Flat upper portion | 60-100 mm Hg | Arterial "safety zone" - saturation stays ~90%+ even if PO2 falls to 60 mm Hg from lung disease |
| Steep middle portion | 20-60 mm Hg | Tissue "unloading zone" - large amounts of O2 released with small PO2 drops |
| Venous point (rest) | ~40 mm Hg | Mixed venous blood ~75% saturated; only ~25% of O2 is extracted at rest |
A hyperbolic curve (like myoglobin) would hold O2 too tightly across this range and could not release it efficiently to tissues. - Lippincott Biochemistry, 8th ed.
Shifts in the Curve
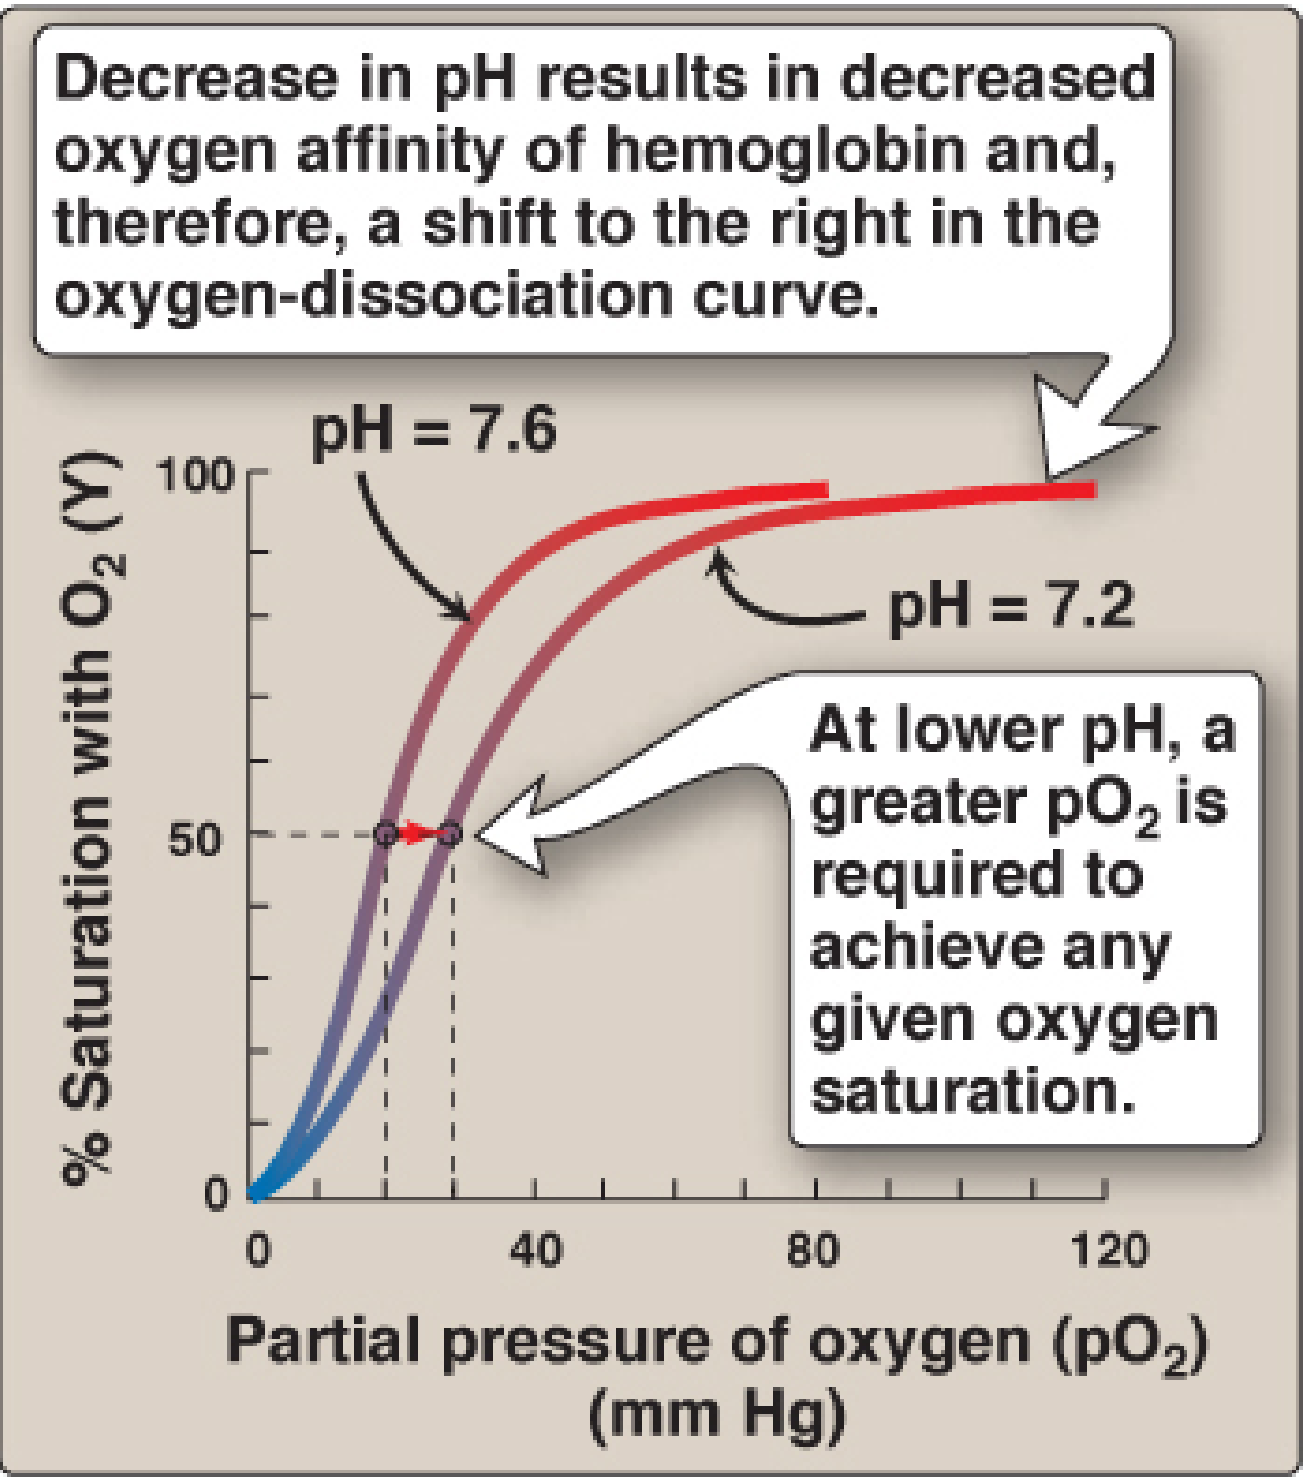
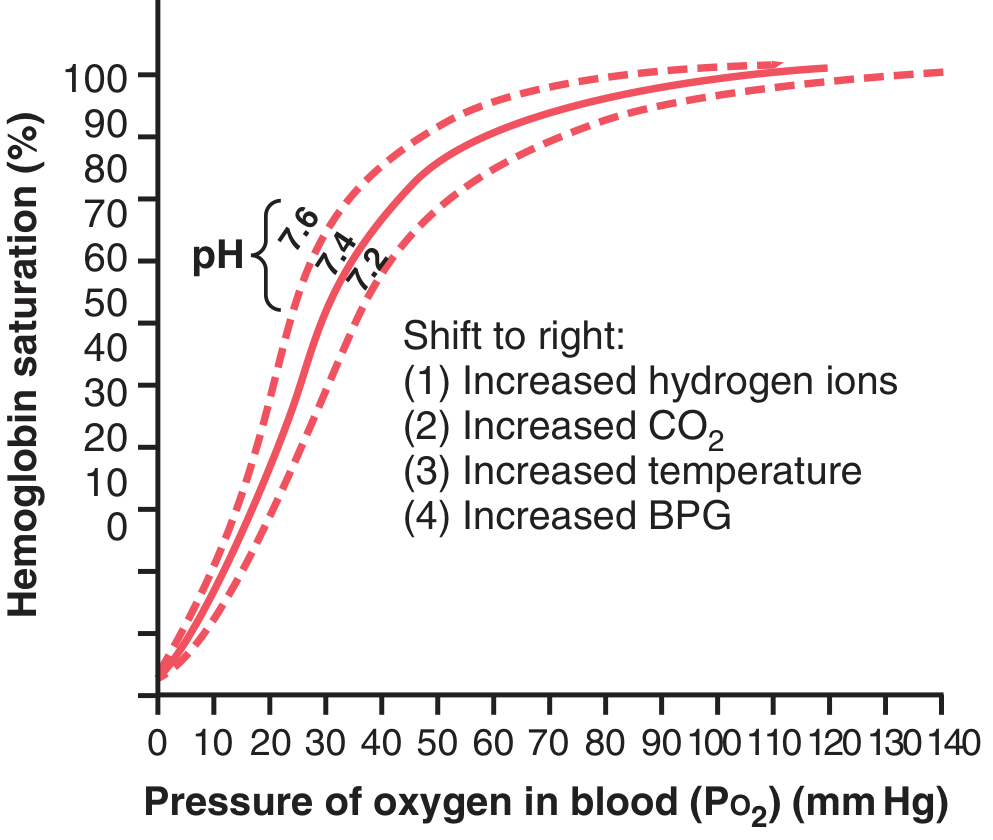
Right Shift (decreased O2 affinity - more O2 released to tissues)
| Factor | Mechanism |
|---|---|
| ↑ H+ / ↓ pH (acidosis) | Bohr effect: H+ stabilizes T (deoxy) form via ionic bonds on histidine residues |
| ↑ CO2 | Directly and via H2CO3→H+ (carbonic anhydrase); also forms carbaminohemoglobin |
| ↑ Temperature | Increased kinetic energy weakens Hb-O2 bond |
| ↑ 2,3-BPG (BPG) | Binds the central pocket of deoxyhemoglobin's β-chains, stabilizing T form |
Clinically, right shift aids O2 delivery in: exercise, fever, anemia, COPD, and high-altitude adaptation.
Left Shift (increased O2 affinity - less O2 released to tissues)
| Factor | Mechanism |
|---|---|
| ↓ H+ / ↑ pH (alkalosis) | Stabilizes R (oxy) form |
| ↓ CO2 | Opposite of Bohr effect |
| ↓ Temperature | Strengthens Hb-O2 bond |
| ↓ 2,3-BPG | Less stabilization of T form; seen in stored blood (depleted within days) |
| Fetal hemoglobin (HbF) | γ-chains have lower affinity for 2,3-BPG than β-chains → intrinsically higher O2 affinity |
| Carbon monoxide (CO) | Binds heme with 250x affinity of O2; also causes left shift via conformational change (Haldane effect) |
| High altitude (acute) | Hyperventilation → ↓ PCO2 → left shift |
(Mulholland & Greenfield Surgery, Table 10.6)
The Bohr Effect (in detail)
The Bohr effect is the mechanism by which acidosis and increased CO2 reduce Hb's O2 affinity:
HbO2 + H+ ⇌ HbH (deoxyhemoglobin) + O2
In metabolically active tissues, carbonic anhydrase converts CO2 → H2CO3 → HCO3⁻ + H⁺. The resulting H⁺ protonates specific histidine residues, forming salt bridges that stabilize deoxyhemoglobin - promoting O2 release right where it is needed. The reverse happens in the lungs where CO2 is exhaled and pH rises. - Lippincott Biochemistry, 8th ed.
2,3-BPG and Its Clinical Relevance
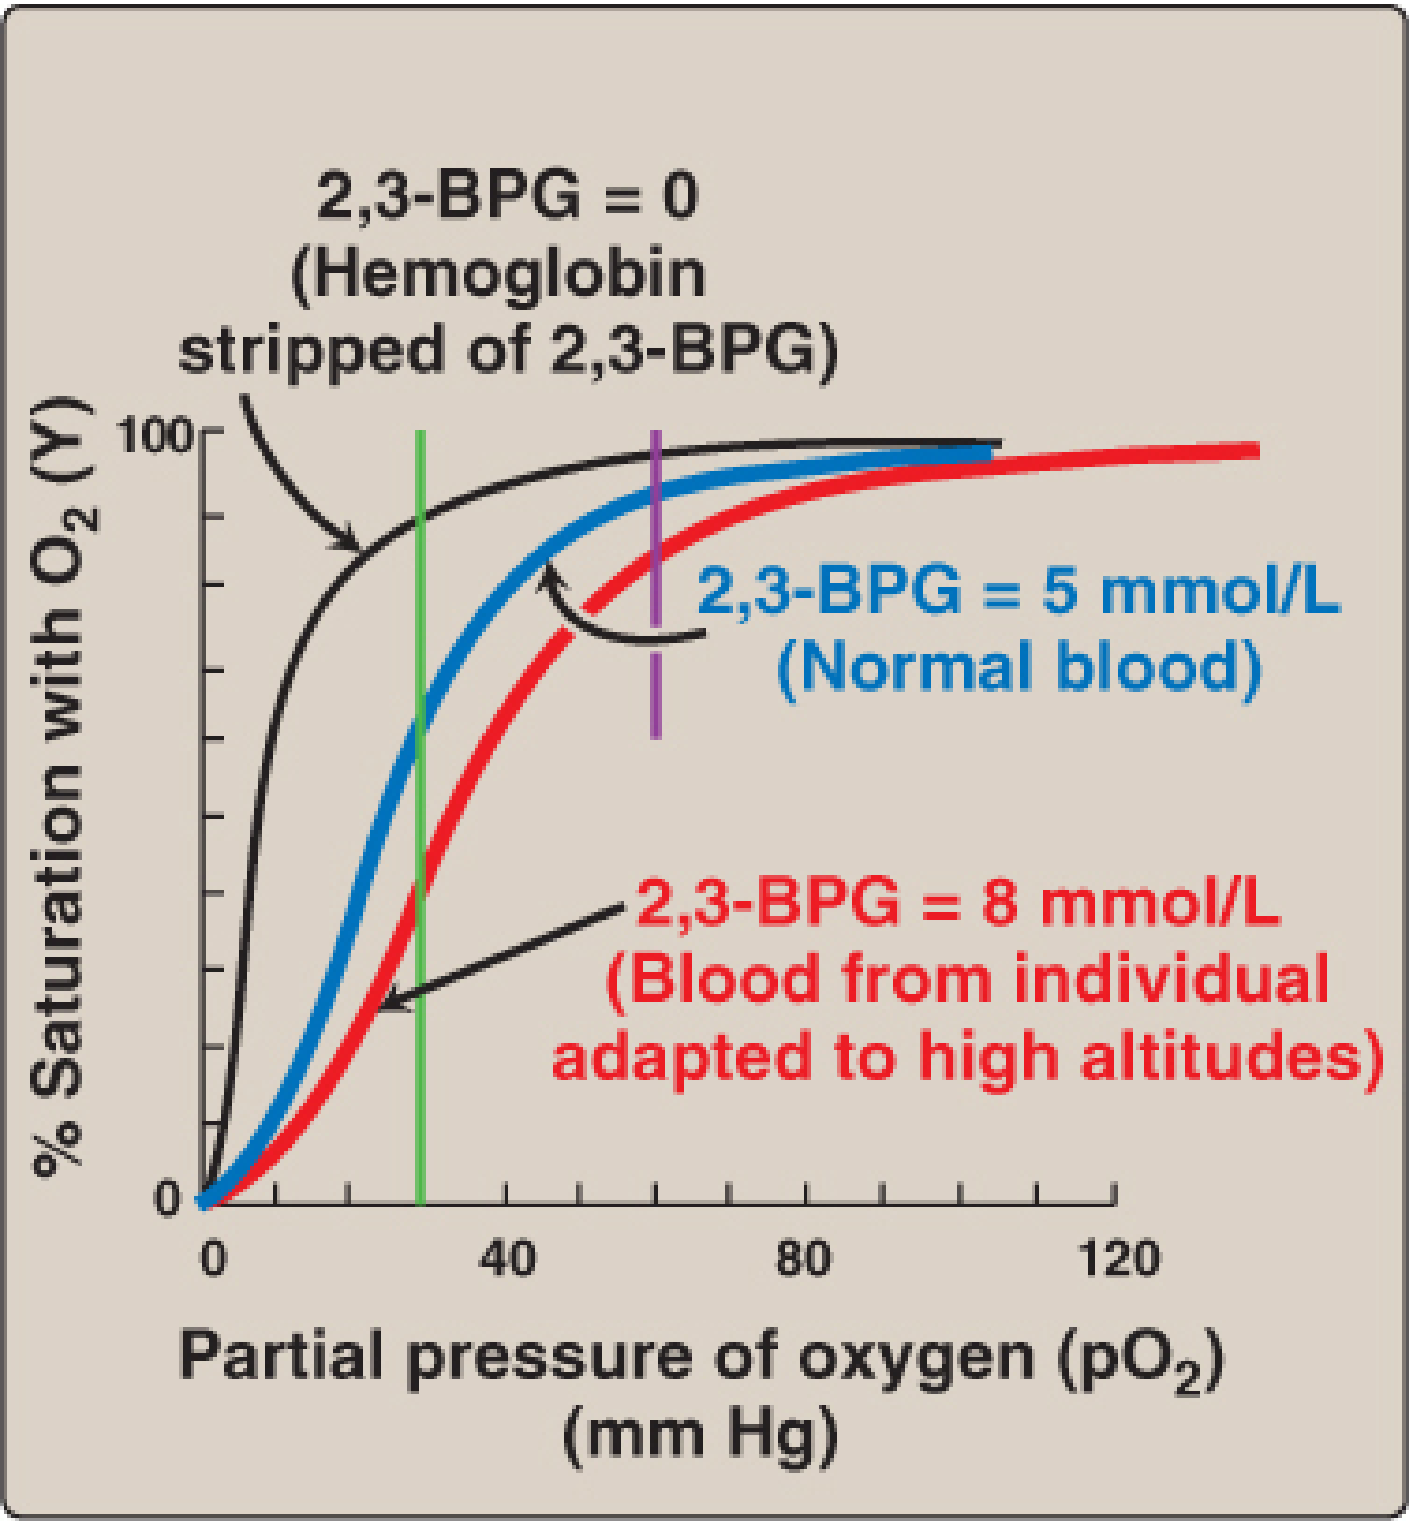
- Normal blood: ~5 mmol/L 2,3-BPG; hemoglobin at tissue PO2 (~35 mm Hg) is ~60% saturated, delivering ~40% of bound O2.
- High-altitude adaptation / chronic hypoxia / anemia: 2,3-BPG rises (up to ~8 mmol/L), shifting the curve right. This restores near-normal O2 delivery despite lower PO2 or reduced Hb concentration.
- Stored blood: 2,3-BPG is depleted over days. Transfused RBCs behave as O2 traps (fail to unload) until 2,3-BPG is regenerated over 6-24 hours. Blood banks use "rejuvenation" solutions to restore it.
- Fetal hemoglobin (HbF): The γ-subunits bind 2,3-BPG less avidly than adult β-subunits, giving HbF a left-shifted curve - essential for the fetus to extract O2 from maternal blood across the placenta.
Summary Table
| Condition | Curve Shift | P50 | Clinical Implication |
|---|---|---|---|
| Acidosis, ↑CO2, fever, ↑2,3-BPG | Right | ↑ | Better O2 delivery to active tissues |
| Alkalosis, ↓CO2, hypothermia, ↓2,3-BPG | Left | ↓ | O2 held by Hb; less tissue delivery |
| CO poisoning | Left | ↓ | Tissue hypoxia despite normal PO2 |
| HbF | Left | ↓ | Fetal O2 extraction from maternal blood |
| Anemia / high altitude (chronic) | Right (compensatory) | ↑ | Adaptation via ↑2,3-BPG |
| Stored blood transfusion | Left (initially) | ↓ | Transient impairment of O2 unloading |
Sources: Fishman's Pulmonary Diseases and Disorders; Lippincott Illustrated Reviews Biochemistry 8th ed.; Guyton and Hall Medical Physiology; Mulholland and Greenfield's Surgery 7th ed.
This is a shared conversation. Sign in to Orris to start your own chat.