
Ecg
Asking for Preferences
What would you like to know about ECG?
ECG basics cover the electrical activity of the heart as recorded from body surface leads, with each wave, interval, and segment reflecting a specific phase of the cardiac cycle. The standard 12-lead ECG includes limb leads (I, II, III, aVR, aVL, aVF) and precordial leads (V1-V6).
Searching sources...
Reading File
Finding Sources
Finding Sources
Reading File
Finding Sources
Finding Sources
Finding Sources
Reading File
Reading File
Reading File
Reading File
Loading Image
Loading Image
Loading Image
Reading File
Here is a thorough guide to ECG basics and interpretation, drawn from Harrison's Principles of Internal Medicine, Braunwald's Heart Disease, Ganong's Medical Physiology, and Medical Physiology.
ECG Basics & Interpretation
What is an ECG?
An ECG (electrocardiogram) records the time-dependent electrical vectors of the heart from body surface electrodes. It gives direct information about rate, rhythm, the origin of the cardiac action potential, and its conduction through the heart. - Harrison's Principles of Internal Medicine 22E, p. 1912
The ECG Paper
- Vertical axis: amplitude - calibrated at 0.1 mV per mm
- Horizontal axis: time
- 1 small box = 1 mm = 0.04 seconds
- 1 large box = 5 mm = 0.20 seconds
- 5 large boxes = 1.0 second
The 12 Leads
A standard ECG uses 12 leads, each viewing the heart from a different angle:
Limb leads (frontal plane):
- Bipolar: I, II, III (Einthoven triangle)
- Augmented unipolar: aVR, aVL, aVF
Precordial leads (horizontal/transverse plane):
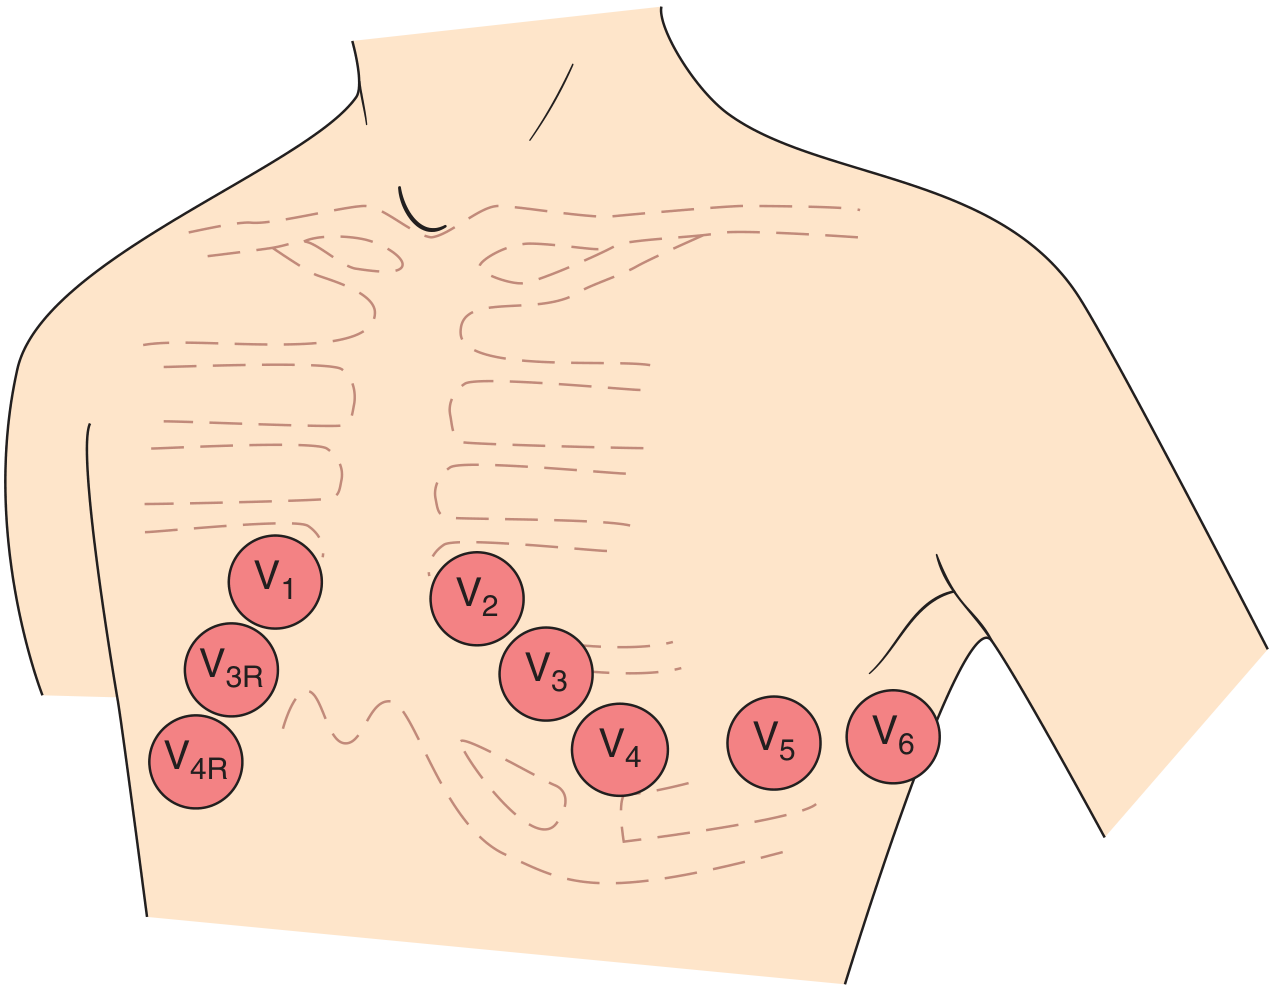
- V1: 4th intercostal space, right sternal border
- V2: 4th intercostal space, left sternal border
- V3: Between V2 and V4
- V4: 5th intercostal space, midclavicular line
- V5: Anterior axillary line
- V6: Midaxillary line
The Waves, Intervals & Segments
| Component | What it Represents | Normal Value |
|---|---|---|
| P wave | Atrial depolarization (SA node → atria) | Duration < 120 ms; positive in II, negative in aVR |
| PR interval | AV node conduction time (P onset to QRS onset) | 120-200 ms |
| QRS complex | Ventricular depolarization | Duration < 120 ms |
| ST segment | Ventricular plateau (early repolarization) | Isoelectric (no deviation) |
| T wave | Ventricular repolarization | Upright in most leads |
| QT interval | Total ventricular electrical systole | Varies with rate; QTc < 440-450 ms |
- Medical Physiology, p. 731
Step 1: Calculate the Heart Rate
Quick method: Count the large boxes between two R waves and use:
Rate = 300 ÷ (number of large boxes between R-R)
| R-R (large boxes) | Rate (bpm) |
|---|---|
| 1 | 300 |
| 2 | 150 |
| 3 | 100 |
| 4 | 75 |
| 5 | 60 |
| 6 | 50 |
Normal sinus rate: 60-100 bpm
Step 2: Assess the Rhythm
Ask four questions:
- Is there a P wave before every QRS?
- Is the PR interval constant?
- Are the R-R intervals regular?
- Is the P wave upright in lead II and inverted in aVR? (confirms sinus origin)
Normal sinus rhythm = SA node pacemaker, regular rate 60-100 bpm, P wave positive in II/negative in aVR, constant PR interval.
Step 3: Assess the P Wave
- Normal: positive in II, biphasic in V1 (small positive then small negative component)
- Negative in II + positive in aVR = ectopic/retrograde atrial activation
- Tall, peaked P in II = right atrial enlargement ("P pulmonale")
- Broad, notched P in II + prominent negative terminal component in V1 = left atrial abnormality ("P mitrale")
Step 4: Measure the PR Interval
- Short PR (< 120 ms): pre-excitation (WPW), junctional rhythm
- Long PR (> 200 ms): first-degree AV block
- Progressive lengthening then dropped beat: Wenckebach (2nd degree type I)
- Fixed dropped beats: Mobitz II / complete heart block
Step 5: Analyze the QRS Complex
The QRS reflects two sequential phases of ventricular depolarization:
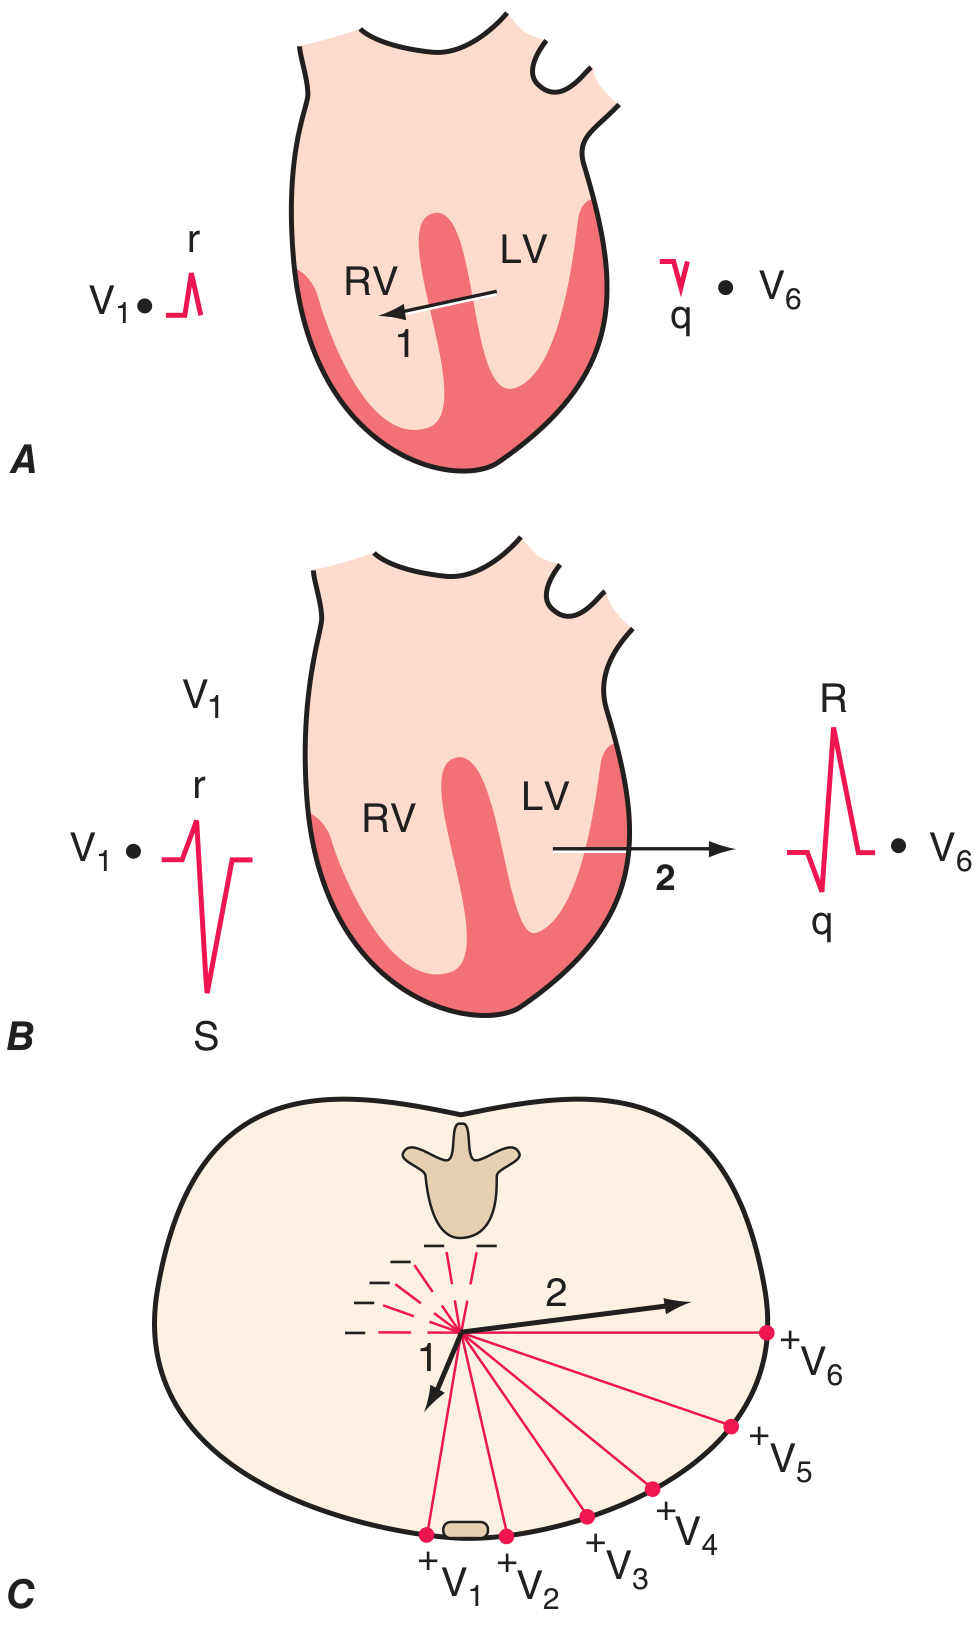
- Phase 1: Septal depolarization - left to right → small r in V1, small q in V6
- Phase 2: LV dominates, vector left and posterior → large S in V1, tall R in V6
Normal QRS duration: < 120 ms. If > 120 ms, think bundle branch block or pre-excitation.
R-wave progression: R wave should increase in amplitude from V1 to V5. Poor R-wave progression suggests anterior infarction or LVH.
Step 6: Determine the QRS Axis
Normal axis: -30° to +90°
Quick method using leads I and aVF:
| Lead I | aVF | Axis |
|---|---|---|
| + | + | Normal (0 to +90°) |
| + | - | Left axis deviation (<-30°) |
| - | + | Right axis deviation (>+90°) |
| - | - | Extreme axis (northwest) |
Left axis deviation: LBBB, left anterior fascicular block, inferior MI, LVH
Right axis deviation: RBBB, left posterior fascicular block, RVH, pulmonary embolism
Step 7: Assess the ST Segment & T Wave
- ST elevation: transmural ischemia/STEMI (current of injury - epicardial), pericarditis (diffuse), normal variant (early repolarization)
- ST depression: subendocardial ischemia/NSTEMI, digoxin effect, LVH strain
- T wave inversion: ischemia, ventricular hypertrophy, bundle branch block, Wellens syndrome
- Tall, peaked T waves: hyperkalemia, hyperacute MI
Step 8: Measure the QT Interval
The QT shortens at faster heart rates. Use the corrected QT (QTc):
Bazett's formula: QTc = QT ÷ √(R-R in seconds)
- QTc > 450 ms (men) / > 460 ms (women) = prolonged
- Prolonged QTc risks Torsades de Pointes (polymorphic VT)
A Normal 12-Lead ECG
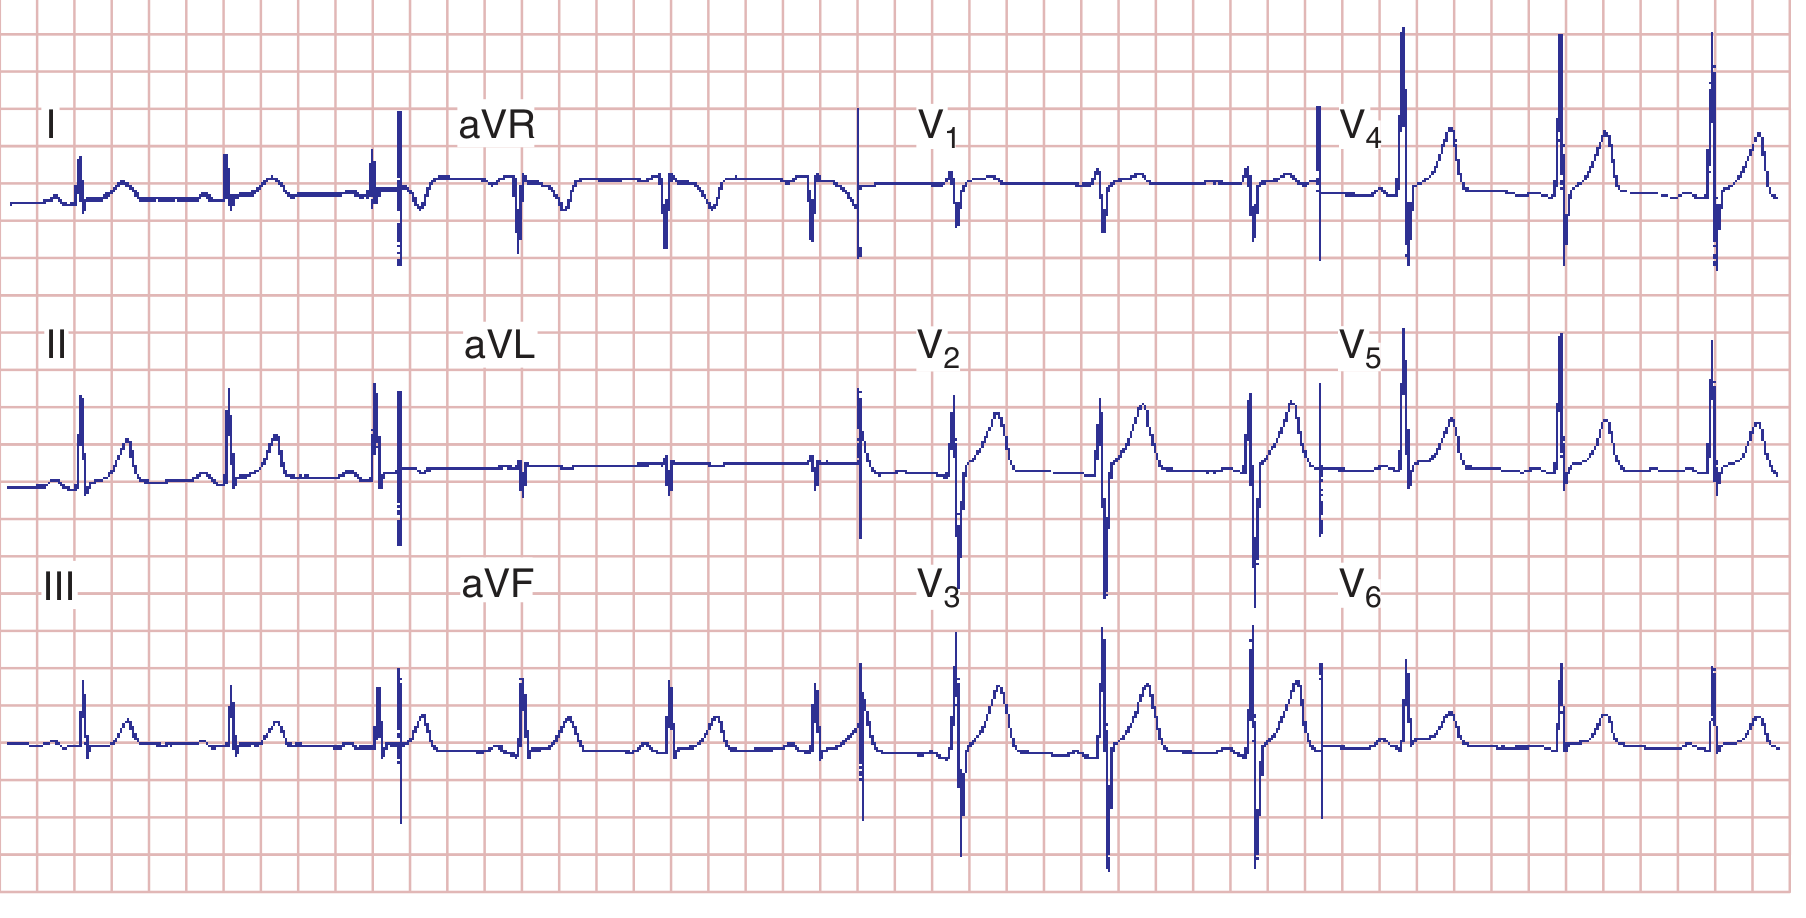
Normal ECG: sinus rhythm, HR 75 bpm, PR 160 ms, QRS 80 ms, QT 360 ms, QTc ~390 ms, mean QRS axis +70°. Normal R-wave progression with transition zone in V3-V4. - Harrison's, p. 1913
Systematic Approach Summary (8-Step Checklist)
- Rate - calculate from R-R interval
- Rhythm - sinus vs. non-sinus; regular vs. irregular
- P wave - morphology, axis, duration
- PR interval - normal, short, or prolonged
- QRS duration - narrow (<120 ms) vs. wide (>120 ms)
- QRS axis - normal, LAD, or RAD
- ST-T changes - elevation, depression, inversion
- QT interval - calculate QTc
Want me to go deeper into any specific area - arrhythmias, bundle branch blocks, STEMI localization, or a specific pattern?
This is a shared conversation. Sign in to Orris to start your own chat.