
STEMI Equivalents
STEMI equivalent ECG patterns De Winter Wellens posterior MI Sgarbossa
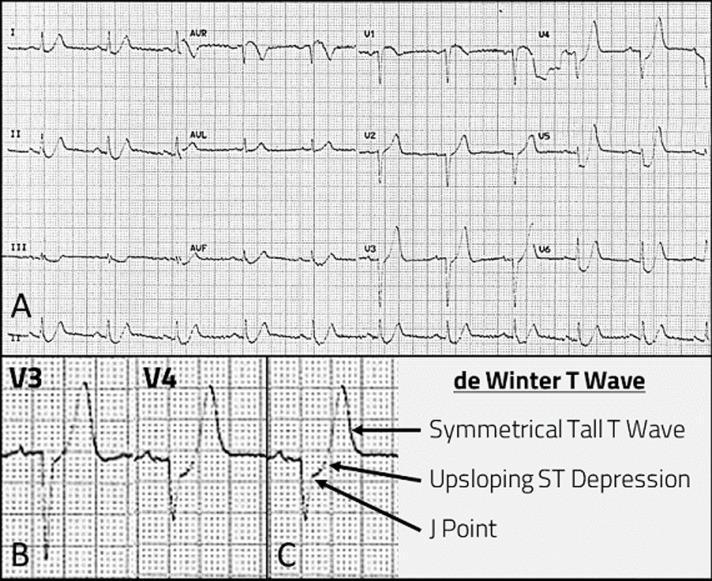
This diagnostic image displays a three-panel montage of a 12-lead electrocardiogram (ECG) demonstrating the 'de Winter T-wave' pattern, a classic STEMI-equivalent sign indicative of proximal left anterior descending (LAD) coronary artery occlusion. Panel A shows a standard 12-lead ECG tracing during an episode of acute chest pain, highlighting abnormalities in the precordial leads. Panels B and C provide magnified views and annotations of leads V3 and V4 to illustrate specific diagnostic criteria. Key features identified include: 1) J-point depression of 1-3 mm, 2) an upsloping ST-segment depression that transitions directly into 3) tall, prominent, and symmetrical T-waves. These findings are most prominent in the precordial leads (V1-V6). The educational focus is on the recognition of high-risk ischemic ECG patterns that do not manifest as classic ST-segment elevation but represent acute myocardial infarction. This resource is intended for emergency medicine and cardiology learners to differentiate de Winter T-waves from other causes of tall T-waves, such as hyperkalemia.
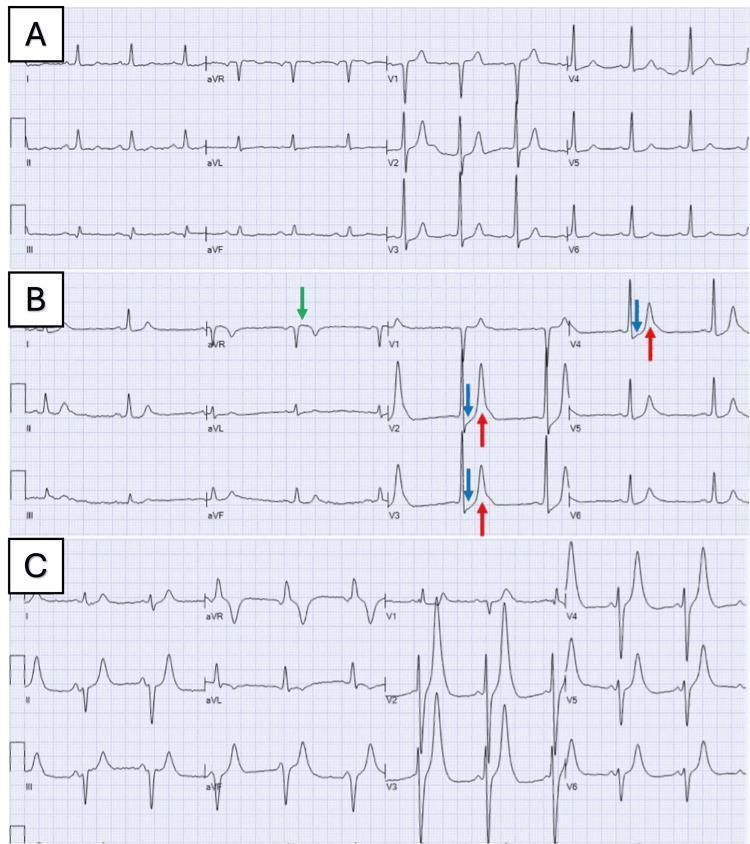
This diagnostic image consists of three sequential 12-lead electrocardiograms (ECGs) labeled A, B, and C, illustrating the dynamic evolution of the de Winter ECG pattern. Panel A serves as a baseline showing sinus rhythm. Panels B and C demonstrate the diagnostic progression of this ST-elevation myocardial infarction (STEMI) equivalent. Key features highlighted with colored arrows in panel B include: upsloping ST-segment depression (>1 mm) at the J-point in the precordial leads V2-V4 (blue arrows), tall, prominent, and symmetrical 'hyperacute' T-waves in leads V2-V5 (red arrows), and reciprocal ST-segment elevation in lead aVR (green arrow). The sequences illustrate the classic absence of typical ST-segment elevation in the precordial leads despite proximal left anterior descending (LAD) artery occlusion. This series is an essential educational tool for identifying rare but critical patterns of acute myocardial ischemia and differentiating them from benign early repolarization or hyperkalemia.
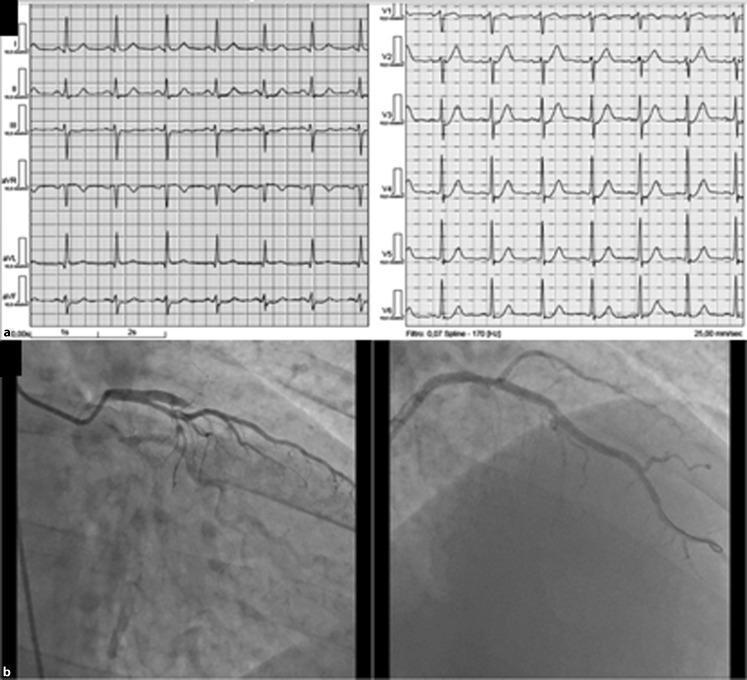
This composite educational image illustrates the correlation between electrocardiographic (ECG) findings and coronary angiography in a patient with acute coronary syndrome. Top: A 12-lead ECG demonstrating the 'modified de Winter' pattern, characterized by 1mm upsloping ST-segment depression at the J point most prominently in leads V3 through V6. This specific pattern is a rare electrocardiographic equivalent of ST-elevation myocardial infarction (STEMI) signaling proximal left anterior descending (LAD) artery occlusion. Bottom: Two coronary angiographic frames (a, left; b, right). The left angiogram shows a 'kissing ostium' variant and a total occlusion of the proximal LAD artery. The right angiogram demonstrates the post-intervention state following primary percutaneous transluminal coronary angioplasty (PTCA), showing successful re-cannulation and stenting of the LAD with restored distal flow. The image provides significant clinical teaching value for identifying non-traditional patterns of acute myocardial ischemia and documenting the efficacy of emergency coronary intervention.
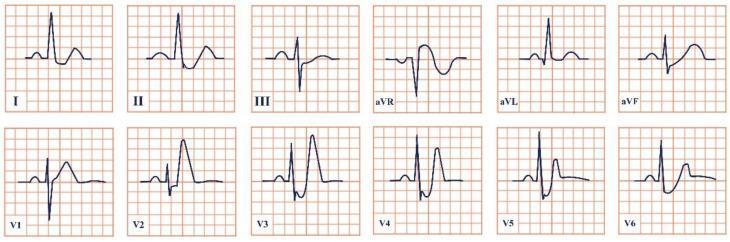
This diagnostic image displays a 12-lead electrocardiogram (ECG) snippet illustrating de Winter syndrome, a critical sign of acute proximal left anterior descending (LAD) artery occlusion. The precordial leads (V1–V6) demonstrate characteristic upsloping ST-segment depression at the J-point, transitioning into tall, prominent, and symmetrical 'hyperacute' T waves. This pattern is most pronounced in leads V2 through V4. Additionally, lead aVR exhibits a mild ST-segment elevation, which is a key diagnostic feature of this syndrome. The limb leads (I, II, III, aVL, aVF) show varied QRS morphologies, with predominantly positive deflections in I, II, aVL, and aVF, and a negative deflection in aVR. This ECG pattern is clinically significant as an ST-elevation myocardial infarction (STEMI) equivalent, indicating total or subtotal coronary occlusion despite the absence of classic ST-segment elevation in the precordial leads. The image serves as an educational tool for recognizing atypical ischemia patterns in emergency cardiology.
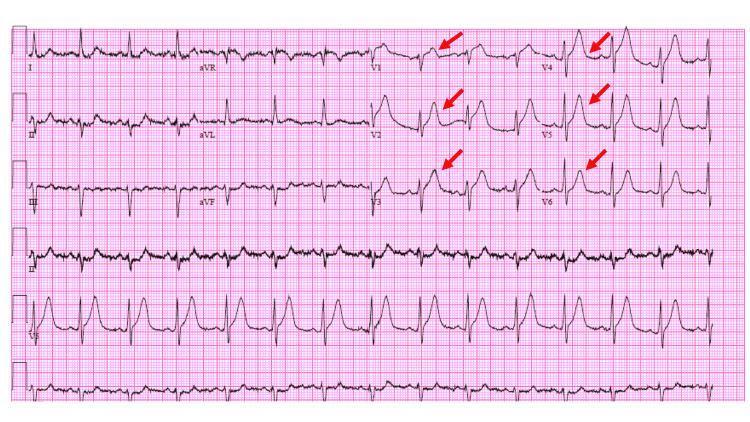
This diagnostic image is a 12-lead electrocardiogram (ECG) demonstrating the 'de Winter' T-wave pattern, a critical STEMI-equivalent signifying acute proximal left anterior descending (LAD) coronary artery occlusion. The primary findings are concentrated in the precordial leads (V1-V6), characterized by upsloping ST-segment depression at the J-point that transitions into tall, prominent, and symmetrical T-waves. Red arrows specifically highlight these hyperacute T-wave morphologies. In contrast, the limb leads (I, II, III, aVL, aVF) show relatively normal ST-T configurations, although lead aVR displays a minor ST-segment elevation (<0.5 mm). The ECG rhythm appears to be sinus tachycardia. This pattern is clinically significant as it indicates a high risk of extensive anterior wall myocardial infarction despite the absence of classic ST-elevation. This visual resource is essential for medical students and clinicians to recognize atypical presentations of acute coronary syndrome.
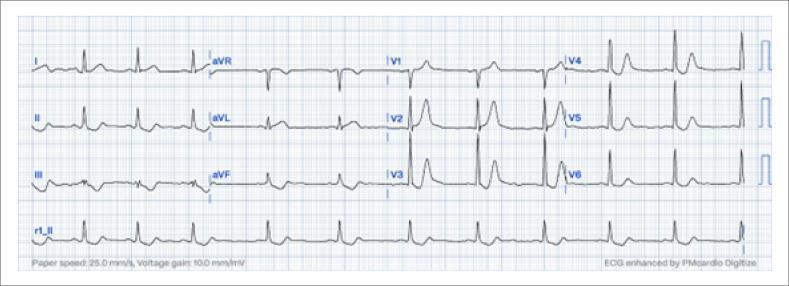
This diagnostic image is a 12-lead electrocardiogram (ECG) recorded at 25 mm/s and 10 mm/mV, demonstrating the De Winter pattern, a critical sign of acute Occlusion Myocardial Infarction (OMI) involving the Left Anterior Descending (LAD) artery. The tracing highlights characteristic precordial lead findings from V1 through V6. Key visual features include a significant ST-segment depression at the J-point (at least 1 mm), which immediately transitions into a tall, symmetrical, positive hyperacute T wave with an upsloping ST segment. Additionally, slight ST-segment elevation is visible in lead aVR, which often accompanies this pattern. This ECG morphology is a high-specificity equivalent to an ST-Elevation Myocardial Infarction (STEMI), signifying acute proximal LAD occlusion despite the lack of classic ST-elevation in the precordial leads. This educational material is intended for cardiology and emergency medicine training to improve the rapid identification of subtle ischemic signs that necessitate urgent reperfusion therapy.
Wellens syndrome ECG biphasic T-wave deep symmetric T-wave inversion LAD stenosis
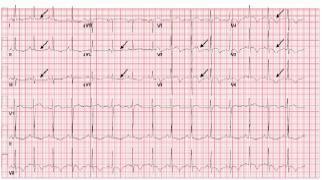
This diagnostic image is a 12-lead electrocardiogram (ECG) printed on standard red-grid paper, demonstrating significant repolarization abnormalities. The tracing shows a normal sinus rhythm with specific T-wave morphology changes annotated by black arrows. Key findings include: deep, symmetric T-wave inversions in the lateral precordial leads (V4, V5, and V6); biphasic T-waves in leads V2 and V3; and T-wave flattening or subtle inversion in the limb leads (I, aVL, II, III, and aVF). These visual patterns, particularly the deep symmetric precordial T-wave inversions and biphasic morphologies in the absence of significant ST-segment elevation, are classic indicators of Wellens' syndrome or myocardial ischemia related to proximal left anterior descending (LAD) coronary artery stenosis. The ECG serves as a critical educational tool for identifying high-risk coronary syndromes and distinguishing ischemic T-wave changes from non-specific repolarization variants.
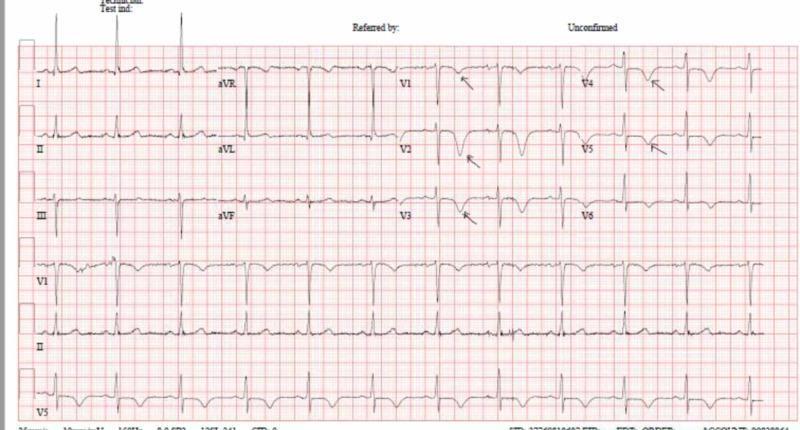
This diagnostic image is a 12-lead electrocardiogram (ECG) demonstrating classic features of Wellens syndrome (Type B pattern). The primary finding is deep, symmetric T-wave inversion across the precordial leads V1 through V6. Black arrows in leads V1 to V5 highlight the sharply pointed, inverted T-waves. Similar T-wave inversion is also present in lead aVL, suggesting high lateral involvement. The ST segments remain relatively isoelectric without significant elevation or depression, and there is a preserved R-wave progression. These findings in the context of a patient who is currently pain-free or experiencing subsiding chest pain are highly indicative of critical proximal left anterior descending (LAD) coronary artery stenosis. This ECG serves as an important educational example for distinguishing pre-infarction states from non-specific ST-T wave changes, emphasizing the clinical significance of symmetric T-wave morphology in the precordial leads for identifying high-risk cardiovascular patients.
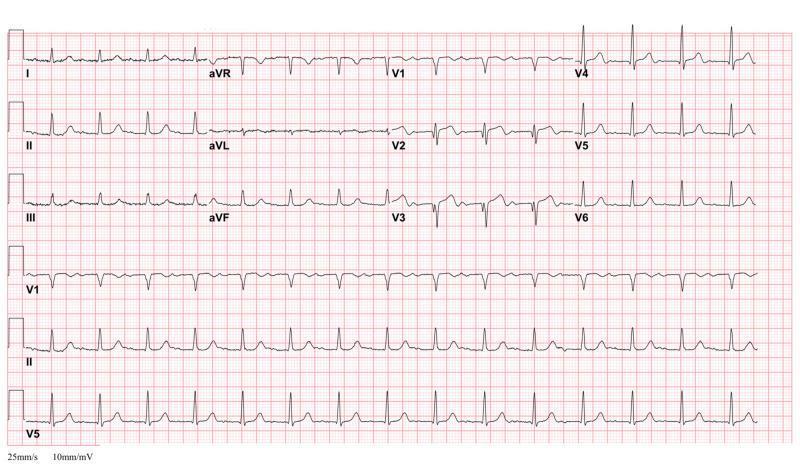
A 12-lead electrocardiogram (ECG) demonstrating the classic 'Type A' Wellens' Syndrome pattern. The recording shows a regular rhythm with normal QRS complexes; however, there is a pathognomonic T-wave morphology in the precordial leads, specifically V2 and V3. These leads exhibit biphasic T-waves characterized by an initial shallow positive deflection followed by a deep, terminal negative deflection. The terminal inversion is more prominent in amplitude than the initial upward phase. Such findings in the context of clinical stability are highly specific for critical stenosis of the proximal left anterior descending (LAD) coronary artery. The ECG also includes standard limb leads (I, II, III), augmented limb leads (aVR, aVL, aVF), and the full precordial series (V1-V6), with rhythm strips for V1, II, and V5 at the bottom. The paper speed is noted at 25mm/s with a sensitivity of 10mm/mV, providing a standard diagnostic reference for ischemic heart disease and acute coronary syndrome (ACS) evaluation.
posterior STEMI ECG ST depression V1-V3 posterior leads V7 V8 V9
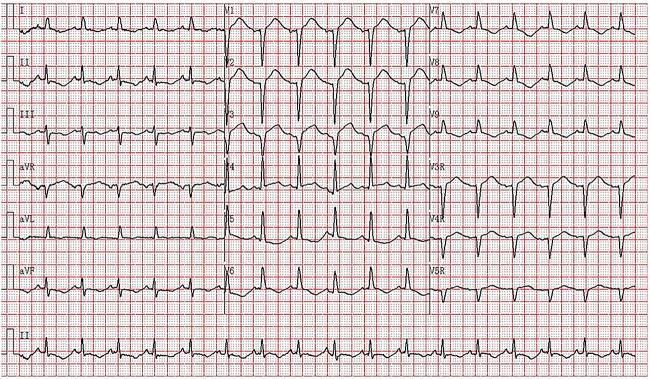
A 12-lead electrocardiogram (ECG) with additional posterior and right-sided leads (V7-V9 and V3R-V5R) displaying sinus tachycardia at approximately 103 bpm. The tracing exhibits significant ST-segment and T-wave abnormalities. Key findings include ST-segment elevation in the anterior precordial leads V1-V4, with a predominantly negative (r)QS morphology in V1-V3. Concurrently, there is evidence of ST-segment depression and deep T-wave inversion in the inferior leads (II, III, aVF) and the lateral/posterior leads (V5-V9). The QRS complexes in the lateral leads V5-V6 appear wide with associated repolarization changes. These visual features are characteristic of acute myocardial injury or ischemia patterns, such as those seen in ST-elevation myocardial infarction (STEMI) or catecholamine-induced cardiomyopathy. The tracing is presented on standard grid paper for clinical diagnostic evaluation of cardiac rhythm and morphology.
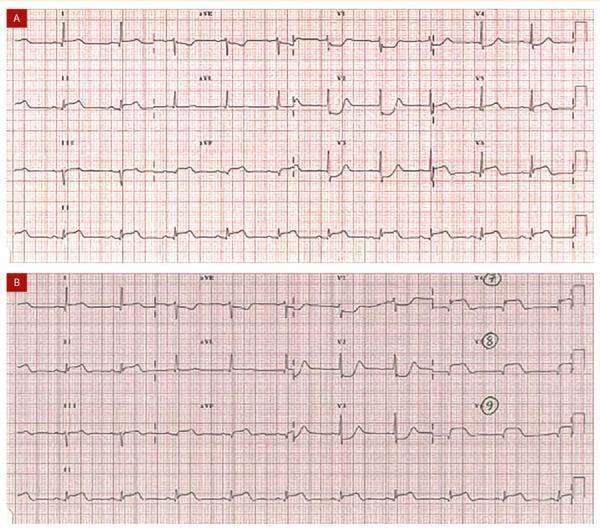
This diagnostic image consists of two electrocardiograms (ECGs) labeled A and B, demonstrating findings indicative of an inferobasal (posterior) myocardial infarction. Image A is a standard 12-lead ECG showing significant ST-segment elevation in the inferior leads (DII, DIII, and aVF). Simultaneously, mirror-image (reciprocal) changes are visible in the precordial leads V1-V3, characterized by horizontal ST-segment depression, prominent R waves with an R/S ratio > 1 in V2, and upright T waves. Image B displays a modified lead placement including posterior leads V7, V8, and V9. In this tracing, the posterior leads (specifically V8 and V9) reveal direct ST-segment elevation, confirming the posterior wall involvement that was suggested by the reciprocal changes in the standard precordial leads of Image A. The comparison illustrates the clinical importance of utilizing posterior leads when anterior ST depression is present to identify a 'hidden' posterior STEMI. This content is relevant for cardiology training and emergency medicine, focusing on acute coronary syndrome diagnostics.
aVR ST elevation left main coronary artery occlusion ECG
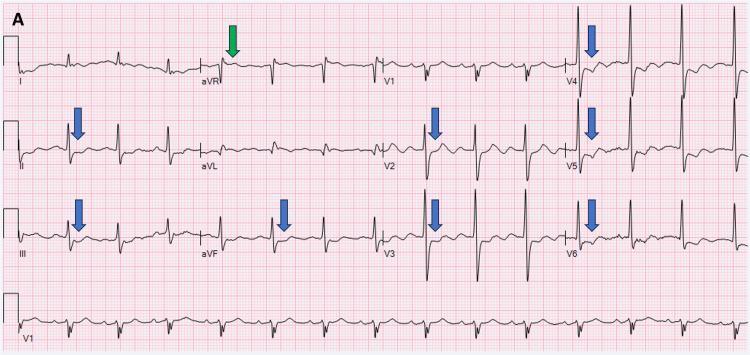
A 12-lead diagnostic electrocardiogram (ECG) demonstrating a critical pattern of diffuse myocardial ischemia. The tracing shows marked ST-segment elevation in lead aVR (indicated by a green arrow), which is a significant indicator of potential left main coronary artery (LMCA) occlusion or triple-vessel disease. This is accompanied by widespread, horizontal to down-sloping ST-segment depression (indicated by blue arrows) across multiple lead groups, specifically in the inferior leads (II, III, aVF) and the anterolateral leads (I, aVL, V2, V3, V4, V5, V6). Lead V1 remains relatively neutral compared to the other leads. The rhythm appears to be atrial fibrillation, characterized by an irregularly irregular rhythm and the absence of clear P-waves. This visual pattern is classically associated with severe subendocardial ischemia or global myocardial oxygen supply-demand mismatch, often seen in acute coronary syndrome. The image serves as a high-level educational resource for identifying high-risk ECG signatures that require urgent cardiovascular intervention.
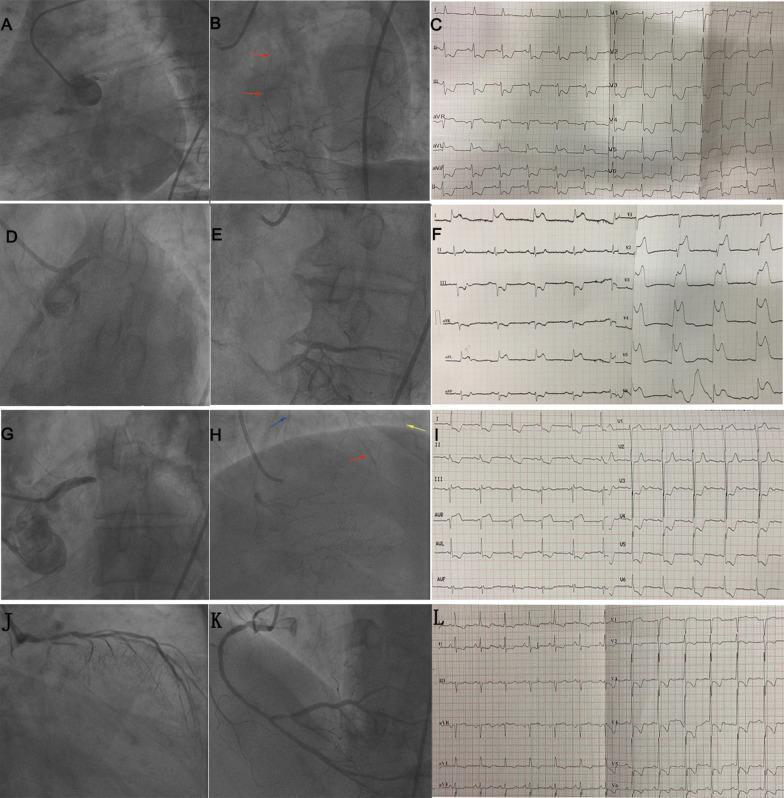
This composite clinical figure presents a comparative study of four patients with unprotected left main (ULM) coronary artery occlusion, utilizing coronary angiograms and 12-lead electrocardiograms (ECGs). The visual content is organized into four rows (A-C, D-F, G-I, and J-L), each illustrating a specific clinical scenario. Rows A-C and G-I demonstrate cases with retrograde collateral circulation filling the left anterior descending (LAD) and left circumflex (LCX) arteries (indicated by colored arrows in angiograms B and H), correlating with ST-segment elevation (STE) in lead aVR and sometimes aVL (ECGs C and I). In contrast, rows D-F and J-L depict cases with absent collateral circulation. In the absence of collaterals, total ULM occlusion (E) presents as a STEMI pattern with extensive STE in precordial (V1-V6) and lateral leads (ECG F). Subtotal ULM obstruction without collaterals (K) displays STE specifically in leads aVR and V1 (ECG L). This diagnostic comparison highlights the critical relationship between collateral flow presence, coronary anatomy, and specific ST-segment elevation patterns in the setting of high-risk coronary artery disease.
STEMI Equivalents
1. Posterior MI (Posterior STEMI)
- Horizontal ST depression ≥0.5 mm in V1-V3 (reciprocal of posterior STE)
- Tall R waves and upright T waves in V1-V2 (reciprocal of posterior Q waves)
- Confirm with posterior leads V7-V9: ST elevation ≥0.5 mm is diagnostic
2. Wellens Syndrome
| Feature | Type A (25%) | Type B (75%) |
|---|---|---|
| T-wave morphology | Biphasic (initial positive, terminal negative) | Deep, symmetric inversion |
| Location | V2-V3 (often extending to V1, V4-V6) | V2-V3 (often extending to V1, V4-V6) |
| Risk | High | High |
- History of episodic chest pain (unstable angina pattern)
- ECG abnormality seen when pain-free (abnormal T waves appear during pain-free interval)
- No pathologic Q waves or R-wave loss
- Normal or minimally elevated ST segments
- Normal or minimally elevated cardiac biomarkers
- Do NOT stress-test these patients - risk of precipitating complete occlusion
3. De Winter Pattern (De Winter Syndrome)
- J-point depression of 1-3 mm in precordial leads V1-V6
- Upsloping ST depression transitioning into tall, prominent, symmetric T-waves
- ST elevation in aVR (accompanies this pattern)
- No ST elevation in the precordial leads
4. Hyperacute T-waves
- Broad, tall, peaked T-waves - disproportionately large relative to QRS
- Symmetric morphology
- Typically in the territory of the affected artery (anterior, inferior, or lateral)
- Short-lived: progresses to ST elevation within minutes to ~30 minutes
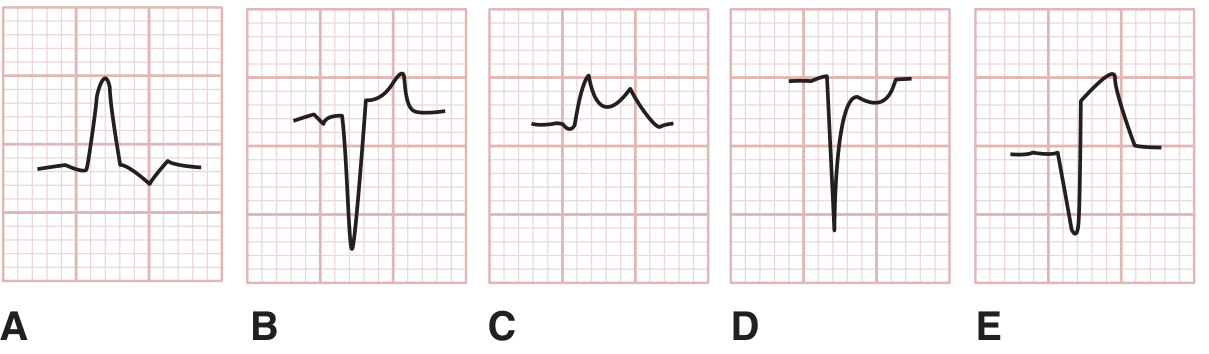
5. Sgarbossa Criteria - AMI in LBBB
| Criterion | Finding | Score |
|---|---|---|
| 1 | Concordant STE ≥1 mm (STE in same direction as QRS) | 5 |
| 2 | Concordant ST depression ≥1 mm in V1, V2, or V3 | 3 |
| 3 | Discordant STE ≥5 mm (STE opposite to QRS) | 2 |
- Score ≥3 = 90% specificity for AMI
6. aVR ST Elevation - Left Main / Proximal LAD Occlusion
- STE in aVR ≥0.5 mV (~78% sensitive, 83% specific for LMCA disease)
- Widespread ST depression in multiple leads (I, II, V4-V6 especially)
- If STE is greater in aVR than V1 → favors LMCA occlusion
- If STE is greater in V1 than aVR → favors proximal LAD occlusion
Summary Table
| Pattern | Territory | Key ECG Finding | Artery |
|---|---|---|---|
| Posterior MI | Posterior wall | ST depression V1-V3 (horizontal), tall R in V1-V2 | RCA or LCx |
| Wellens Type A | Anterior (LAD) | Biphasic T-waves V2-V3 (pain-free ECG) | Proximal LAD |
| Wellens Type B | Anterior (LAD) | Deep symmetric T inversions V2-V3 (pain-free ECG) | Proximal LAD |
| De Winter | Anterior (LAD) | J-point depression + tall symmetric T-waves V1-V6 + aVR STE | Proximal LAD |
| Hyperacute T-waves | Variable | Broad, tall symmetric T-waves (earliest change) | Any |
| Sgarbossa (LBBB) | Variable | Concordant STE, or ST/S >0.25 | Any |
| aVR STE | Global/diffuse | STE aVR + widespread ST depression | LMCA or proximal LAD |