
STRAW in menapause/ gynaecology
STRAW+10 stages reproductive aging menopause staging system diagram
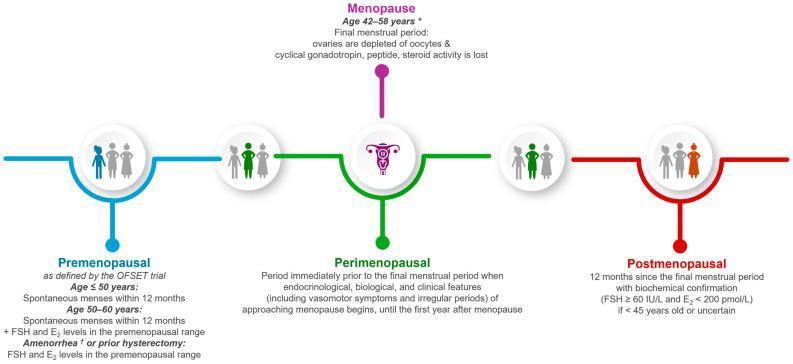
A medical infographic illustrating the progression of the menopausal transition, categorized into four stages: Premenopausal (blue), Perimenopausal (green), Menopause (purple), and Postmenopausal (red). The timeline uses circular icons and connecting lines to define each phase by clinical and biochemical criteria. 'Premenopausal' is defined by age, spontaneous menses, or FSH/E2 levels in the premenopausal range. 'Perimenopausal' is described as the period of approaching menopause characterized by endocrinological changes and vasomotor symptoms. 'Menopause' (age 42–58) identifies the final menstrual period when ovaries are depleted of oocytes and steroid activity is lost. 'Postmenopausal' is defined as 12 months since the final menstrual period, with biochemical confirmation (FSH ≥ 60 IU/L and E2 < 200 pmol/L) for patients under 45. The diagram emphasizes clinical definitions used in trials like OFSET, integrating age, hormone levels, and menstrual history to differentiate the stages of reproductive aging.
This medical illustration depicts the staging and progression patterns of Aging-Related Tau Astrogliopathy (ARTAG) in the human brain. The diagram is divided into five panels (A-E) showing subpial and gray matter distribution pathways. Red indicates initial involvement (Stage 1), while orange and blue arrows represent subsequent spread (Stages 2-3). Panels A and B illustrate subpial ARTAG: Pattern 1 begins in basal regions and spreads bidirectionally to lobar or brainstem areas; Pattern 2 starts in lobar/brainstem regions before involving the basal brain. Panels C, D, and E detail gray matter ARTAG progression. The 'Striatal path' (C) initiates in the striatum, spreading to the amygdala, cortex, or brainstem. The 'Amygdala path' (D) begins in the amygdala and follows similar trajectories. Panel E shows advanced Stage 3 combinations involving three regions simultaneously (3a: striatum/amygdala/cortex; 3b: striatum/amygdala/brainstem; 3c: amygdala/cortex/brainstem). This anatomical schematic serves as a neuropathological model for characterizing the hierarchical distribution of phosphorylated tau in astrocytes during brain aging.
This medical illustration depicts the Braak staging system for Lewy pathology progression in Parkinson’s disease. It consists of a sagittal-view anatomical diagram of the human brain with superimposed labels and directional red arrows indicating the caudo-rostral spread of alpha-synuclein pathology. A legend titled 'LOCATION OF STAGES' describes the six stages: Stage 1 (Peripheral and enteric nervous system), Stage 2 (Medulla Oblongata), Stage 3 (Pontine tegmentum), Stage 4 (Basal, mid, and fore-brain, hypothalamus, thalamus), Stage 5 (Mesocortex, allocortex), and Stage 6 (Neocortex). The visual logic uses solid and dashed red arrows to trace the ascending pathway of neurodegeneration starting from the brainstem and progressing through subcortical structures into the higher cortical regions. This educational diagram is used in neurology and pathology to visualize the stereotypical anatomical evolution of Parkinson’s disease, correlating structural involvement with the progression from premotor to motor and eventually non-motor/cognitive symptoms.
STRAW+10: Stages of Reproductive Aging Workshop
Anchor Point: The Final Menstrual Period (FMP = Stage 0)
The STRAW+10 Staging Table
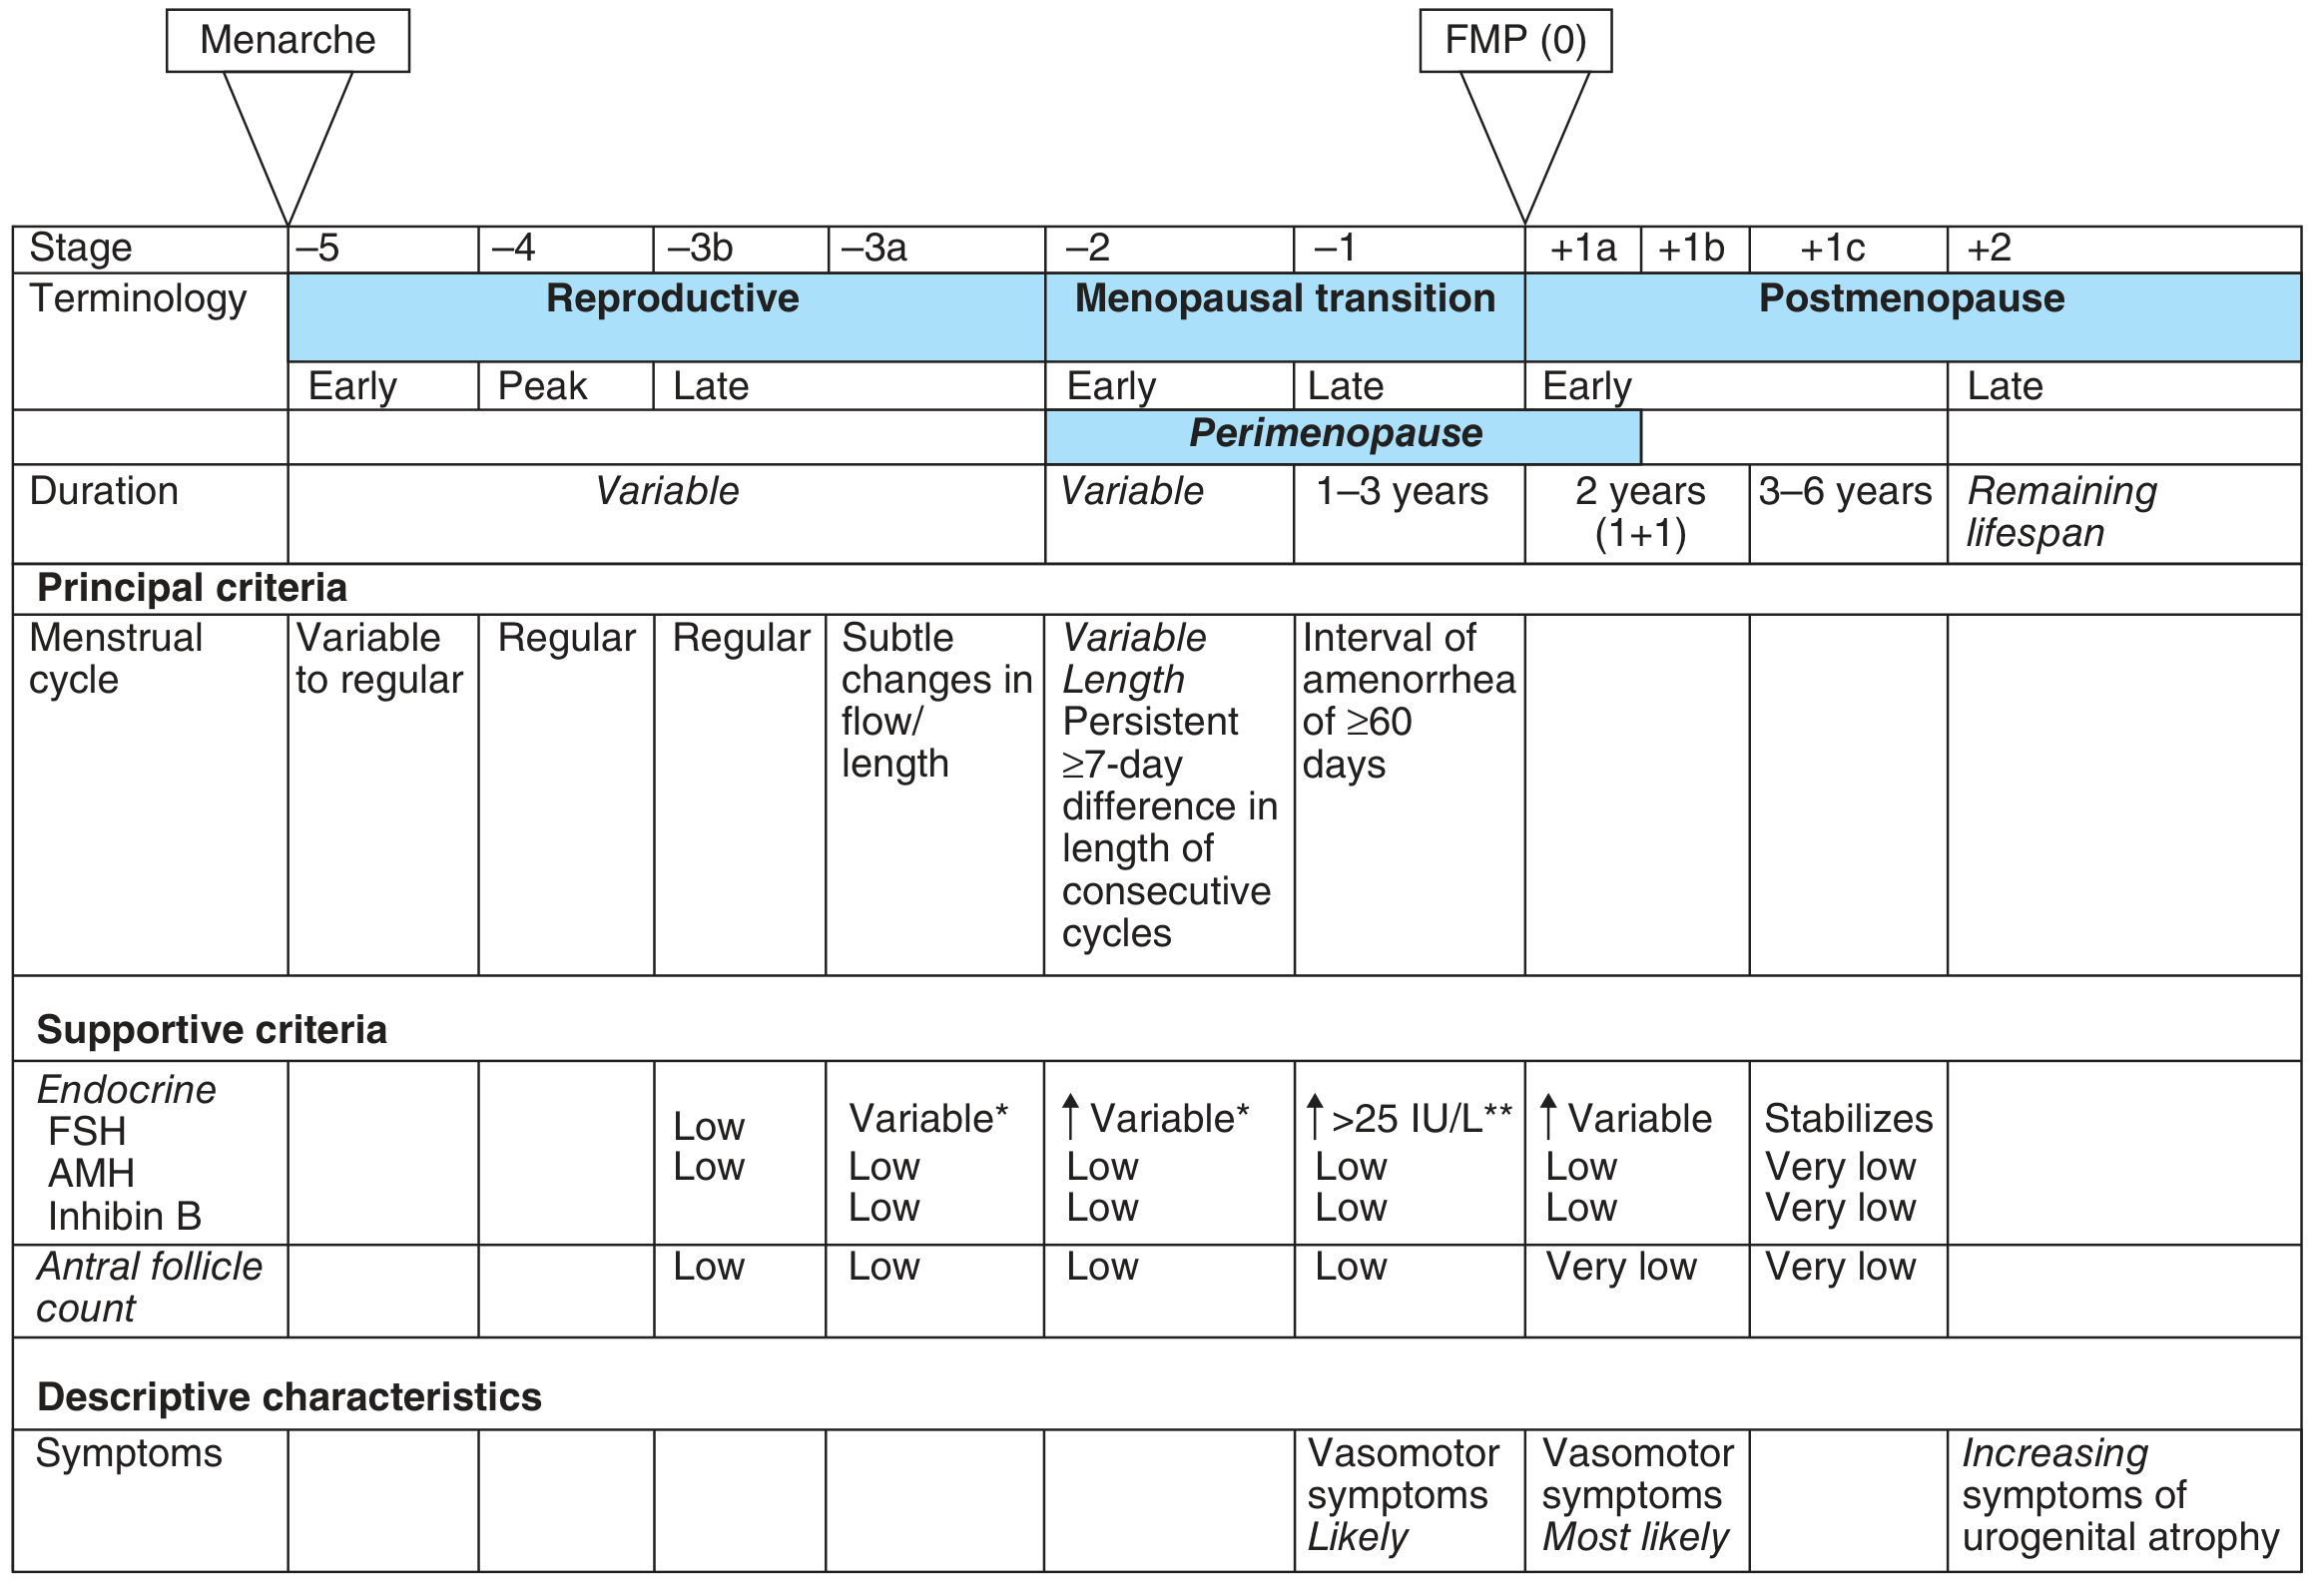
Stage-by-Stage Breakdown
REPRODUCTIVE PHASE (Stages -5 to -3)
| Stage | Sub-stage | Menstrual cycle | FSH | AMH | Inhibin B | AFC |
|---|---|---|---|---|---|---|
| -5 | Early | Variable to regular | - | - | - | - |
| -4 | Peak | Regular | - | - | - | - |
| -3b | Late | Regular | Low | Low | Low | Low |
| -3a | Late | Subtle changes in flow/length | Variable | Low | Low | Low |
- Duration: Variable
- Clinically: Fertility begins to decline at -3a; AMH and antral follicle count (AFC) start falling.
MENOPAUSAL TRANSITION (Stages -2 to -1)
- Menstrual cycle: Persistent ≥7-day difference in length of consecutive cycles (variable cycle length)
- FSH: Elevated and variable
- AMH: Low
- Inhibin B: Low
- AFC: Low
- Vasomotor symptoms: Begin to appear
- Duration: Variable
- Menstrual cycle: Interval of amenorrhea ≥60 days (but not yet 12 months)
- FSH: >25 IU/L (consistently elevated)
- AMH: Low
- Inhibin B: Low
- AFC: Low
- Vasomotor symptoms: Most likely at this stage
- Duration: 1-3 years
The STRAW+10 key revision: The early transition is identified by persistent (not just sporadic) ≥7-day variability in consecutive cycle lengths - either shortened or lengthened cycles.
POSTMENOPAUSE (Stages +1a to +2)
- First 1 year after FMP
- FSH: Variable (still rising)
- AMH: Very low
- AFC: Very low
- Vasomotor symptoms: Most likely
- Duration: 2 years total for +1a+1b (counted as 1 year + 1 year)
- Years 1-2 after FMP
- FSH: Stabilizes
- AMH: Very low
- Inhibin B: Very low
- Vasomotor symptoms persist
- FSH stabilizes at high levels
- AMH remains very low
- Duration: 3-6 years
- Bone loss accelerates during +1a-+1c
- Duration: Remaining lifespan
- Symptoms: Increasing urogenital atrophy (GSM - Genitourinary Syndrome of Menopause)
- Somatic aging dominates
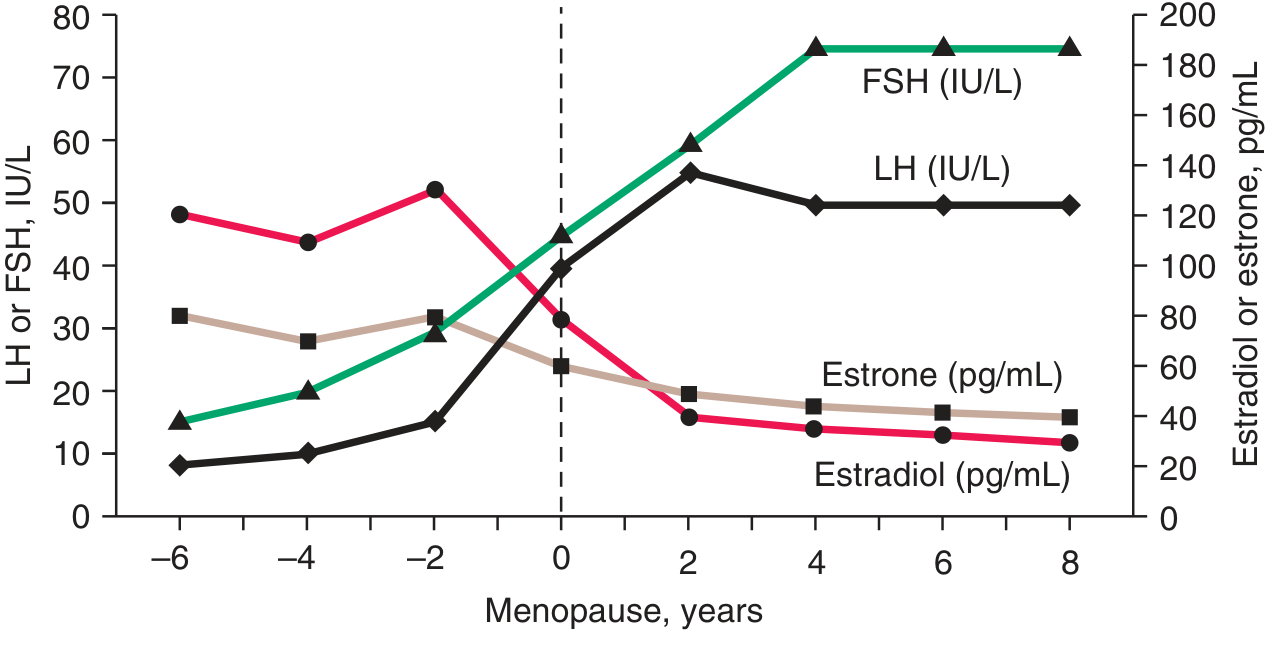
Hormone Trends Across the Menopausal Transition
Summary Table (Goldman-Cecil Staging)
| Stage | Approximate Age | Menses | FSH | AMH |
|---|---|---|---|---|
| Reproductive (-5 to -3) | 13-47 | Mostly regular | Low (rises at -3) | High |
| Early transition (-2) | 47-49 | Minor irregularity | Sporadically elevated | Normal-low |
| Late transition (-1) | 49-52 | ≥60-364 day amenorrhea | More consistently elevated | Low |
| Postmenopause (+1 to +2) | 50+ | Amenorrhea | Consistently ≥25 IU/L | Undetectable |
Key Clinical Points
- Menopause is diagnosed retrospectively - 12 consecutive months of amenorrhea with no other cause
- Average age of FMP: 51 years (USA); onset of perimenopause precedes FMP by 2-8 years (mean 4 years)
- Smoking accelerates the transition by ~2 years
- FSH alone is unreliable in perimenopause due to extreme intra-individual variability; AMH is more stable
- Perimenopause = stages -2, -1, +1a, and +1b
- STRAW+10 additions over original STRAW: added supportive criteria (AMH, inhibin B, AFC), refined +1 into a, b, c substages, and emphasized cycle variability as the key marker
Important Hormone Physiology
- Estradiol falls markedly at menopause
- Estrone is relatively preserved (from peripheral aromatization of adrenal/ovarian androgens in adipose tissue)
- FSH rises more than LH (due to loss of both inhibin and estrogen feedback)
- AMH (produced by small ovarian follicles) declines progressively with ovarian reserve - useful as a continuous biomarker of ovarian aging
- Inhibin B (from granulosa cells) falls early in the transition
Clinical Relevance by Stage
| Finding | Stage |
|---|---|
| Begin evaluating for decreased ovarian reserve | -3a |
| Counsel about contraception (still fertile!) | -2, -1 |
| Vasomotor symptoms most likely | -1, +1a |
| Bone loss accelerates most | +1a to +1c |
| Genitourinary atrophy (GSM) predominates | +2 |
| Stop hormonal contraception, consider HT | +1a (after 12 months amenorrhea) |