
Develop a research project using rhe case control method to study risk factors cardiovascular diseases in Pakistan. Describe how the study will be organised what data will be required and what methods of analysis will be used.
cardiovascular disease risk factors Pakistan epidemiology
case control study cardiovascular disease risk factors Pakistan research methodology
https://pmc.ncbi.nlm.nih.gov/articles/PMC6284873
Case-Control Study: Risk Factors for Cardiovascular Diseases in Pakistan
Research Project Proposal
1. Background and Rationale
2. Study Design
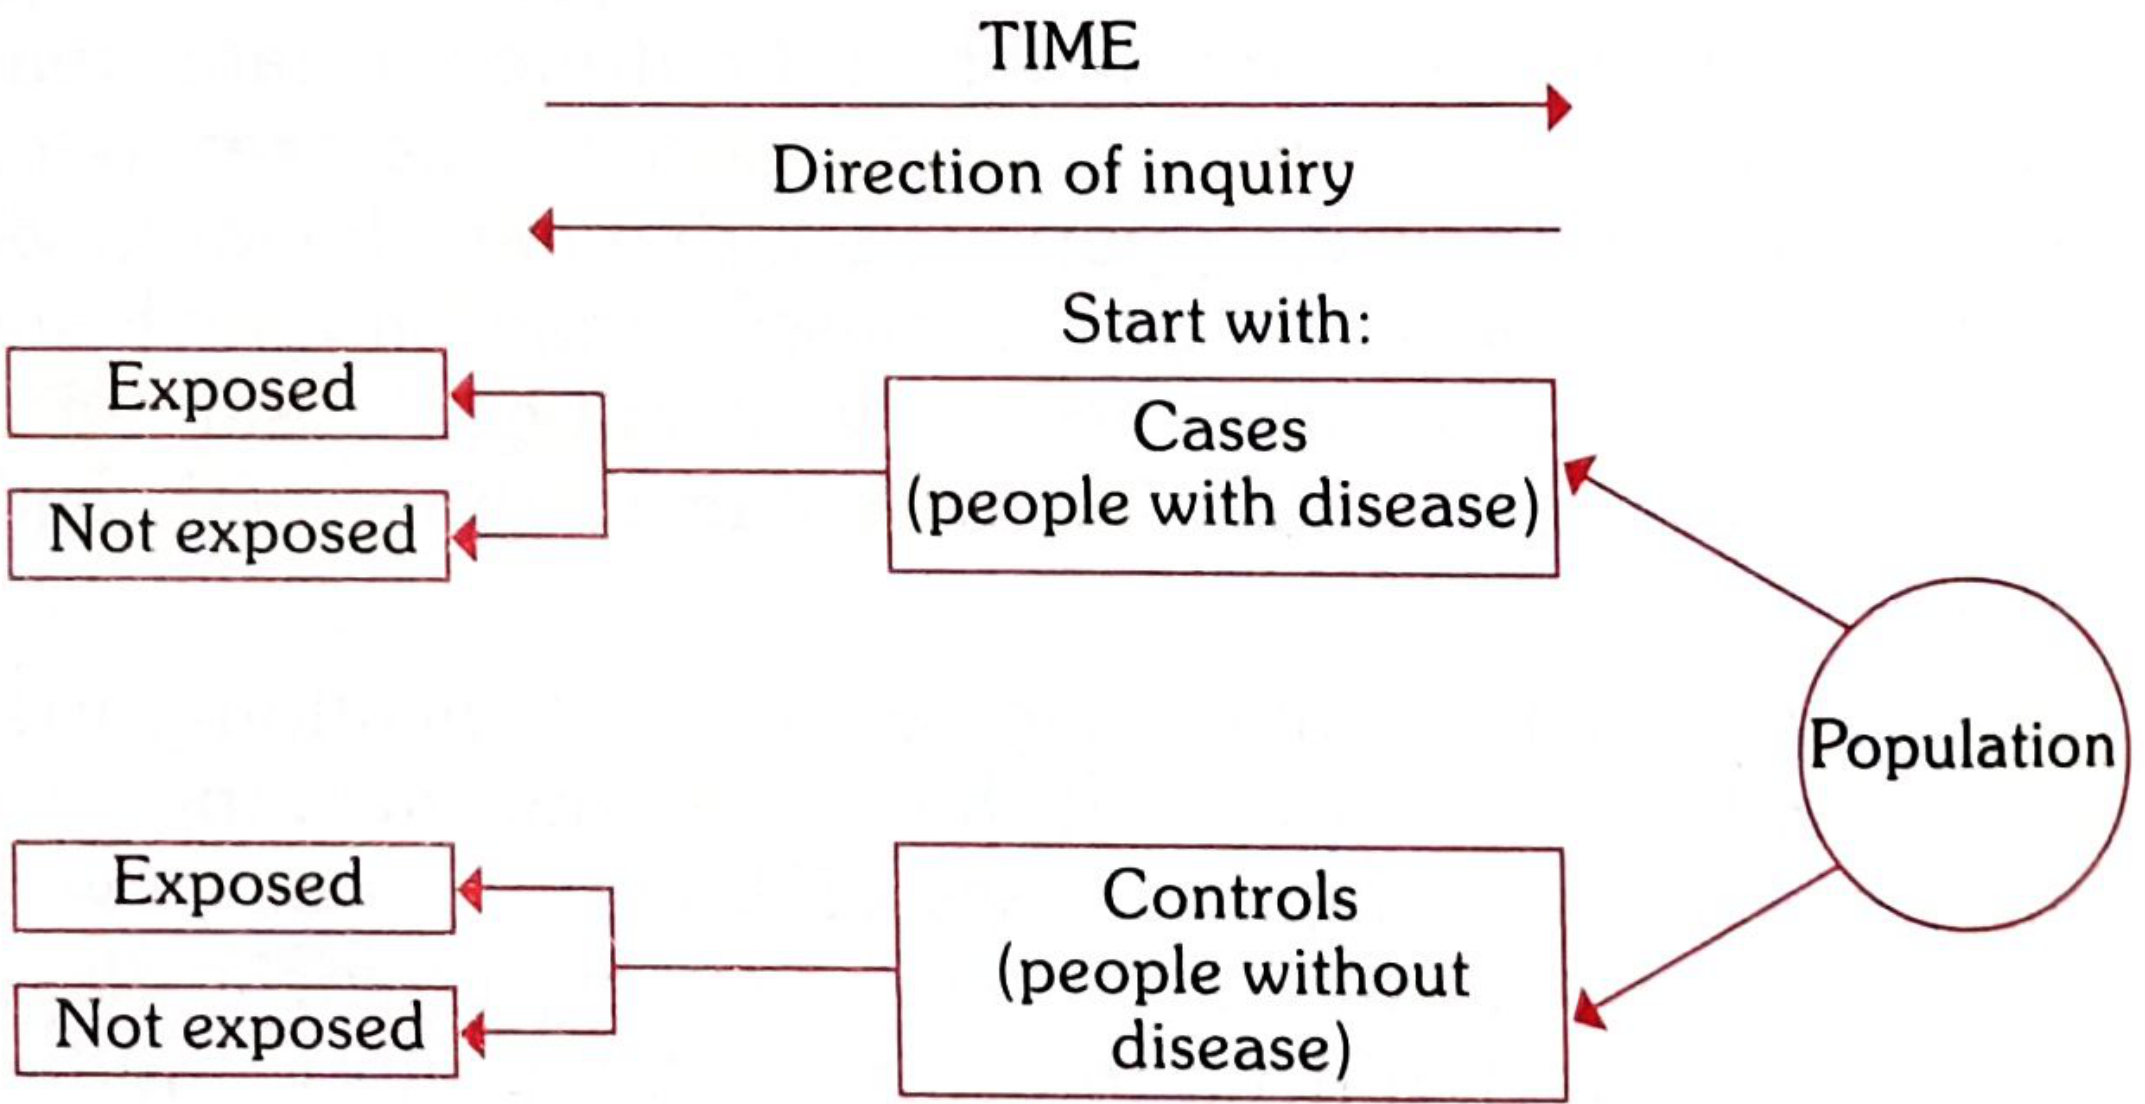
3. Study Objectives
- Estimate the odds ratio (OR) for each risk factor
- Determine the population attributable risk (PAR) for modifiable risk factors
- Examine the interaction between multiple co-existing risk factors
- Compare risk factor profiles across sex, urban vs. rural residence, and socioeconomic strata
4. Study Organisation
4.1 Study Sites
- Lahore: Services Hospital / Punjab Institute of Cardiology (high-volume tertiary cardiac centre)
- Karachi: Aga Khan University Hospital / National Institute of Cardiovascular Diseases (NICVD)
- Islamabad/Rawalpindi: Pakistan Institute of Medical Sciences (PIMS) / Shifa International Hospital
4.2 Sample Size
- Minimum: ~400 cases + 400 controls per centre
- Total target: ~800-1000 cases, 800-1000 controls across all centres
4.3 Study Period
- 3 months: ethics approval, protocol finalisation, training of data collectors, pilot testing
- 12 months: data collection (recruitment of cases and controls)
- 3 months: data cleaning, analysis, and write-up
5. Selection of Cases and Controls
5.1 Case Definition
- Acute myocardial infarction: ischaemic symptoms + ECG changes (ST elevation/depression, new LBBB) + elevated cardiac troponins (troponin I or T above the 99th percentile)
- Unstable angina / NSTEMI: clinical diagnosis with ECG and enzyme criteria
- Coronary artery disease confirmed on coronary angiography (≥50% stenosis in at least one major vessel)
- Adults aged 30-70 years, newly diagnosed (incident cases, not prevalent)
- Admitted to the cardiology department or CCU of study hospitals
- Willing to provide informed consent
- Resident of Pakistan for at least 5 years
5.2 Control Selection
- Free of the disease under study (no history of CVD, confirmed by clinical assessment and ECG)
- Comparable to cases on key confounding variables (age ± 5 years, sex, hospital/locality)
- Representative of the source population from which cases arose
- General outpatient department (OPD) attendees from the same hospitals attending for unrelated conditions (orthopaedic, dermatology, ENT)
- Community volunteers and medical staff from the same catchment area
6. Matching
- Age (±5 years)
- Sex
- Hospital (to control for facility-level referral bias)
7. Data Collection - Exposures and Variables
7.1 Data Required
- Age, sex, education level, occupation
- Monthly household income (socioeconomic class)
- Urban vs. rural residence
- Ethnicity/province of origin (Punjabi, Sindhi, Pashtun, Baloch, Muhajir)
| Measurement | Method/Criterion |
|---|---|
| Blood pressure | Two readings, 5 min apart; hypertension = SBP ≥140 or DBP ≥90 mmHg, or on antihypertensives |
| Body weight, height | Calibrated scales; BMI = weight(kg)/height(m)² |
| Waist circumference | Measured at umbilicus; central obesity: >90 cm men, >80 cm women (South Asian cut-offs) |
| Fasting blood glucose | Capillary or venous; diabetes = FBG ≥7.0 mmol/L or on hypoglycaemics |
- Total cholesterol, LDL-cholesterol, HDL-cholesterol, triglycerides
- Fasting blood glucose, HbA1c
- Serum creatinine (renal function)
- Full blood count (anaemia as confounder)
- High-sensitivity C-reactive protein (hs-CRP) as inflammatory marker
- Smoking: current, ex-smoker (quit >1 year), never; pack-year history; smokeless tobacco (naswar/gutka use - common in Pakistan)
- Physical activity: measured by IPAQ (International Physical Activity Questionnaire) - sedentary defined as <600 MET-minutes/week
- Dietary history: frequency intake of red meat, fried food, vegetables, fruits, salt added to food, ghee/oil use
- Alcohol consumption (culturally sensitive; low prevalence in Pakistan but must be assessed)
- Sleep patterns and psychosocial stress (perceived stress scale)
- Duration of hypertension and diabetes
- Family history of premature CVD (first-degree relative with MI or stroke before age 55 in males, 65 in females)
- Previous TIA or stroke
- History of chronic kidney disease
- Current antihypertensive therapy, statins, antidiabetic agents, antiplatelet drugs
7.2 Data Collection Tools
- Pre-tested, bilingual (English/Urdu) structured questionnaire
- Calibrated digital sphygmomanometers (validated for Pakistani populations)
- Standard 12-lead ECG for all controls (to exclude silent ischaemia)
- Venous blood sample collection by trained phlebotomists; samples processed in a single centralised laboratory per centre using standardised methods
8. Ethical Considerations
- Ethics approval from Institutional Review Boards (IRB) of all participating hospitals and from the Pakistan Medical Research Council (PMRC)
- Written informed consent from all participants (Urdu-language consent forms)
- Anonymisation: participants identified by study ID codes only
- Right to withdraw at any time without consequence
- All laboratory results shared with participants and treating physicians
- Data stored on password-protected servers; hard copies in locked cabinets
9. Methods of Analysis
9.1 The 2×2 Contingency Table
| Cases (CVD) | Controls (No CVD) | |
|---|---|---|
| Risk factor present | a | b |
| Risk factor absent | c | d |
| Total | a+c | b+d |
9.2 Odds Ratio (OR) - Primary Measure of Association
- OR = 1.0: no association
- OR > 1.0: positive association (risk factor)
- OR < 1.0: protective factor
9.3 Tests of Statistical Significance
- Chi-square (χ²) test for categorical variables (e.g., smoking yes/no, hypertension yes/no)
- Student's independent t-test for continuous variables (e.g., mean total cholesterol, mean systolic blood pressure) - as used by Liaquat et al. in Islamabad
- Mann-Whitney U test if continuous variables are not normally distributed
9.4 Matched Analysis
- McNemar's test for dichotomous matched pairs
- Conditional logistic regression for matched data to calculate adjusted ORs
9.5 Multivariable Analysis - Logistic Regression
- Simultaneous adjustment for multiple confounders
- Calculation of adjusted ORs for each risk factor, holding all others constant
- Assessment of interaction terms (e.g., does the effect of smoking differ between diabetics and non-diabetics?)
- All risk factors significant at p < 0.20 in univariate analysis
- A priori confounders: age, sex, socioeconomic status, family history
9.6 Population Attributable Risk (PAR)
9.7 Stratified Analysis (Mantel-Haenszel)
- Examine effect modification by sex, age group, urban/rural status
- Detect confounding (comparing crude ORs to stratum-specific ORs)
9.8 Sensitivity Analyses
- Separate analyses restricting to incident (new) cases only
- Analyses excluding participants with missing data
- Analyses restricting to age 30-60 (premature CVD, particularly relevant in South Asia)
10. Bias and Its Control
| Bias Type | Source | Control |
|---|---|---|
| Selection bias | Hospital controls may not represent the general population | Use multiple control sources; community controls as sensitivity analysis |
| Recall bias | Cases may over-report past exposures (since they know their diagnosis) | Use objective measures (blood tests, medical records) not only self-report |
| Observer bias | Interviewers may probe differently for cases vs. controls | Interviewers blinded to case/control status where possible; standardised questionnaire |
| Information bias | Inaccurate dietary recall | Validated food frequency questionnaires in Urdu |
| Confounding | Socioeconomic status confounds many exposures | Matching + logistic regression adjustment |
11. Expected Risk Factors and Hypotheses
| Risk Factor | Expected Direction | Biological Basis |
|---|---|---|
| Hypertension | OR > 3 | Endothelial injury, LVH, atherosclerosis |
| Dyslipidaemia (high LDL, low HDL) | OR > 2.5 | Atherogenesis via foam cell formation |
| Current smoking / tobacco use | OR > 2 | Oxidative stress, platelet activation, vasospasm |
| Type 2 diabetes | OR > 2 | Accelerated atherosclerosis, pro-thrombotic state |
| Abdominal obesity | OR > 1.8 | Insulin resistance, pro-inflammatory adipokines |
| Physical inactivity | OR > 1.5 | Reduced HDL, impaired endothelial function |
| Family history of premature CVD | OR > 2 | Polygenic susceptibility |
| High dietary saturated fat/ghee | OR > 1.5 | Elevated LDL cholesterol |
| Psychosocial stress | OR > 1.4 | Sympathoadrenal activation, cortisol |
| Smokeless tobacco (naswar) | OR > 1.6 | Nicotine-mediated vasoconstriction - unique to South Asia |
12. Strengths and Limitations of the Design
- Faster and cheaper than a cohort study - no need to wait for disease to develop
- Suitable for rare outcomes (CVD events)
- Can study multiple risk factors simultaneously
- Multi-centre design improves external validity across Pakistan's diverse regions
- Inclusion of smokeless tobacco (a Pakistan-specific exposure often missed in Western studies)
- Cannot calculate incidence rates or absolute risk
- Retrospective exposure assessment is subject to recall bias
- Hospital-based controls may share some risk factors with cases (Berkson's bias)
- Cannot establish temporality with certainty (though for risk factors like hypertension, pre-existing records help)
- Case-control studies yield OR, not RR directly (though OR approximates RR when disease prevalence is low)
13. Dissemination and Policy Impact
Summary Table
| Component | Detail |
|---|---|
| Design | Hospital-based case-control |
| Outcome | Incident CVD (MI, CAD, unstable angina) |
| Sites | Lahore, Karachi, Islamabad |
| Sample size | ~900 cases + 900 controls |
| Matching | Individual: age (±5 yr), sex; Group: hospital |
| Exposure data | Questionnaire + clinical exam + fasting bloods |
| Primary statistic | Odds Ratio (with 95% CI) |
| Univariate analysis | χ² test, t-test |
| Multivariable analysis | Conditional logistic regression |
| Policy measure | Population Attributable Risk % |
- Park's Textbook of Preventive and Social Medicine outlines the four basic steps of case-control design (case/control selection, matching, exposure measurement, analysis) and the OR/PAR framework used throughout this protocol.
- Liaquat et al. (2018) carried out a case-control study in Islamabad (835 cases, 794 controls) finding significantly elevated BMI, SBP, DBP, and dyslipidaemia in CVD patients vs. controls (p < 0.05) - providing baseline OR estimates for power calculations.
- Jamali et al. (2024) (Nawabshah case-control study) documented hypertension (73.5%), smoking (66.4%), dyslipidaemia (64.3%), and obesity (52.5%) as the dominant modifiable risk factors in Pakistani CVD patients.
Generate a power point presentation of the above research and mention on first slide Name: SHAHAB Group: Med21C
mkdir -p /tmp/workspace/cvd-pakistan-pptx
~/cvd-pakistan-pptx/create_pptx.py
from pptx import Presentation
from pptx.util import Inches, Pt, Emu
from pptx.dml.color import RGBColor
from pptx.enum.text import PP_ALIGN, MSO_ANCHOR
from pptx.util import Inches, Pt
import copy

# ── Colour palette ──────────────────────────────────────────────────────────
DARK_RED   = RGBColor(0xC0, 0x00, 0x00)
DEEP_NAVY  = RGBColor(0x1F, 0x34, 0x64)
MID_BLUE   = RGBColor(0x2E, 0x75, 0xB6)
LIGHT_BLUE = RGBColor(0xBD, 0xD7, 0xEE)
WHITE      = RGBColor(0xFF, 0xFF, 0xFF)
LIGHT_GREY = RGBColor(0xF2, 0xF2, 0xF2)
DARK_GREY  = RGBColor(0x40, 0x40, 0x40)
ACCENT_RED = RGBColor(0xC0, 0x00, 0x00)

prs = Presentation()
prs.slide_width  = Inches(13.333)
prs.slide_height = Inches(7.5)

blank = prs.slide_layouts[6]  # fully blank


# ── Helper functions ─────────────────────────────────────────────────────────
def add_rect(slide, x, y, w, h, fill_color, alpha=None):
    shape = slide.shapes.add_shape(
        1,  # MSO_SHAPE_TYPE.RECTANGLE
        Inches(x), Inches(y), Inches(w), Inches(h)
    )
    shape.line.fill.background()
    fill = shape.fill
    fill.solid()
    fill.fore_color.rgb = fill_color
    return shape


def add_text(slide, text, x, y, w, h, size, bold=False, color=WHITE,
             align=PP_ALIGN.LEFT, italic=False, wrap=True, font="Calibri"):
    tb = slide.shapes.add_textbox(Inches(x), Inches(y), Inches(w), Inches(h))
    tf = tb.text_frame
    tf.word_wrap = wrap
    tf.margin_left = Pt(0)
    tf.margin_right = Pt(0)
    tf.margin_top = Pt(0)
    tf.margin_bottom = Pt(0)
    p = tf.paragraphs[0]
    p.alignment = align
    run = p.add_run()
    run.text = text
    run.font.name = font
    run.font.size = Pt(size)
    run.font.bold = bold
    run.font.italic = italic
    run.font.color.rgb = color
    return tb


def add_bullet_slide(slide, title_text, bullets, bg_color=LIGHT_GREY):
    """Standard content slide with header bar + bullet list."""
    # Background
    add_rect(slide, 0, 0, 13.333, 7.5, bg_color)
    # Header bar
    add_rect(slide, 0, 0, 13.333, 1.15, DEEP_NAVY)
    # Accent strip
    add_rect(slide, 0, 1.15, 13.333, 0.07, DARK_RED)
    # Title
    add_text(slide, title_text, 0.35, 0.18, 12.5, 0.85,
             size=28, bold=True, color=WHITE, align=PP_ALIGN.LEFT)
    # Bullets
    tb = slide.shapes.add_textbox(Inches(0.5), Inches(1.4), Inches(12.3), Inches(5.8))
    tf = tb.text_frame
    tf.word_wrap = True
    tf.margin_left = Pt(4)
    for i, (lvl, txt) in enumerate(bullets):
        p = tf.paragraphs[0] if i == 0 else tf.add_paragraph()
        p.level = lvl
        run = p.add_run()
        run.text = txt
        run.font.name = "Calibri"
        run.font.size = Pt(17) if lvl == 0 else Pt(15)
        run.font.bold = (lvl == 0)
        run.font.color.rgb = DEEP_NAVY if lvl == 0 else DARK_GREY
        p.space_before = Pt(5 if lvl == 0 else 2)
        p.space_after  = Pt(2)


# ═══════════════════════════════════════════════════════════════════════════════
# SLIDE 1 — Title Slide
# ═══════════════════════════════════════════════════════════════════════════════
slide = prs.slides.add_slide(blank)

# Full dark navy background
add_rect(slide, 0, 0, 13.333, 7.5, DEEP_NAVY)
# Top red accent stripe
add_rect(slide, 0, 0, 13.333, 0.18, DARK_RED)
# Bottom red accent stripe
add_rect(slide, 0, 7.22, 13.333, 0.28, DARK_RED)
# Mid decorative bar
add_rect(slide, 0, 3.8, 13.333, 0.06, MID_BLUE)
# White vertical side accent
add_rect(slide, 0, 0.18, 0.12, 7.04, MID_BLUE)

# Main title
add_text(slide,
         "Risk Factors for Cardiovascular Diseases in Pakistan",
         0.5, 0.55, 12.3, 2.2,
         size=38, bold=True, color=WHITE, align=PP_ALIGN.CENTER)

# Subtitle
add_text(slide,
         "A Case-Control Study Design",
         0.5, 2.85, 12.3, 0.8,
         size=26, bold=False, color=LIGHT_BLUE, align=PP_ALIGN.CENTER, italic=True)

# Divider line (thin rectangle)
add_rect(slide, 2.5, 3.9, 8.333, 0.04, LIGHT_BLUE)

# Student info box
add_rect(slide, 3.0, 4.1, 7.2, 2.1, MID_BLUE)
add_text(slide, "Presented by:",       3.1, 4.18, 7.0, 0.45, size=16, color=LIGHT_BLUE, align=PP_ALIGN.CENTER, italic=True)
add_text(slide, "SHAHAB",              3.1, 4.6,  7.0, 0.65, size=30, bold=True,  color=WHITE, align=PP_ALIGN.CENTER)
add_text(slide, "Group: Med21C",       3.1, 5.25, 7.0, 0.45, size=20, color=LIGHT_BLUE, align=PP_ALIGN.CENTER)
add_text(slide, "July 2026",           3.1, 5.75, 7.0, 0.35, size=15, color=LIGHT_BLUE, align=PP_ALIGN.CENTER, italic=True)


# ═══════════════════════════════════════════════════════════════════════════════
# SLIDE 2 — Background & Rationale
# ═══════════════════════════════════════════════════════════════════════════════
slide = prs.slides.add_slide(blank)
add_bullet_slide(slide, "Background & Rationale", [
    (0, "CVDs: The Leading Killer in Pakistan"),
    (1, "Cardiovascular diseases are the #1 cause of mortality in Pakistan"),
    (1, "Rapid urbanisation, dietary transitions & tobacco use are accelerating the burden"),
    (1, "Pakistan has a unique epidemiological profile distinct from Western populations"),
    (0, "Why a Case-Control Study?"),
    (1, "Efficient & cost-effective for studying rare outcomes like acute CVD events"),
    (1, "Can examine multiple risk factors simultaneously"),
    (1, "Ideal for chronic diseases where causal pathway spans decades"),
    (1, "Both exposure and outcome have already occurred — study works backwards"),
])


# ═══════════════════════════════════════════════════════════════════════════════
# SLIDE 3 — Study Objectives
# ═══════════════════════════════════════════════════════════════════════════════
slide = prs.slides.add_slide(blank)
add_bullet_slide(slide, "Study Objectives", [
    (0, "Primary Objective"),
    (1, "Identify and quantify associations between established risk factors and CVD"),
    (1, "Calculate Odds Ratios (ORs) for each exposure with 95% confidence intervals"),
    (0, "Secondary Objectives"),
    (1, "Determine Population Attributable Risk (PAR%) for modifiable risk factors"),
    (1, "Examine interactions between co-existing risk factors"),
    (1, "Compare risk factor profiles by sex, age group, urban vs. rural residence"),
    (1, "Identify Pakistan-specific factors (e.g. smokeless tobacco — naswar/gutka)"),
])


# ═══════════════════════════════════════════════════════════════════════════════
# SLIDE 4 — Study Design Overview
# ═══════════════════════════════════════════════════════════════════════════════
slide = prs.slides.add_slide(blank)
add_bullet_slide(slide, "Study Design Overview", [
    (0, "Design:   Hospital-based, multi-centre Case-Control Study"),
    (0, "Study Sites"),
    (1, "Lahore — Punjab Institute of Cardiology / Services Hospital"),
    (1, "Karachi — NICVD / Aga Khan University Hospital"),
    (1, "Islamabad — PIMS / Shifa International Hospital"),
    (0, "Sample Size"),
    (1, "~900 Cases  +  ~900 Controls  (1:1 ratio)"),
    (1, "Power: 80%  |  Alpha: 0.05  |  Expected OR: 2.0"),
    (0, "Study Duration:  18 months total"),
    (1, "3 months — ethics, protocol, training  |  12 months — recruitment  |  3 months — analysis"),
])


# ═══════════════════════════════════════════════════════════════════════════════
# SLIDE 5 — Case-Control Design Diagram
# ═══════════════════════════════════════════════════════════════════════════════
slide = prs.slides.add_slide(blank)
add_rect(slide, 0, 0, 13.333, 7.5, LIGHT_GREY)
add_rect(slide, 0, 0, 13.333, 1.15, DEEP_NAVY)
add_rect(slide, 0, 1.15, 13.333, 0.07, DARK_RED)
add_text(slide, "Case-Control Study: Conceptual Framework",
         0.35, 0.18, 12.5, 0.85, size=28, bold=True, color=WHITE)

# Direction labels
add_text(slide, "TIME →", 4.5, 1.5, 4, 0.4, size=14, color=DARK_GREY, bold=True, align=PP_ALIGN.CENTER)
add_text(slide, "← Direction of Inquiry", 4.5, 1.9, 4, 0.4, size=13, color=DARK_RED, bold=True, align=PP_ALIGN.CENTER, italic=True)

# POPULATION box
add_rect(slide, 5.5, 2.6, 2.3, 0.85, DEEP_NAVY)
add_text(slide, "POPULATION", 5.5, 2.7, 2.3, 0.65, size=14, bold=True, color=WHITE, align=PP_ALIGN.CENTER)

# CASES box
add_rect(slide, 2.2, 1.95, 2.5, 0.85, DARK_RED)
add_text(slide, "CASES\n(CVD present)", 2.2, 1.98, 2.5, 0.8, size=13, bold=True, color=WHITE, align=PP_ALIGN.CENTER)

# CONTROLS box
add_rect(slide, 8.6, 1.95, 2.5, 0.85, MID_BLUE)
add_text(slide, "CONTROLS\n(CVD absent)", 8.6, 1.98, 2.5, 0.8, size=13, bold=True, color=WHITE, align=PP_ALIGN.CENTER)

# EXPOSED / NOT EXPOSED for cases
add_rect(slide, 0.3, 1.6, 1.6, 0.6, ACCENT_RED)
add_text(slide, "Exposed", 0.3, 1.68, 1.6, 0.45, size=13, bold=True, color=WHITE, align=PP_ALIGN.CENTER)
add_rect(slide, 0.3, 2.45, 1.6, 0.6, RGBColor(0xE0,0x70,0x70))
add_text(slide, "Not Exposed", 0.3, 2.53, 1.6, 0.45, size=12, bold=False, color=WHITE, align=PP_ALIGN.CENTER)

# EXPOSED / NOT EXPOSED for controls
add_rect(slide, 11.4, 1.6, 1.6, 0.6, MID_BLUE)
add_text(slide, "Exposed", 11.4, 1.68, 1.6, 0.45, size=13, bold=True, color=WHITE, align=PP_ALIGN.CENTER)
add_rect(slide, 11.4, 2.45, 1.6, 0.6, RGBColor(0x90,0xB8,0xD8))
add_text(slide, "Not Exposed", 11.4, 2.53, 1.6, 0.45, size=12, bold=False, color=WHITE, align=PP_ALIGN.CENTER)

# Key principle box
add_rect(slide, 0.5, 3.7, 12.3, 1.35, DEEP_NAVY)
add_text(slide,
         "Key Principle: Start with DISEASE STATUS (cases vs. controls), then look BACK in time to compare exposure histories",
         0.6, 3.78, 12.1, 1.2, size=16, bold=False, color=WHITE, align=PP_ALIGN.CENTER)

# 2x2 table explanation
add_rect(slide, 0.5, 5.2, 12.3, 2.0, WHITE)
add_text(slide, "The 2×2 Contingency Table:", 0.65, 5.25, 5, 0.4, size=14, bold=True, color=DEEP_NAVY)
# table headers
cols = ["", "Cases (CVD +)", "Controls (CVD −)"]
xs = [0.65, 3.8, 7.8]
for j, (x, h) in enumerate(zip(xs, cols)):
    add_text(slide, h, x, 5.65, 3.5, 0.4, size=13, bold=True, color=DEEP_NAVY)
rows = [("Risk Factor Present", "a", "b"), ("Risk Factor Absent", "c", "d")]
ys = [6.05, 6.5]
for row, y in zip(rows, ys):
    for x, cell in zip(xs, row):
        add_text(slide, cell, x, y, 3.5, 0.4, size=13, color=DARK_GREY)
add_text(slide, "  Odds Ratio  =  (a × d) / (b × c)", 7.5, 5.65, 5.0, 1.3, size=15, bold=True, color=DARK_RED)


# ═══════════════════════════════════════════════════════════════════════════════
# SLIDE 6 — Case & Control Selection
# ═══════════════════════════════════════════════════════════════════════════════
slide = prs.slides.add_slide(blank)
add_bullet_slide(slide, "Selection of Cases & Controls", [
    (0, "Cases — Inclusion Criteria"),
    (1, "Adults aged 30–70 years with NEWLY diagnosed CVD (incident cases)"),
    (1, "Diagnosis confirmed by: ECG changes + elevated troponins + clinical assessment"),
    (1, "OR: CAD confirmed on coronary angiography (≥50% stenosis)"),
    (1, "Admitted to cardiology/CCU of study hospitals | Resident of Pakistan ≥5 years"),
    (0, "Controls — Selection Criteria"),
    (1, "No history or clinical evidence of CVD (normal ECG at enrolment)"),
    (1, "Recruited from General OPD (orthopaedics, dermatology, ENT)"),
    (1, "Individually matched: age (±5 years) + sex + hospital site"),
    (0, "Matching Variables"),
    (1, "Individual: Age (±5 yr), Sex  |  Group: Socioeconomic strata, Urban/Rural"),
])


# ═══════════════════════════════════════════════════════════════════════════════
# SLIDE 7 — Data Required
# ═══════════════════════════════════════════════════════════════════════════════
slide = prs.slides.add_slide(blank)
add_bullet_slide(slide, "Data Required — Variables & Measurements", [
    (0, "A. Sociodemographic"),
    (1, "Age, sex, education, occupation, income level, urban/rural, ethnicity/province"),
    (0, "B. Clinical Measurements"),
    (1, "Blood pressure (hypertension = SBP ≥140 / DBP ≥90 mmHg or on treatment)"),
    (1, "BMI (kg/m²) | Waist circumference (central obesity: >90 cm M, >80 cm F)"),
    (0, "C. Biochemical (Fasting 8–12 hrs)"),
    (1, "Lipid profile: Total-C, LDL-C, HDL-C, Triglycerides | FBG & HbA1c | hs-CRP"),
    (0, "D. Lifestyle Factors (Questionnaire)"),
    (1, "Smoking (pack-years) | Smokeless tobacco (naswar/gutka) | Physical activity (IPAQ)"),
    (1, "Dietary intake (ghee, red meat, salt, vegetables) | Psychosocial stress scale"),
    (0, "E. Medical & Family History"),
    (1, "Duration of hypertension/diabetes | Family history of premature CVD | Medications"),
])


# ═══════════════════════════════════════════════════════════════════════════════
# SLIDE 8 — Expected Risk Factors & Hypotheses
# ═══════════════════════════════════════════════════════════════════════════════
slide = prs.slides.add_slide(blank)
add_rect(slide, 0, 0, 13.333, 7.5, LIGHT_GREY)
add_rect(slide, 0, 0, 13.333, 1.15, DEEP_NAVY)
add_rect(slide, 0, 1.15, 13.333, 0.07, DARK_RED)
add_text(slide, "Hypothesised Risk Factors & Expected Odds Ratios",
         0.35, 0.18, 12.5, 0.85, size=26, bold=True, color=WHITE)

# Table
headers = ["Risk Factor", "Expected OR", "Biological Basis"]
col_xs  = [0.35, 5.2, 7.5]
col_ws  = [4.7,  2.1, 5.5]
row_data = [
    ("Hypertension",            "> 3.0",  "Endothelial injury → atherosclerosis"),
    ("Dyslipidaemia (high LDL)", "> 2.5", "Foam cell formation → plaque"),
    ("Smoking / Tobacco use",   "> 2.0",  "Oxidative stress, platelet activation"),
    ("Type 2 Diabetes",         "> 2.0",  "Accelerated atherosclerosis"),
    ("Abdominal Obesity",       "> 1.8",  "Insulin resistance, pro-inflammatory"),
    ("Physical Inactivity",     "> 1.5",  "Reduced HDL, endothelial dysfunction"),
    ("Family History CVD",      "> 2.0",  "Polygenic susceptibility"),
    ("Naswar / Smokeless Tobacco", "> 1.6", "Nicotine → vasoconstriction (South Asia-specific)"),
    ("Psychosocial Stress",     "> 1.4",  "Sympathoadrenal activation"),
]

# Header row
y = 1.35
add_rect(slide, 0.3, y, 12.7, 0.42, DEEP_NAVY)
for x, w, h in zip(col_xs, col_ws, headers):
    add_text(slide, h, x, y+0.04, w, 0.36, size=13, bold=True, color=WHITE)

for i, row in enumerate(row_data):
    y += 0.5
    bg = WHITE if i % 2 == 0 else LIGHT_BLUE
    add_rect(slide, 0.3, y, 12.7, 0.46, bg)
    for x, w, cell in zip(col_xs, col_ws, row):
        is_or = (cell.startswith(">"))
        add_text(slide, cell, x, y+0.04, w, 0.4, size=12,
                 bold=is_or, color=ACCENT_RED if is_or else DARK_GREY)


# ═══════════════════════════════════════════════════════════════════════════════
# SLIDE 9 — Methods of Analysis
# ═══════════════════════════════════════════════════════════════════════════════
slide = prs.slides.add_slide(blank)
add_bullet_slide(slide, "Methods of Analysis", [
    (0, "1. Descriptive Statistics"),
    (1, "Means ± SD for continuous variables | Frequencies (%) for categorical variables"),
    (0, "2. Univariate Analysis"),
    (1, "Chi-square (χ²) test — categorical exposures (smoking, hypertension, diabetes)"),
    (1, "Student's independent t-test — continuous variables (BP, cholesterol, BMI)"),
    (1, "Crude Odds Ratio = (a × d) / (b × c) with 95% Confidence Intervals"),
    (0, "3. Matched Analysis (for paired data)"),
    (1, "McNemar's test | Conditional logistic regression (adjusts for matching)"),
    (0, "4. Multivariable Logistic Regression"),
    (1, "Adjusted ORs controlling for all confounders simultaneously"),
    (1, "Interaction terms to detect effect modification (e.g. smoking × diabetes)"),
    (0, "5. Population Attributable Risk (PAR%)"),
    (1, "PAR% = [Pe(OR-1)] / [1+Pe(OR-1)] × 100 — identifies highest-impact targets"),
])


# ═══════════════════════════════════════════════════════════════════════════════
# SLIDE 10 — Bias Control & Ethical Considerations
# ═══════════════════════════════════════════════════════════════════════════════
slide = prs.slides.add_slide(blank)
add_bullet_slide(slide, "Bias Control & Ethical Considerations", [
    (0, "Controlling Major Biases"),
    (1, "Selection bias → Multiple control sources; community controls as sensitivity analysis"),
    (1, "Recall bias → Objective measures (lab tests, medical records) not just self-report"),
    (1, "Observer bias → Interviewers blinded to case/control status; standardised tool"),
    (1, "Confounding → Individual matching + multivariable logistic regression"),
    (0, "Ethical Safeguards"),
    (1, "Ethics approval: IRBs of all 3 centres + Pakistan Medical Research Council (PMRC)"),
    (1, "Written informed consent in Urdu | Right to withdraw at any time"),
    (1, "All lab results shared with participants & treating physicians"),
    (1, "Data anonymised using study IDs; stored on password-protected servers"),
])


# ═══════════════════════════════════════════════════════════════════════════════
# SLIDE 11 — Strengths & Limitations
# ═══════════════════════════════════════════════════════════════════════════════
slide = prs.slides.add_slide(blank)
add_rect(slide, 0, 0, 13.333, 7.5, LIGHT_GREY)
add_rect(slide, 0, 0, 13.333, 1.15, DEEP_NAVY)
add_rect(slide, 0, 1.15, 13.333, 0.07, DARK_RED)
add_text(slide, "Strengths & Limitations", 0.35, 0.18, 12.5, 0.85, size=28, bold=True, color=WHITE)

# Two column layout
# Strengths column
add_rect(slide, 0.3, 1.35, 6.0, 5.9, MID_BLUE)
add_text(slide, "✔  STRENGTHS", 0.45, 1.42, 5.7, 0.5, size=17, bold=True, color=WHITE)
strengths = [
    "Faster & cheaper than cohort studies",
    "No need to wait for disease to develop",
    "Examines multiple risk factors at once",
    "Multi-centre design — broad generalisability",
    "Includes Pakistan-specific exposures (naswar)",
    "Incident cases — avoids survivor bias",
    "Large sample size (900+ cases, 900+ controls)",
]
y = 2.0
for s in strengths:
    add_text(slide, "• " + s, 0.45, y, 5.7, 0.48, size=14, color=WHITE)
    y += 0.52

# Limitations column
add_rect(slide, 6.9, 1.35, 6.1, 5.9, WHITE)
add_text(slide, "✘  LIMITATIONS", 7.05, 1.42, 5.8, 0.5, size=17, bold=True, color=DARK_RED)
limitations = [
    "Cannot calculate incidence rates directly",
    "OR approximates RR only when disease is rare",
    "Retrospective exposure — recall bias risk",
    "Hospital controls may share some risk factors",
    "Temporal sequence not always definitive",
    "Selection of truly representative controls is challenging",
]
y = 2.0
for l in limitations:
    add_text(slide, "• " + l, 7.05, y, 5.8, 0.48, size=14, color=DARK_GREY)
    y += 0.52


# ═══════════════════════════════════════════════════════════════════════════════
# SLIDE 12 — Summary & Conclusions
# ═══════════════════════════════════════════════════════════════════════════════
slide = prs.slides.add_slide(blank)
add_bullet_slide(slide, "Summary & Expected Impact", [
    (0, "Study Summary"),
    (1, "Hospital-based case-control study | ~900 cases + ~900 controls | 3 cities"),
    (1, "18-month timeline | Ethics-approved | Multi-disciplinary team"),
    (0, "Key Expected Findings"),
    (1, "Hypertension, dyslipidaemia, smoking and diabetes are the dominant ORs"),
    (1, "Abdominal obesity and physical inactivity are independent contributors"),
    (1, "Smokeless tobacco (naswar) will emerge as a locally-specific risk factor"),
    (0, "Policy Impact"),
    (1, "PAR estimates will directly guide national CVD prevention priorities"),
    (1, "Supports blood pressure screening, anti-smoking campaigns, and dietary education"),
    (1, "Findings to be published in JPMA & Eastern Mediterranean Health Journal"),
    (1, "Shared with Pakistan Ministry of National Health Services"),
])


# ═══════════════════════════════════════════════════════════════════════════════
# SLIDE 13 — Thank You
# ═══════════════════════════════════════════════════════════════════════════════
slide = prs.slides.add_slide(blank)
add_rect(slide, 0, 0, 13.333, 7.5, DEEP_NAVY)
add_rect(slide, 0, 0, 13.333, 0.18, DARK_RED)
add_rect(slide, 0, 7.22, 13.333, 0.28, DARK_RED)
add_rect(slide, 0, 0.18, 0.12, 7.04, MID_BLUE)

add_text(slide, "Thank You", 0.5, 1.5, 12.3, 1.5, size=54, bold=True, color=WHITE, align=PP_ALIGN.CENTER)
add_rect(slide, 2.5, 3.2, 8.333, 0.05, LIGHT_BLUE)

add_text(slide, "Questions & Discussion", 0.5, 3.4, 12.3, 0.8,
         size=24, italic=True, color=LIGHT_BLUE, align=PP_ALIGN.CENTER)

add_rect(slide, 3.5, 4.4, 6.3, 1.85, MID_BLUE)
add_text(slide, "SHAHAB", 3.6, 4.5, 6.1, 0.65, size=28, bold=True, color=WHITE, align=PP_ALIGN.CENTER)
add_text(slide, "Group: Med21C", 3.6, 5.15, 6.1, 0.45, size=20, color=LIGHT_BLUE, align=PP_ALIGN.CENTER)
add_text(slide, "July 2026", 3.6, 5.65, 6.1, 0.45, size=16, italic=True, color=LIGHT_BLUE, align=PP_ALIGN.CENTER)


# ── Save ─────────────────────────────────────────────────────────────────────
out_path = "/tmp/workspace/cvd-pakistan-pptx/CVD_Pakistan_CaseControl_SHAHAB_Med21C.pptx"
prs.save(out_path)
print(f"Saved: {out_path}")
cd /tmp/workspace/cvd-pakistan-pptx && python create_pptx.py
python3 -c " from pptx import Presentation prs = Presentation('/tmp/workspace/cvd-pakistan-pptx/CVD_Pakistan_CaseControl_SHAHAB_Med21C.pptx') print(f'Total slides: {len(prs.slides)}') for i, slide in enumerate(prs.slides, 1): texts = [s.text_frame.text.strip()[:60] for s in slide.shapes if s.has_text_frame and s.text_frame.text.strip()] print(f' Slide {i}: {texts[0] if texts else \"(no text)\"}') "
CVD Pakistan CaseControl SHAHAB Med21C
Presentation · PPTX
| # | Slide Title |
|---|---|
| 1 | Title Slide — Name: SHAHAB, Group: Med21C (prominently displayed) |
| 2 | Background & Rationale |
| 3 | Study Objectives |
| 4 | Study Design Overview (sites, sample size, timeline) |
| 5 | Case-Control Conceptual Framework + 2×2 table with OR formula |
| 6 | Selection of Cases & Controls (inclusion/exclusion criteria) |
| 7 | Data Required (sociodemographic, clinical, biochemical, lifestyle) |
| 8 | Hypothesised Risk Factors & Expected Odds Ratios (table format) |
| 9 | Methods of Analysis (χ², t-test, logistic regression, PAR%) |
| 10 | Bias Control & Ethical Considerations |
| 11 | Strengths & Limitations (two-column layout) |
| 12 | Summary & Expected Policy Impact |
| 13 | Thank You / Discussion |