Hi, i want to learn ABG from basic
Reading File
Finding Sources
Finding Sources
Finding Sources
Reading File
Reading File
Reading File
Reading File
Reading File
Reading File
Loading Image
Finding Sources
Finding Sources
Reading File
Finding Sources
I now have everything needed to write a thorough, well-structured ABG guide. Let me compile it.
Arterial Blood Gas (ABG) - A Complete Beginner's Guide
Sources: Roberts & Hedges' Clinical Procedures in Emergency Medicine - Tintinalli's Emergency Medicine - Symptom to Diagnosis: An Evidence Based Guide - Frameworks for Internal Medicine
1. What Is an ABG?
An Arterial Blood Gas (ABG) is a blood test drawn from an artery (usually the radial artery) that directly measures how well the lungs are exchanging oxygen and carbon dioxide, and gives a complete picture of the body's acid-base status.
It reports:
- pH - how acidic or alkaline the blood is
- PaCO₂ - partial pressure of carbon dioxide (respiratory parameter)
- PaO₂ - partial pressure of oxygen (oxygenation)
- HCO₃⁻ - bicarbonate (metabolic/renal parameter, calculated from pH and PaCO₂)
- SaO₂ - oxygen saturation of hemoglobin
2. Normal ABG Values (Memorize These)
| Parameter | Normal Range | Significance |
|---|---|---|
| pH | 7.35 - 7.45 | Acid-base balance |
| PaCO₂ | 35 - 45 mmHg | Respiratory component |
| HCO₃⁻ | 22 - 26 mEq/L | Metabolic component |
| PaO₂ | 80 - 100 mmHg | Oxygenation |
| SaO₂ | 95 - 100% | Hemoglobin saturation |
Simple rule: pH 7.40, PaCO₂ 40, HCO₃⁻ 24 are your anchor values.
3. Understanding pH - The Foundation
- pH < 7.35 = Acidosis (too much acid)
- pH > 7.45 = Alkalosis (too much base)
- pH 7.35-7.45 = Normal (but a disorder can still exist with compensation!)
The pH is governed by the Henderson-Hasselbalch relationship:
pH depends on the ratio of HCO₃⁻ (kidneys) to PaCO₂ (lungs)
Think of it this way:
- Lungs control CO₂ (respiratory component) - fast compensation (minutes to hours)
- Kidneys control HCO₃⁻ (metabolic component) - slow compensation (3-5 days)
4. The Four Primary Acid-Base Disorders
| Disorder | pH | Primary Change | Cause |
|---|---|---|---|
| Respiratory Acidosis | Low (<7.35) | PaCO₂ high (>45) | Hypoventilation - lung disease, sedation, neuromuscular |
| Respiratory Alkalosis | High (>7.45) | PaCO₂ low (<35) | Hyperventilation - anxiety, pain, PE, liver disease, altitude |
| Metabolic Acidosis | Low (<7.35) | HCO₃⁻ low (<22) | Diarrhea, DKA, lactic acidosis, renal failure |
| Metabolic Alkalosis | High (>7.45) | HCO₃⁻ high (>26) | Vomiting, diuretics, hypokalemia |
5. Compensation - The Body's Auto-Correction
When a primary disorder occurs, the other system tries to compensate to pull pH back toward normal. Compensation is never complete - it does not fully normalize pH.
| Primary Disorder | Compensatory Response |
|---|---|
| Metabolic acidosis | Increased ventilation (blows off CO₂, lowers PaCO₂) |
| Metabolic alkalosis | Decreased ventilation (retains CO₂, raises PaCO₂) |
| Respiratory acidosis | Kidneys retain HCO₃⁻ and excrete H⁺ |
| Respiratory alkalosis | Kidneys excrete HCO₃⁻ and retain H⁺ |
Compensation Formulas (Expected Compensation)
| Primary Disorder | Expected Compensation |
|---|---|
| Metabolic acidosis | ΔPaCO₂ = 1.3 × ΔHCO₃⁻ (Winter's formula) |
| Metabolic alkalosis | ΔPaCO₂ = 0.6 × ΔHCO₃⁻ |
| Acute resp. acidosis | HCO₃⁻ rises 1 mEq/L per 10 mmHg ↑ PaCO₂ |
| Chronic resp. acidosis | HCO₃⁻ rises 4 mEq/L per 10 mmHg ↑ PaCO₂ |
| Acute resp. alkalosis | HCO₃⁻ falls 2 mEq/L per 10 mmHg ↓ PaCO₂ |
| Chronic resp. alkalosis | HCO₃⁻ falls 5 mEq/L per 10 mmHg ↓ PaCO₂ |
Key point: If actual compensation does NOT match expected, a mixed disorder is present.
Here is the classic Acid-Base Map - it visually plots pH vs. PaCO₂ with HCO₃⁻ isopleths to identify simple and mixed disorders:
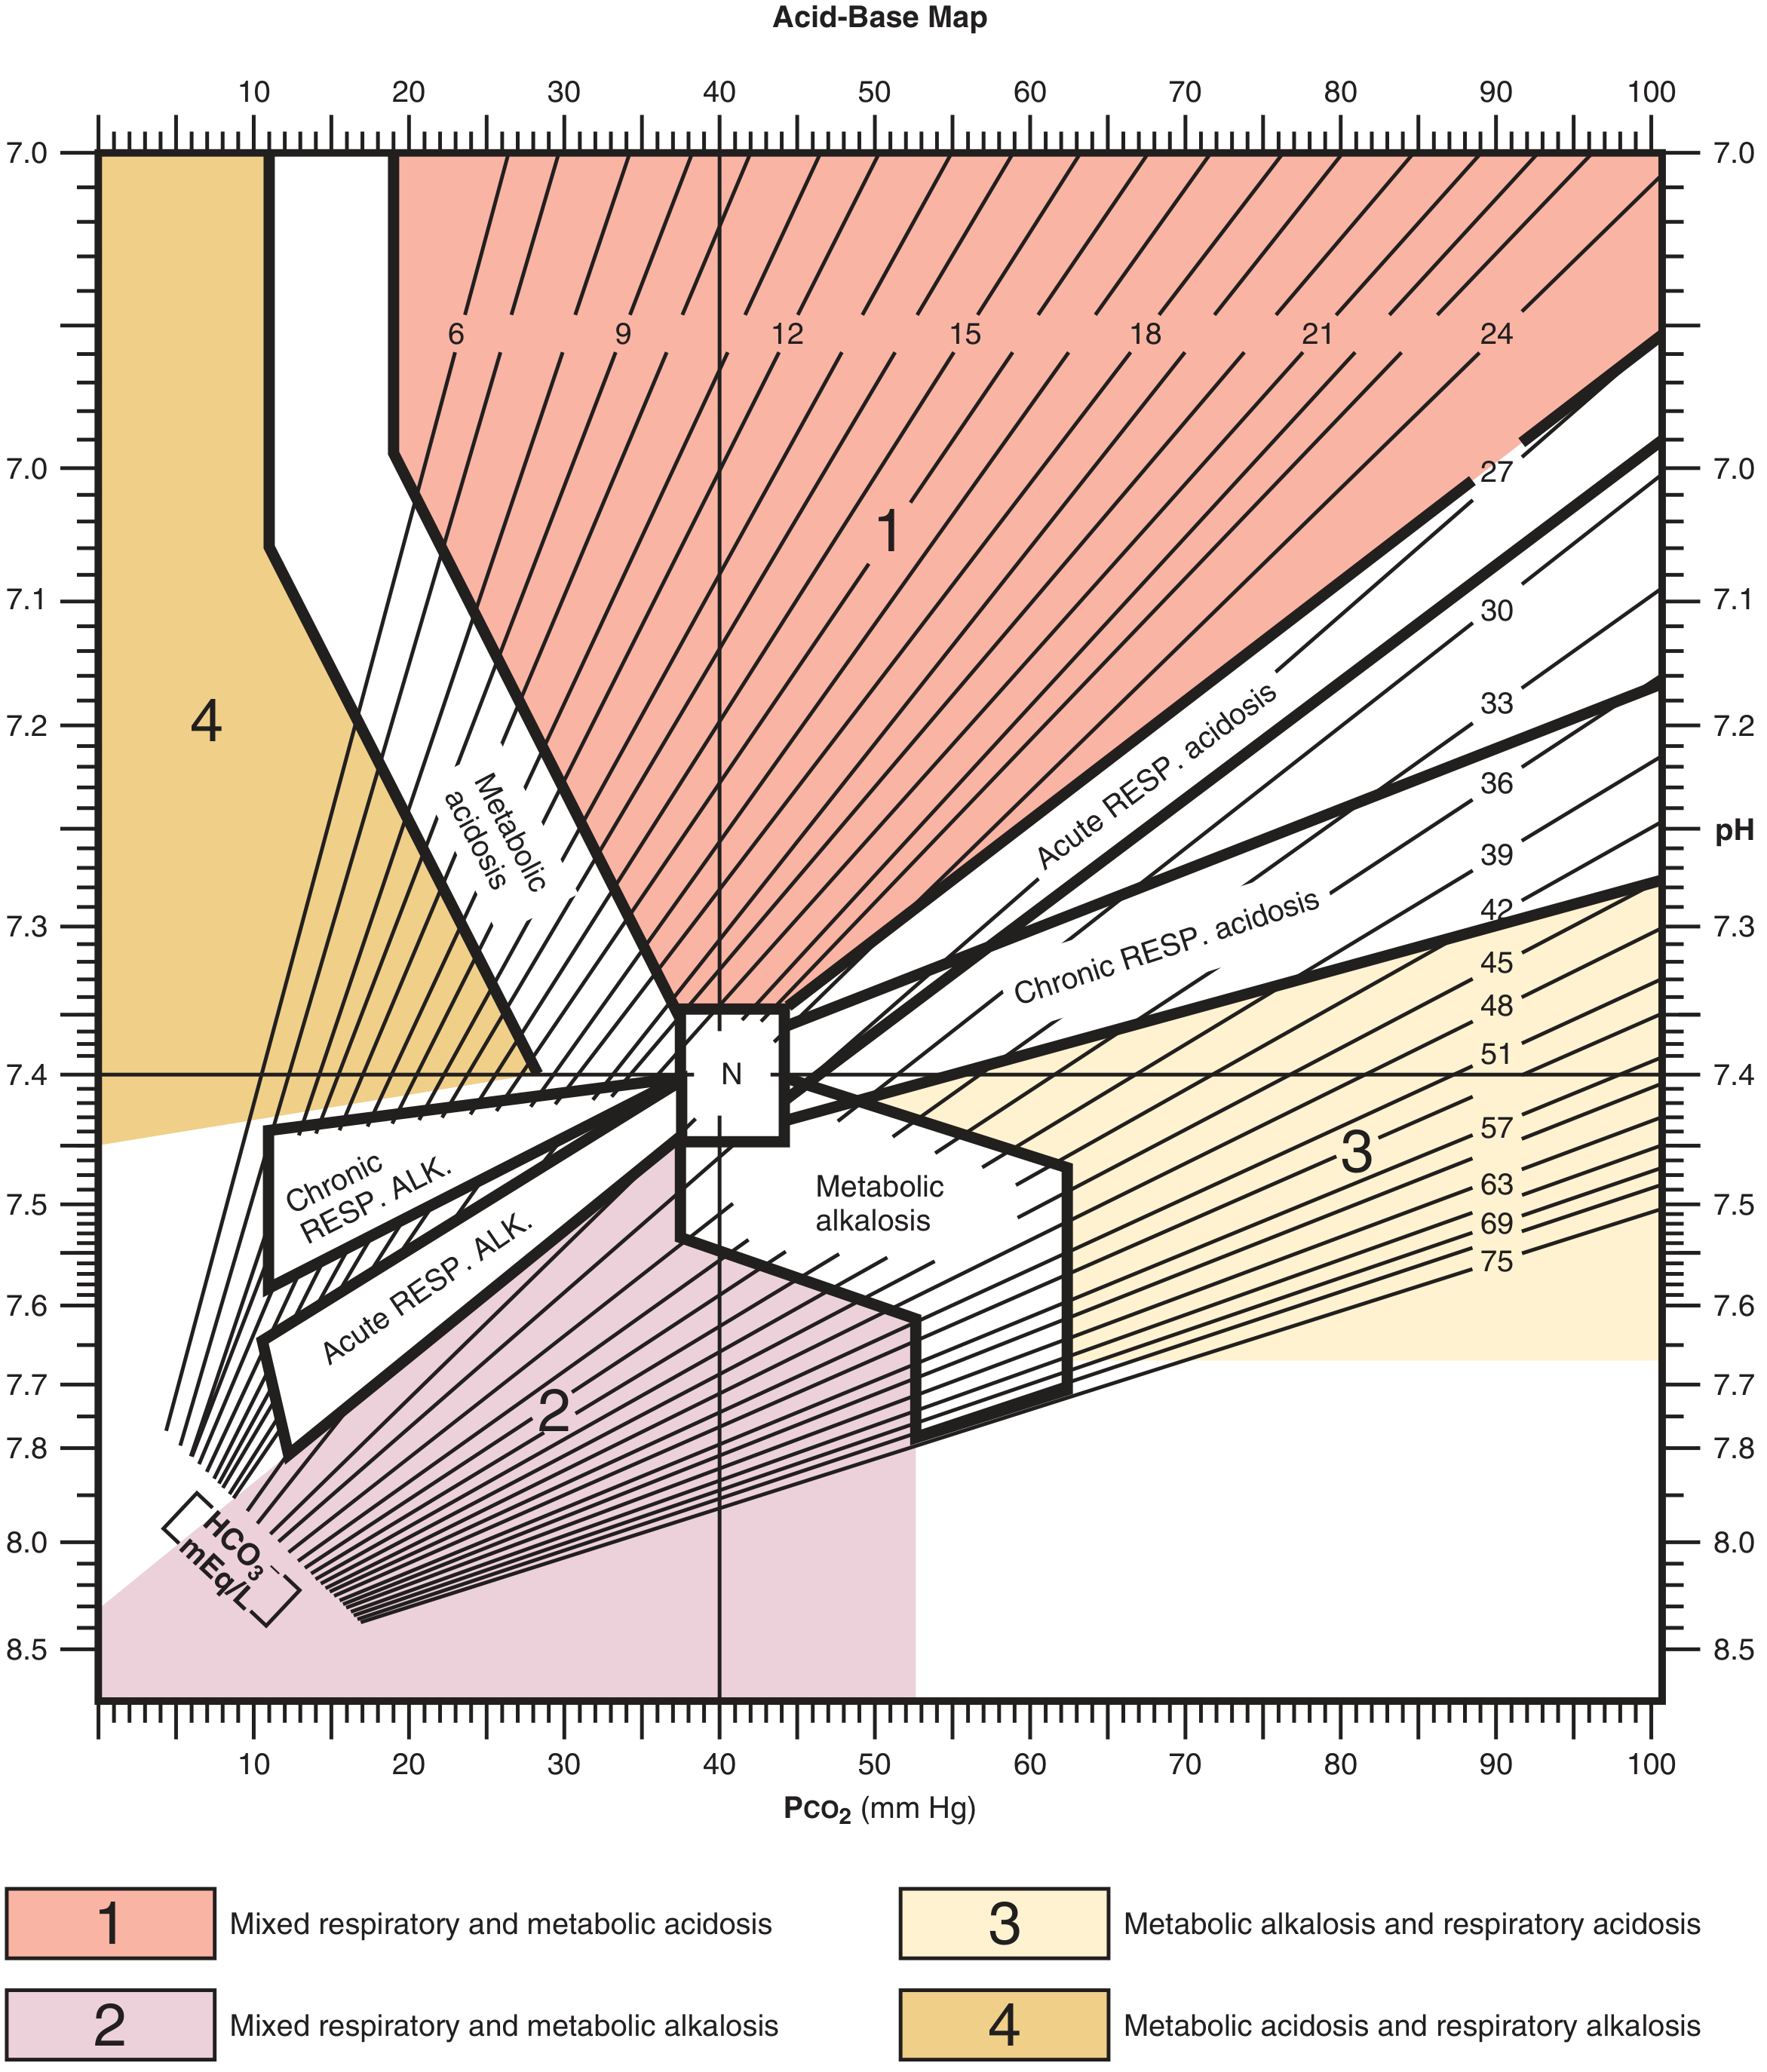
The "N" in the center is the normal point. Zone 1 = mixed resp+metabolic acidosis, Zone 2 = mixed resp+metabolic alkalosis, Zone 3 = metabolic alkalosis + resp acidosis, Zone 4 = metabolic acidosis + resp alkalosis.
6. Step-by-Step ABG Interpretation (The 5-Step Method)
Step 1: Is the pH acidotic or alkalotic?
- pH < 7.35 → Acidosis
- pH > 7.45 → Alkalosis
- pH 7.35-7.45 → Normal (but check if compensation is masking a disorder)
Step 2: Identify the primary cause - respiratory or metabolic?
- Look at PaCO₂ and HCO₃⁻
- If pH is low (acidosis):
- PaCO₂ high → Respiratory acidosis (CO₂ is acid)
- HCO₃⁻ low → Metabolic acidosis
- If pH is high (alkalosis):
- PaCO₂ low → Respiratory alkalosis
- HCO₃⁻ high → Metabolic alkalosis
- The parameter that matches the pH direction is the primary disorder
Step 3: Is compensation appropriate?
Use the formulas above. If the actual value differs from expected:
- Less compensation than expected → Second primary disorder adding to the problem
- More compensation than expected → Second primary disorder working against the first
Step 4: If metabolic acidosis - calculate the Anion Gap (AG)
Anion Gap = Na⁺ - (Cl⁻ + HCO₃⁻)
- Normal AG = 12 ± 4 mEq/L
- AG > 16 → Anion Gap Metabolic Acidosis (MUDPILES causes)
- AG normal → Non-Anion Gap Metabolic Acidosis (HARDUPS causes)
MUDPILES (high anion gap causes):
Methanol, Uremia, DKA, Propylene glycol/Paraldehyde, Isoniazid/Iron, Lactic acidosis, Ethylene glycol, Salicylates
HARDUPS (normal anion gap causes):
Hyperalimentation, Acetazolamide, Renal tubular acidosis, Diarrhea, Ureteral diversion, Pancreatic fistula, Saline infusion
Step 5: If AG metabolic acidosis - calculate the Delta-Delta (ΔΔ)
ΔAG = calculated AG - 12
In pure AG metabolic acidosis, ΔAG ≈ decrease in HCO₃⁻ (ratio ~1:1).
- If HCO₃⁻ is lower than expected from the ΔAG → also a non-AG metabolic acidosis
- If HCO₃⁻ is higher than expected from the ΔAG → also a metabolic alkalosis hidden underneath
7. Oxygenation Assessment
The ABG also tells you about oxygenation (separate from acid-base):
- PaO₂ normal: 80-100 mmHg
- PaO₂ 60-80 mmHg: Mild hypoxemia
- PaO₂ 40-60 mmHg: Moderate hypoxemia
- PaO₂ < 40 mmHg: Severe hypoxemia
The A-a Gradient (Alveolar-arterial oxygen gradient)
This tells you whether low O₂ is due to the lungs failing or something outside the lungs (hypoventilation only).
PAO₂ = FiO₂ × (Patm - PH₂O) - PaCO₂/0.8
- On room air (FiO₂ = 0.21): PAO₂ ≈ 150 - (PaCO₂ / 0.8)
- A-a gradient = PAO₂ - PaO₂
- Normal A-a gradient ≈ age/4 + 4 (increases with age)
| A-a Gradient | Interpretation |
|---|---|
| Normal (<15) | Hypoventilation or low FiO₂ - lungs are fine |
| Elevated (>15) | Lung pathology (pneumonia, PE, ARDS, pulmonary edema) |
8. Arterial vs. Venous Blood Gas
| Feature | Arterial (ABG) | Venous (VBG) |
|---|---|---|
| pH | Reference standard | ~0.05 lower than ABG |
| PaCO₂ | Reference standard | Up to 20 mmHg higher |
| PaO₂ | Reference standard | Cannot use for oxygenation |
| Lactate | Yes (standard) | Correlates well with ABG for normal/high values |
| Clinical use | Gold standard | Useful quick screen; abnormal values need ABG confirmation |
(Tintinalli's Emergency Medicine, p. 121)
9. Worked Examples
Example A - Metabolic Acidosis with Compensation
Values: Na⁺ 133, Cl⁻ 118, pH 7.26, PaCO₂ 13, HCO₃⁻ 5
- pH 7.26 → Acidosis
- HCO₃⁻ 5 (low) + PaCO₂ 13 (low) → Primary = metabolic acidosis (low HCO₃⁻ drives pH down; low PaCO₂ is compensation, not the cause)
- Expected PaCO₂ = 40 - (1.3 × (25-5)) = 40 - 26 = 14 mmHg → Actual is 13, almost exactly matching → compensation is appropriate, single disorder
- AG = 133 - (118 + 5) = 10 → Normal AG → Non-anion gap metabolic acidosis
- Cause: diarrhea (classic non-AG acidosis from HCO₃⁻ loss)
(Roberts & Hedges' Clinical Procedures in Emergency Medicine, p. 1734)
Example B - Lactic Acidosis in Sepsis
Values: Na⁺ 138, Cl⁻ 102, pH 7.29, PaCO₂ 30, HCO₃⁻ 14
- pH 7.29 → Acidosis
- HCO₃⁻ 14 (low) → Primary = metabolic acidosis
- AG = 138 - (102 + 14) = 22 → Elevated → Anion Gap metabolic acidosis
- Cause in context (hypotension + infection): lactic acidosis from septic shock
(Symptom to Diagnosis, p. 72)
10. Quick Reference Summary Table
| pH | PaCO₂ | HCO₃⁻ | Disorder |
|---|---|---|---|
| ↓ | ↑ | Normal (or ↑ if compensating) | Respiratory Acidosis |
| ↑ | ↓ | Normal (or ↓ if compensating) | Respiratory Alkalosis |
| ↓ | Normal (or ↓ if compensating) | ↓ | Metabolic Acidosis |
| ↑ | Normal (or ↑ if compensating) | ↑ | Metabolic Alkalosis |
Summary of the Learning Path
- Master normal values - pH 7.40, PaCO₂ 40, HCO₃⁻ 24
- Identify acidosis vs. alkalosis from pH
- Find the primary disorder - which parameter matches the pH change
- Check compensation using formulas - unmatch = mixed disorder
- Calculate anion gap in metabolic acidosis
- Calculate delta-delta to find hidden second disorder
- Assess oxygenation via PaO₂ and A-a gradient separately
Once you're comfortable with simple disorders, practice with clinical cases involving mixed disorders - that's where ABG interpretation truly shines.
Would you like to go deeper into any specific area - such as:
- Mixed acid-base disorders with practice cases?
- Causes and management of each disorder?
- Oxygenation failures and the A-a gradient?
- A practice quiz with ABG values to interpret?
He bro my chats on ecg are lost
That's frustrating, sorry to hear that! Unfortunately, I don't have access to your previous chat history - each conversation starts fresh and I can't retrieve past sessions.
But no worries - just tell me where you left off or what topics you'd covered, and I'll rebuild it all for you right here. For example:
- Were you learning ECG basics (leads, waves, intervals)?
- Or more advanced stuff like arrhythmias, MI patterns, blocks?
- Or a specific topic like STEMI localisation or axis deviation?
Just let me know and we'll pick up right where you were!
I want to learn various abonarmailties of ecg
Asking for Preferences
Reading File
Finding Sources
Finding Sources
Finding Sources
Finding Sources
Finding Sources
Finding Sources
Finding Sources
Reading File
Reading File
Reading File
Loading Image
Reading File
Finding Sources
Finding Sources
Finding Sources
Reading File
Reading File
Reading File
Loading Image
Loading Image
Loading Image
I now have rich content from multiple authoritative sources. Let me compile the comprehensive ECG abnormalities guide.
ECG Abnormalities - A Comprehensive Guide
Sources: Rosen's Emergency Medicine - Tintinalli's Emergency Medicine - Frameworks for Internal Medicine - Goldman-Cecil Medicine - Miller's Anesthesia
Since you already know P, QRS, and T waves, we'll build directly on that to cover all major ECG abnormalities systematically.
Overview: Categories of ECG Abnormalities
There are 6 major categories to master:
- Rate & Rhythm abnormalities (arrhythmias)
- Conduction blocks (AV blocks, bundle branch blocks)
- Ischemia & Infarction (ST changes, Q waves)
- Chamber enlargement (hypertrophy, dilation)
- Interval abnormalities (PR, QRS, QT)
- Miscellaneous (electrolyte effects, pericarditis, WPW)
Category 1: Rate & Rhythm Abnormalities
Normal Sinus Rhythm (your baseline reference)
- Rate: 60-100 bpm
- Every P wave followed by a QRS
- Regular P-P and R-R intervals
- PR interval: 120-200 ms
1A. Sinus Tachycardia
- Rate > 100 bpm
- Normal P before every QRS, normal morphology
- Causes: fever, pain, hypovolemia, anxiety, PE, hyperthyroidism
- Not a primary rhythm problem - treat the cause
1B. Sinus Bradycardia
- Rate < 60 bpm
- Normal P before every QRS
- Causes: athletes, vagal tone, beta-blockers, hypothyroidism, inferior MI
- Treat only if symptomatic
1C. Atrial Fibrillation (AF)
The most common sustained arrhythmia
ECG features:
- No visible P waves - replaced by chaotic, irregular fibrillatory (f) waves
- Irregularly irregular R-R intervals (classic)
- Narrow QRS usually (unless aberrant conduction)
- Rate usually 100-160 bpm if uncontrolled
Memory trick: "No P, Irregular, Irregular"
Causes: Hypertension, valvular disease, heart failure, alcohol (holiday heart), hyperthyroidism, ischemia
1D. Atrial Flutter
ECG features:
- Sawtooth flutter (F) waves at ~300/min, best seen in II, III, aVF
- Regular atrial rate ~300; ventricular rate depends on AV block ratio (usually 2:1 = 150 bpm, or 4:1 = 75 bpm)
- Regular R-R intervals (unlike AF)
Memory trick: "Sawtooth = Flutter" - look for the sawtooth in the inferior leads
1E. Supraventricular Tachycardia (SVT)
ECG features:
- Sudden onset narrow-complex tachycardia, rate 150-250 bpm
- P waves often buried in or just after the QRS (retrograde P)
- Regular R-R intervals
- Abrupt start and stop ("paroxysmal")
Types:
- AVNRT (most common) - retrograde P just after QRS, "pseudo-R'" in V1
- AVRT (WPW pathway) - delta wave at baseline
- Atrial tachycardia - abnormal P wave morphology before each QRS
1F. Ventricular Tachycardia (VT)
ECG features:
- Wide QRS (>120 ms), rate >100 bpm (usually 150-250 bpm)
- Regular or slightly irregular
- AV dissociation (P waves marching independently, no relationship to QRS) - pathognomonic
- Capture beats (narrow QRS amid wide complexes) - confirms VT
- Fusion beats (partially conducted beat) - confirms VT
- Concordance: all QRS in precordial leads pointing same direction (positive or negative)
Key rule: Wide-complex tachycardia = VT until proven otherwise (never assume SVT with aberrancy in an unstable patient)
1G. Ventricular Fibrillation (VF)
- Completely chaotic, irregular, no organized complexes
- No QRS, no P, no T visible
- Immediately life-threatening - start CPR
Category 2: Conduction Blocks
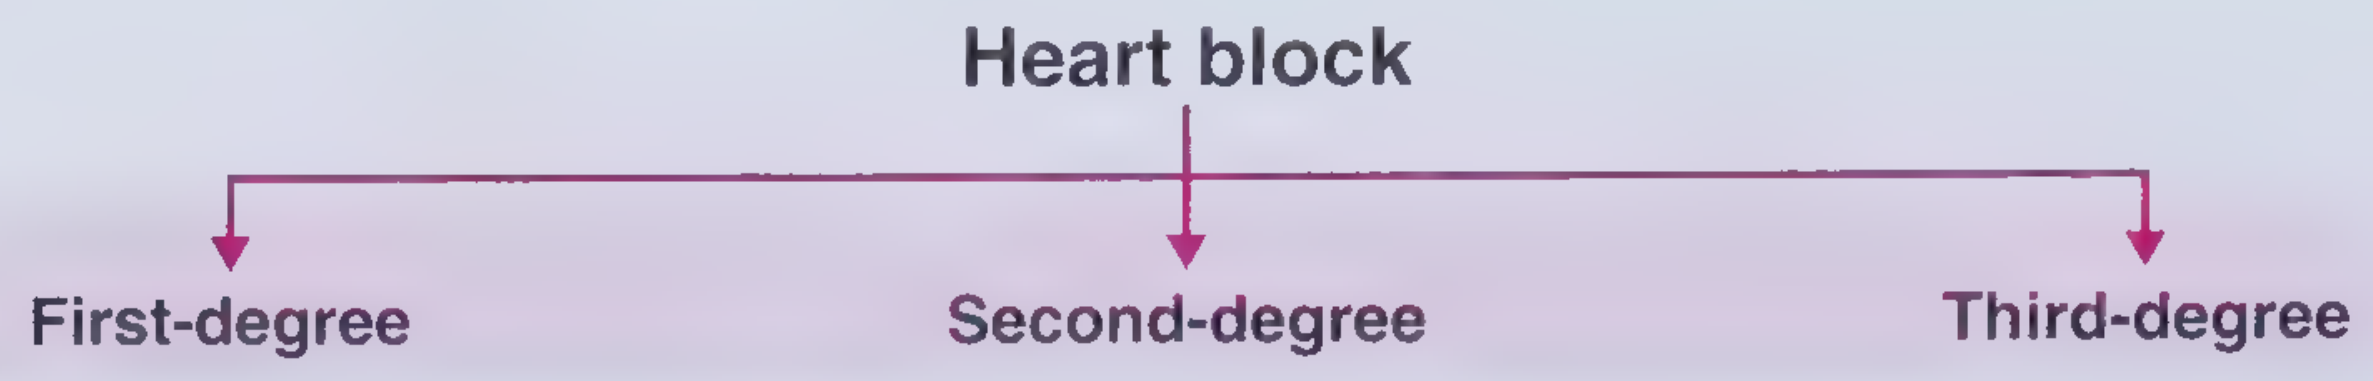
2A. AV Blocks (Heart Block)
The AV node controls the gate between atria and ventricles. Damage to this gate = heart block.
First-Degree AV Block
- PR interval > 200 ms (>5 small squares) on ECG
- Every P wave still conducts to QRS - no dropped beats
- Usually benign, no treatment needed
- Prevalence ~1% in people under 60
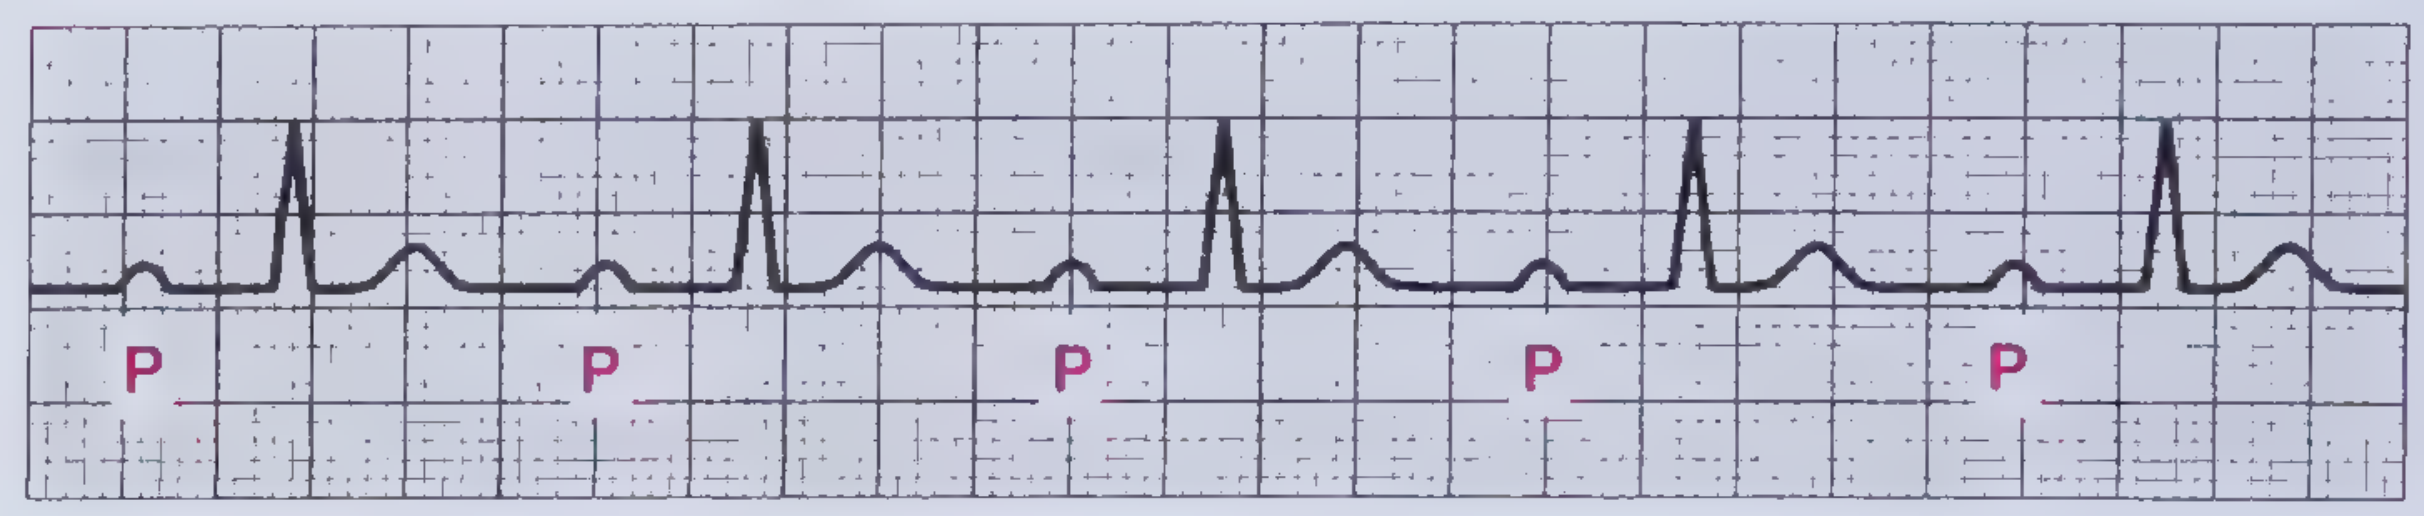
Each P (marked) is followed by a QRS, but the PR interval is longer than normal.
Second-Degree AV Block - Type I (Wenckebach / Mobitz I)
- PR interval progressively lengthens beat by beat until one P wave is blocked (dropped QRS)
- Pattern then resets and repeats
- Block is at the AV node level
- Usually benign, often asymptomatic, may resolve
- Common in inferior MI (RCA supplies AV node in 80%)
Memory trick: "Longer, longer, longer, DROP - then you have a Wenckebach block"
Second-Degree AV Block - Type II (Mobitz II)
- PR interval is constant but suddenly a P wave is not followed by QRS (dropped beat)
- No warning - the drop is sudden
- Block is below the AV node (in His-Purkinje system)
- More dangerous - can progress to complete heart block
- Requires pacemaker
Memory trick: "Mobitz II = Suddenly Missing" (the QRS drops without warning)
Third-Degree AV Block (Complete Heart Block)
- Complete AV dissociation - P waves and QRS complexes march independently
- P rate ≠ QRS rate (P rate usually faster, ~70-80; escape QRS rate ~30-40 if ventricular)
- Wide escape QRS (idioventricular) if block is below His; narrow if junctional escape
- Life-threatening - causes syncope, hemodynamic collapse
- Requires emergency pacing
ECG clue: Count P waves and QRS separately - they are unrelated to each other.
(Miller's Anesthesia, 10e, p. 12222)
2B. Bundle Branch Blocks (BBB)
The bundle branches carry impulses to the left and right ventricles. When blocked, one ventricle depolarizes late, causing a wide QRS (>120 ms).
Right Bundle Branch Block (RBBB)
ECG features:
- Wide QRS > 120 ms
- rSR' pattern in V1 ("M-shape" or "rabbit ears")
- Wide, slurred S wave in leads I, V5, V6
- ST depression and T-wave inversion in right precordial leads (V1-V3) - secondary changes, not ischemia
Memory trick for BBB: "WiLLiaM MaRRoW"
- WiLLiaM: In LBBB - W pattern in V1, M pattern in V5/V6
- MaRRoW: In RBBB - M pattern in V1, W pattern in V5/V6
RBBB: Wide QRS with rSR' pattern in V1 and wide terminal S in V5/V6.
Left Bundle Branch Block (LBBB)
ECG features:
- Wide QRS > 120 ms
- Broad, notched (M-shaped) R wave in I, aVL, V5, V6 (lateral leads)
- Small r and deep S in V1-V3 (right precordial leads)
- No septal Q waves in lateral leads (septum depolarizes right to left - reversed)
- T waves and ST segments discordant (opposite direction) to QRS
Clinical importance: New LBBB with chest pain is treated as a STEMI equivalent. LBBB makes interpreting ischemia very difficult.
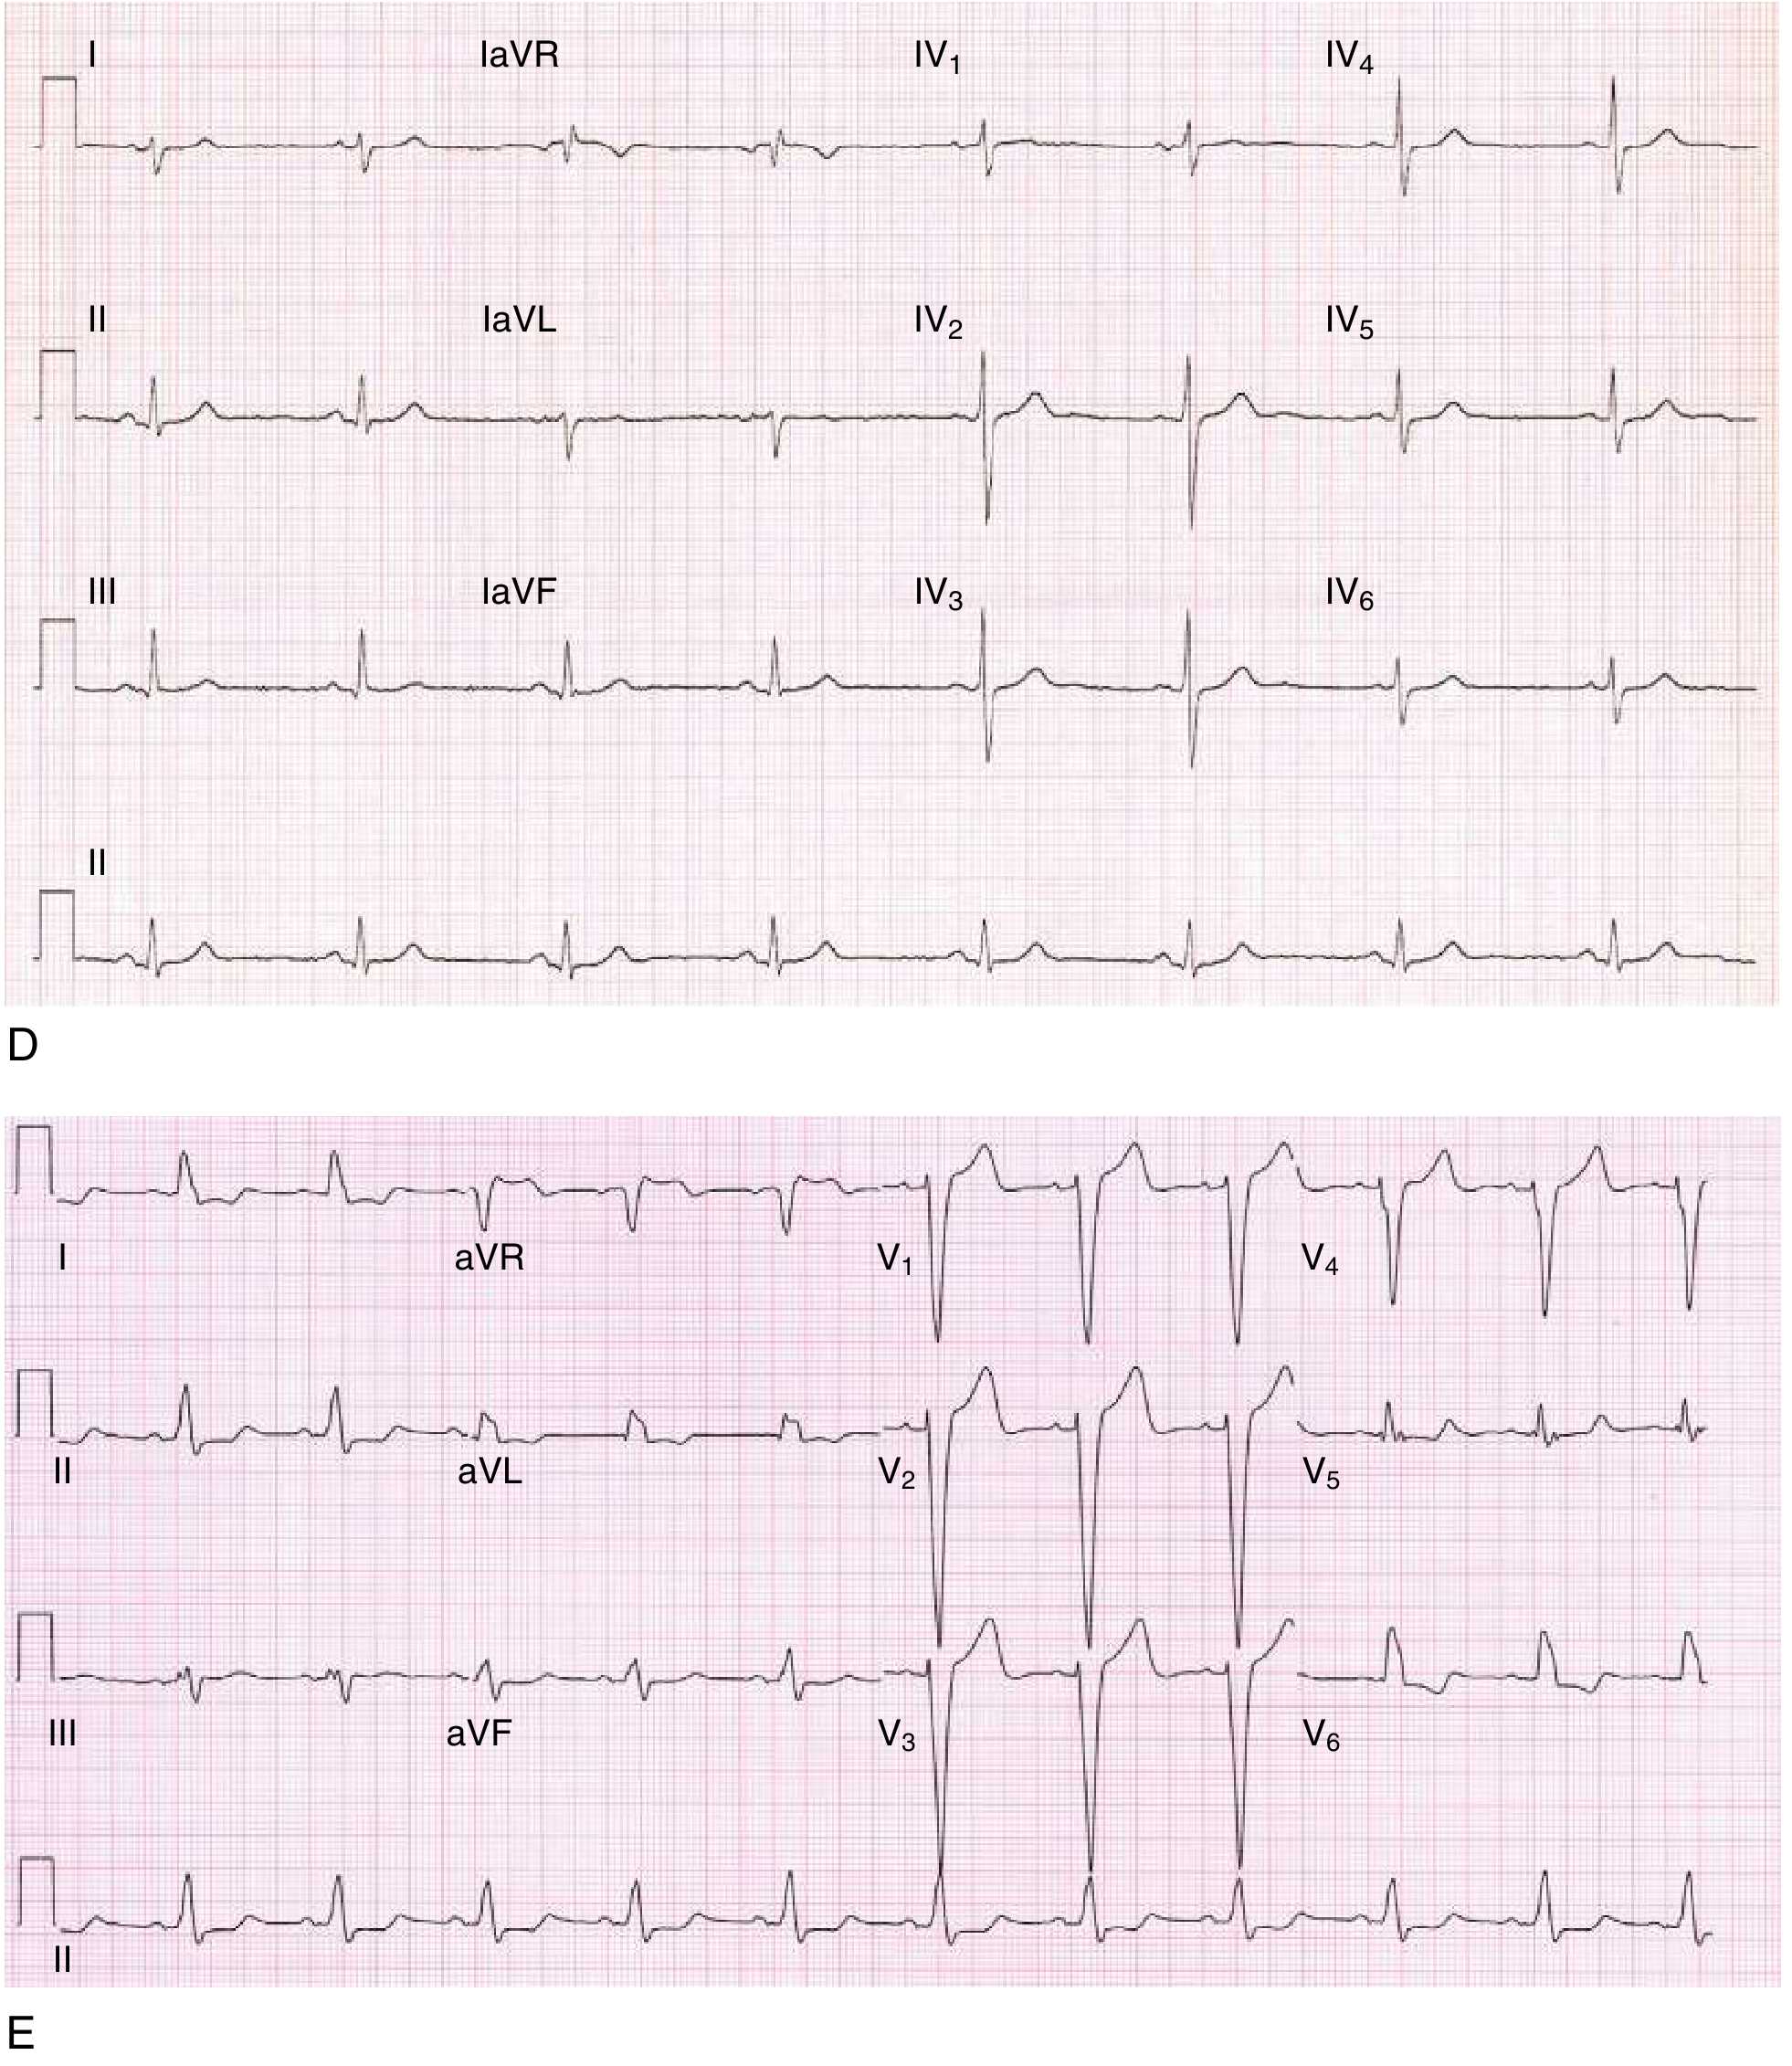
Top (D): Left posterior fascicular block. Bottom (E): LBBB - note the broad, notched R waves in lateral leads and deep S waves in V1-V3.
(Goldman-Cecil Medicine, p. 426-427)
Category 3: Ischemia & Myocardial Infarction
This is the most clinically urgent category. The ECG changes in MI follow a time sequence.
Timeline of MI Changes
| Time | ECG Change |
|---|---|
| Minutes (earliest) | Hyperacute T waves (tall, broad, peaked) |
| Hours | ST elevation (convex/tombstone) |
| Hours-Days | Q wave formation (pathological) |
| Days-Weeks | T-wave inversion |
| Weeks-permanent | Persistent Q waves (scar) |
Hyperacute T Waves (Earliest Sign)
- Tall, broad, peaked T waves in the affected territory
- Often missed - this is the "pre-STEMI" phase
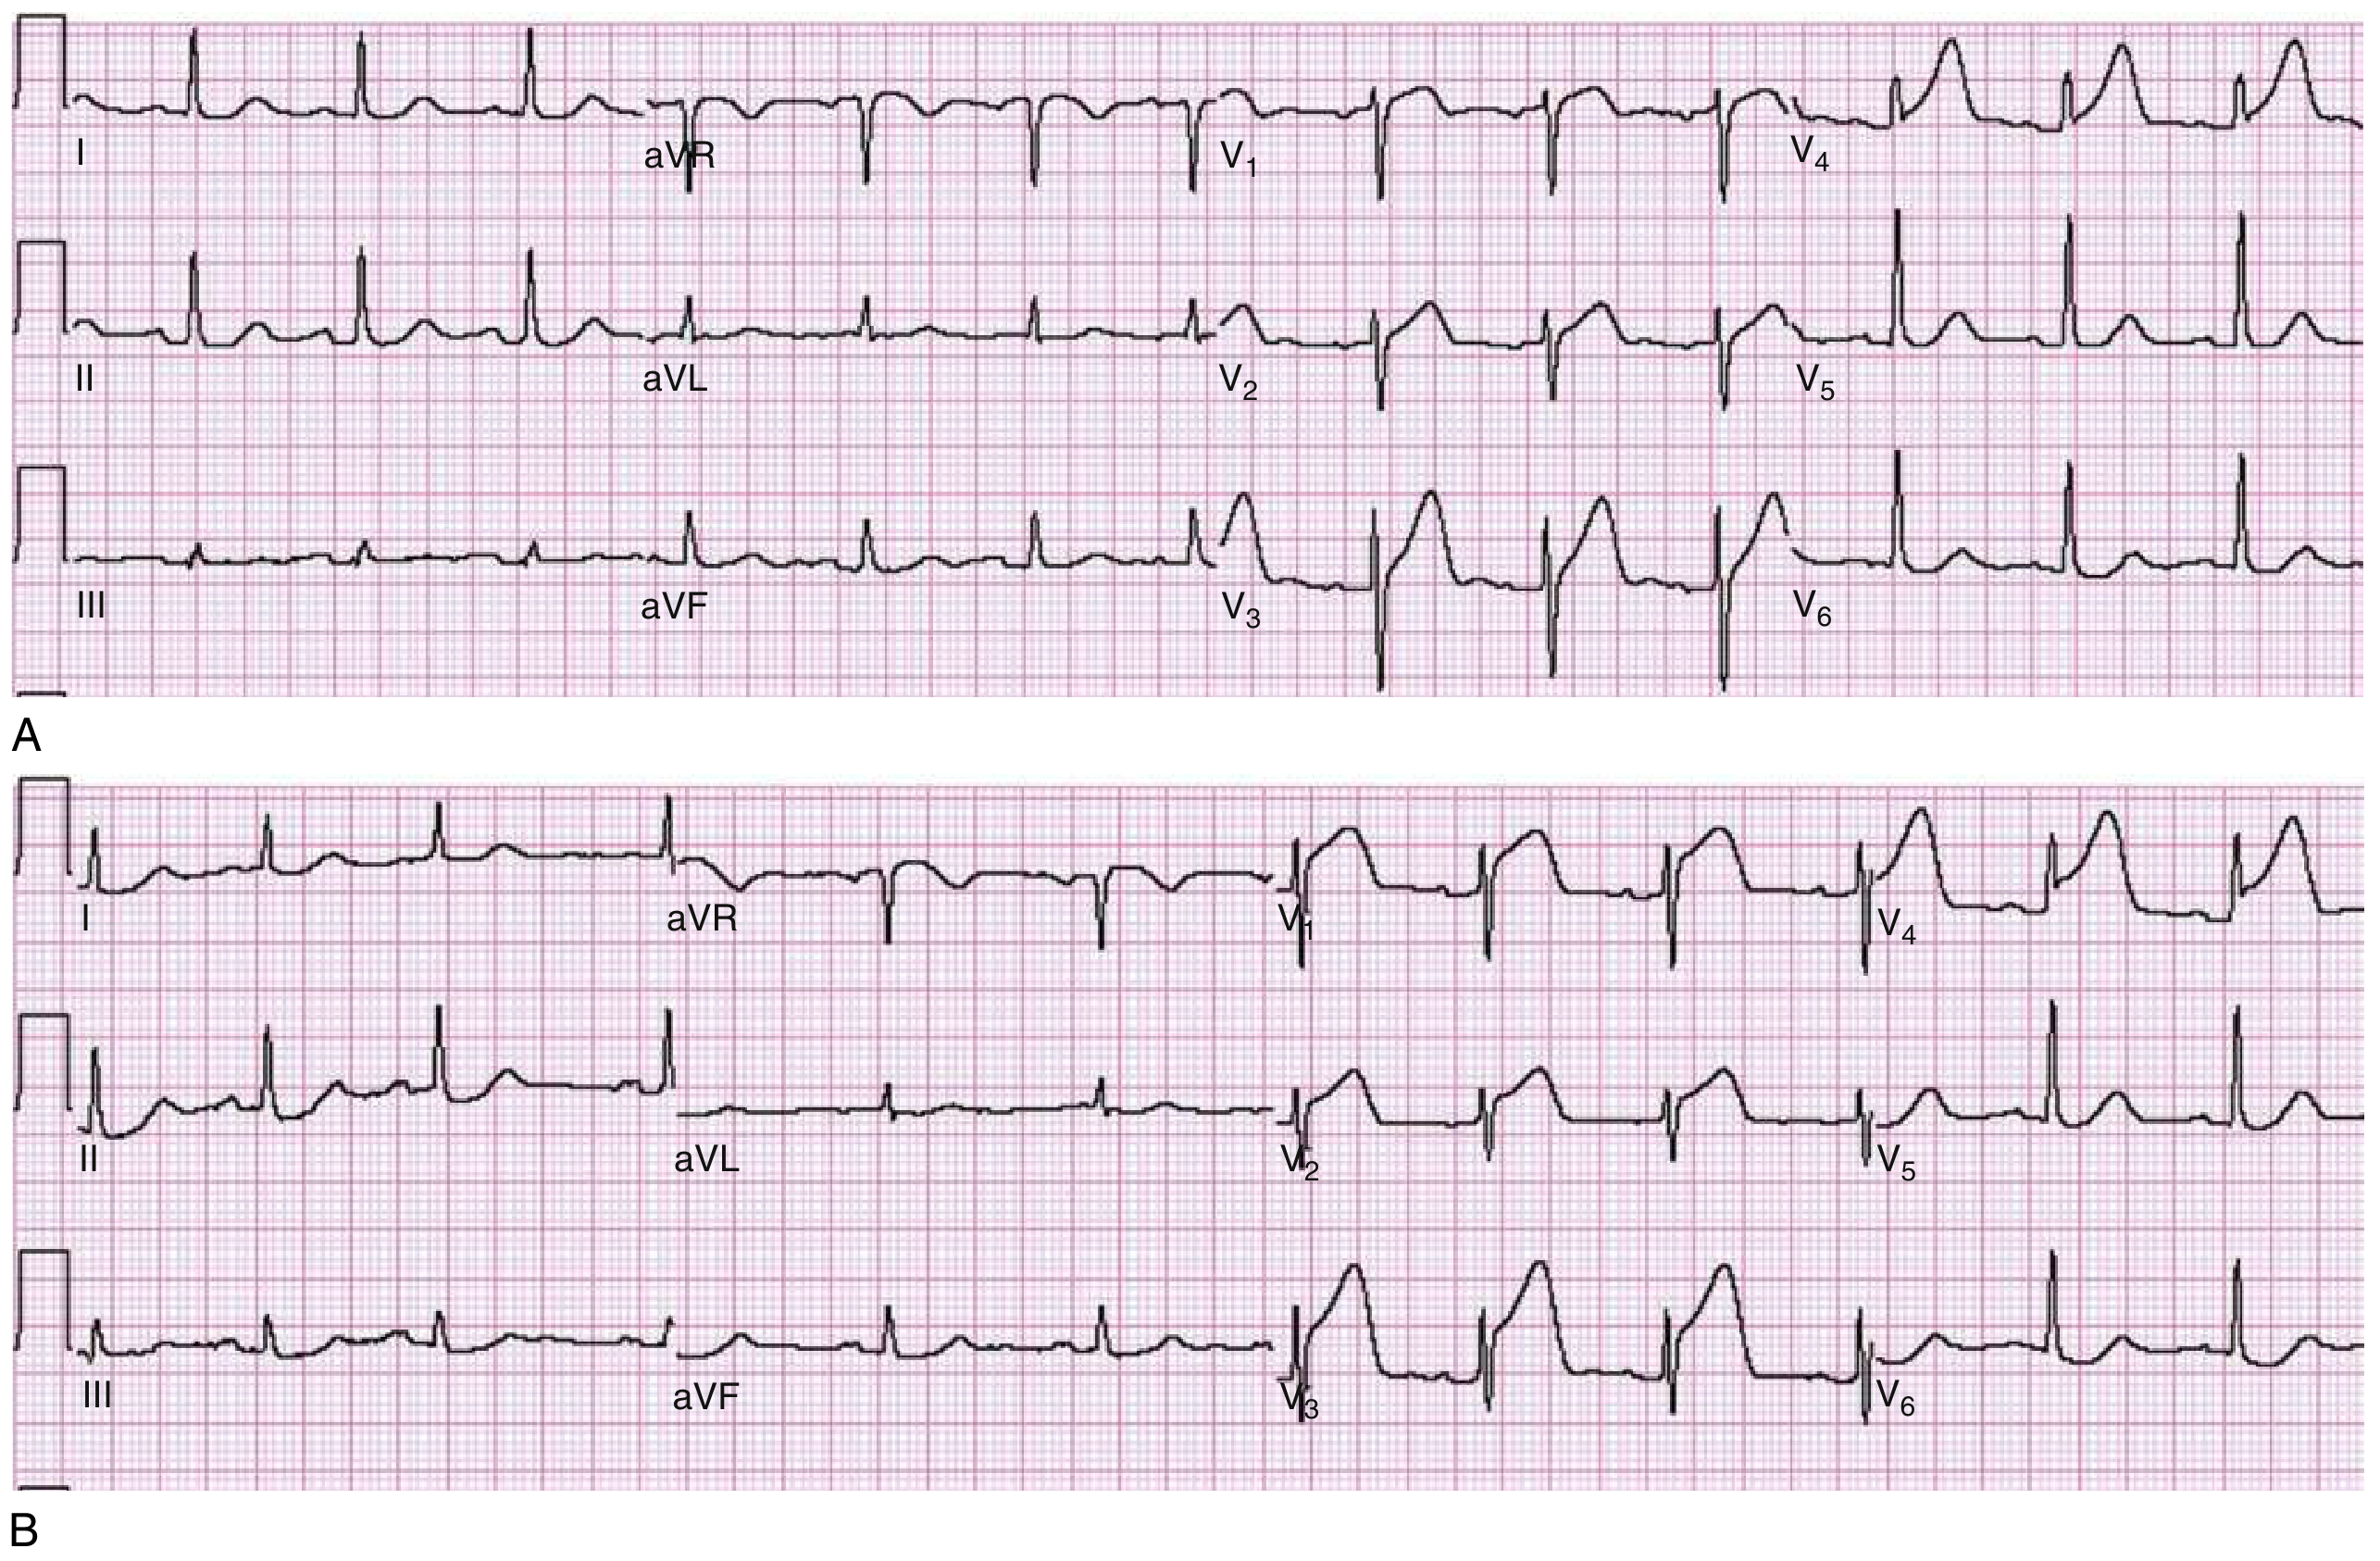
Tracing A: Broad, tall hyperacute T waves in V3-V4. Tracing B: Same patient 30 minutes later - frank ST elevation now visible in V1-V4.
ST Elevation - STEMI Localisation
Criteria for STEMI: ≥1 mm ST elevation in 2 contiguous leads (≥2 mm in V1-V3 in men)
| Territory | Elevated Leads | Artery Involved |
|---|---|---|
| Anteroseptal | V1, V2, (V3) | LAD (proximal) |
| Anterior | V1-V4 | LAD |
| Anterolateral | V1-V6, I, aVL | LAD (large) |
| Lateral | I, aVL | LCx or diagonal |
| Inferior | II, III, aVF | RCA (80%) or LCx |
| Posterior | Tall R in V1-V2, ST depression V1-V2 | RCA or LCx |
| Right ventricular | V3R-V6R (right-sided leads) | RCA proximal |
Reciprocal changes: ST depression in leads opposite the infarct - confirms STEMI and indicates larger territory at risk.
(Tintinalli's Emergency Medicine, Table 49-4)
Pathological Q Waves (Old MI Marker)
- Width ≥ 40 ms (1 small square) OR depth ≥ 25% of the following R wave
- Indicate transmural necrosis (irreversible)
- May persist for life as a "scar marker"
ST Depression (Subendocardial Ischemia / NSTEMI)
- Horizontal or downsloping ST depression ≥ 0.5-1 mm
- Represents subendocardial ischemia (NSTEMI or unstable angina)
- Diffuse ST depression with ST elevation in aVR = left main or proximal LAD occlusion
ST Elevation Mimics (Not Always MI!)
| Condition | ECG Clue |
|---|---|
| Pericarditis | Diffuse ST elevation (all leads except aVR), concave shape, PR depression |
| Benign Early Repolarization | Concave ST elevation in precordial leads, J-point notching, young males, stable |
| LBBB | Wide QRS, discordant ST changes, no Q waves |
| LV Aneurysm | Persistent ST elevation weeks after MI, no symptoms |
| Hypertrophic cardiomyopathy | Strain pattern + voltage criteria |
| Brugada pattern | ST elevation in V1-V2 with RBBB morphology |
(Rosen's Emergency Medicine, pp. 1000-1007)
Category 4: Chamber Enlargement
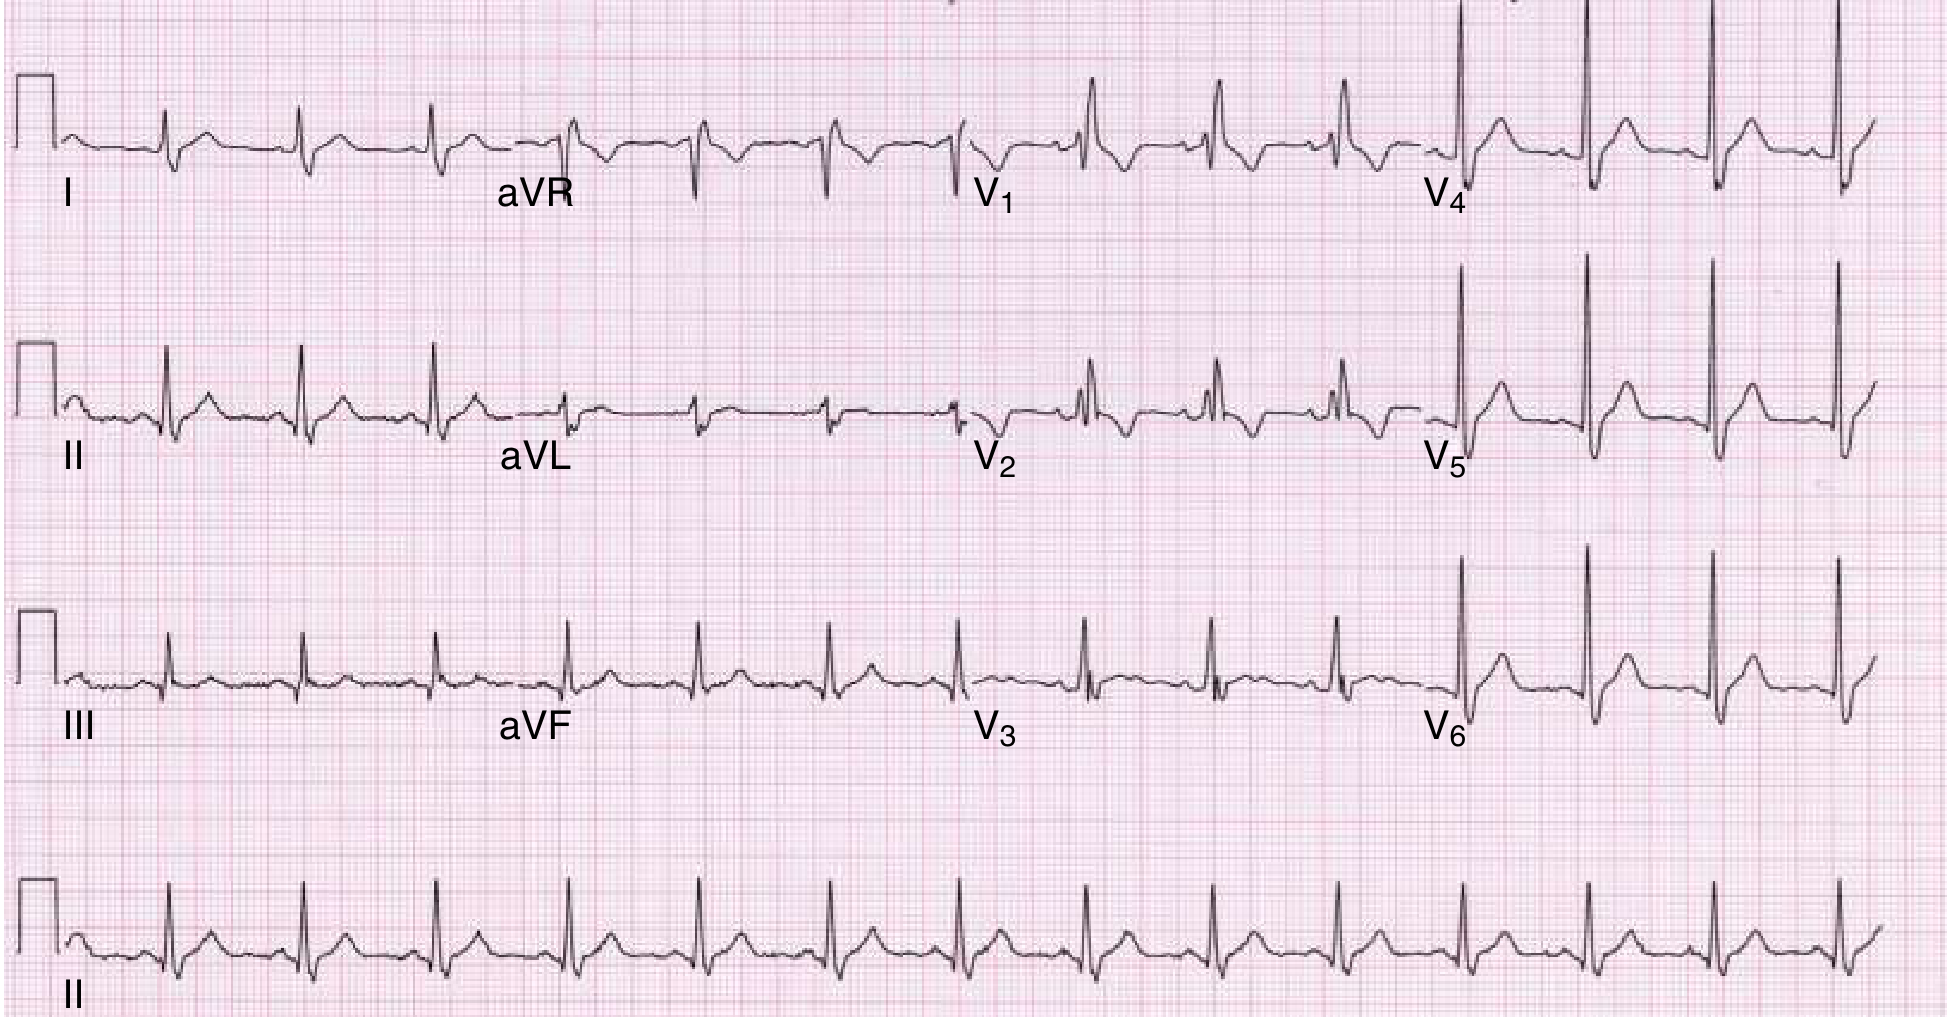
Left Ventricular Hypertrophy (LVH)
- Sokolow-Lyon criterion: S in V1 + R in V5 or V6 > 35 mm
- Cornell criterion: R in aVL + S in V3 > 28 mm (men) or > 20 mm (women)
- Associated "strain pattern": ST depression + T-wave inversion in lateral leads (I, aVL, V5-V6)
- Sensitivity only 30-50%, but specificity 85-95%
Right Ventricular Hypertrophy (RVH)
- Tall R wave in V1 (R > S in V1)
- Right axis deviation (> +90°)
- ST depression + T inversion in V1-V3 (strain pattern)
- Causes: pulmonary hypertension, COPD, congenital heart disease
Left Atrial Enlargement (P mitrale)
- Broad, notched P wave in lead II ("M-shaped P") - duration > 120 ms
- Biphasic P in V1 with wide, deep terminal negative component
- Cause: mitral stenosis/regurgitation, LV failure
Right Atrial Enlargement (P pulmonale)
- Tall, peaked P wave > 2.5 mm in lead II
- Cause: COPD, pulmonary hypertension, tricuspid disease
Category 5: Interval Abnormalities
Prolonged QT Interval
- Corrected QT (QTc) = QT / √RR (Bazett's formula)
- Normal QTc: < 440 ms (men), < 460 ms (women)
- QTc > 500 ms = high risk of Torsades de Pointes (a dangerous VT)
Causes of long QT:
- Drugs: Amiodarone, sotalol, haloperidol, erythromycin, methadone, chloroquine
- Electrolytes: Hypokalemia, hypomagnesemia, hypocalcemia
- Congenital: Long QT syndrome (Romano-Ward, Jervell-Lange-Nielsen)
- Cardiac: Myocarditis, bradycardia
Short QT
- QTc < 360 ms
- Associated with hypercalcemia, digoxin, short QT syndrome
- Risk of VF
Prolonged PR (First-degree block - covered above)
Wide QRS (>120 ms)
- RBBB, LBBB, ventricular paced rhythm, hyperkalemia, toxicity (Na channel blockers)
Category 6: Miscellaneous Important Patterns
6A. Wolff-Parkinson-White (WPW)
ECG features:
- Short PR < 120 ms (pre-excitation via accessory pathway)
- Delta wave (slurred upstroke of QRS)
- Wide QRS
- Risk: can conduct AF rapidly at 300+ bpm → VF
6B. Hyperkalemia (Peaked T waves → Sine Wave → VF)
Progressive ECG changes with rising K+:
- Tall, peaked, narrow ("tented") T waves (K > 5.5)
- Prolonged PR, widened QRS (K > 6.5)
- Loss of P waves (K > 7)
- Sine wave pattern (K > 8)
- VF / asystole
6C. Hypokalemia
- Flattened T waves
- Prominent U waves (positive deflection after T wave, best in V2-V3)
- ST depression
- Prolonged QU interval (often mistaken for long QT)
6D. Pericarditis
- Diffuse saddle-shaped (concave) ST elevation in most leads except aVR (ST depression in aVR)
- PR depression (most specific, best in II and V6)
- Evolves through 4 stages over days-weeks
- No reciprocal changes (unlike STEMI)
6E. Pulmonary Embolism (PE)
- Most common: Sinus tachycardia
- Classic (but uncommon, <20%): S1Q3T3 pattern - deep S in lead I, Q wave and T inversion in lead III
- Right heart strain: right axis deviation, RBBB, T-wave inversions in V1-V4
- Atrial fibrillation in 10-35% of cases
Quick Reference Summary Table
| Abnormality | Key ECG Finding |
|---|---|
| Atrial fibrillation | No P waves, irregularly irregular |
| Atrial flutter | Sawtooth F waves ~300/min |
| SVT | Narrow QRS tachycardia, P buried in QRS |
| VT | Wide QRS >100 bpm, AV dissociation |
| 1st degree AV block | PR > 200 ms |
| 2nd degree Mobitz I | Progressive PR lengthening → dropped QRS |
| 2nd degree Mobitz II | Constant PR → sudden dropped QRS |
| 3rd degree (complete) | P and QRS completely independent |
| RBBB | rSR' in V1, wide S in I/V5/V6 |
| LBBB | Broad notched R in I/V5/V6, deep S in V1 |
| STEMI inferior | ST elevation in II, III, aVF |
| STEMI anterior | ST elevation in V1-V4 |
| Old MI | Pathological Q waves |
| Pericarditis | Diffuse concave ST elevation, PR depression |
| LVH | S(V1) + R(V5) > 35 mm |
| Hyperkalemia | Peaked T → wide QRS → sine wave |
| Long QT | QTc > 440 ms, risk of Torsades |
| WPW | Short PR, delta wave |
Systematic Approach to Reading ANY ECG
Use this order every time so you never miss anything:
- Rate - count R-R intervals (300/number of big squares between beats)
- Rhythm - regular or irregular? P before every QRS?
- Axis - normal (-30° to +90°)?
- P wave - present, normal shape, duration?
- PR interval - 120-200 ms?
- QRS - narrow (<120 ms) or wide? Morphology?
- ST segment - elevation, depression, flat?
- T wave - upright, inverted, peaked?
- QT interval - calculate QTc
- Look for extras - U waves, delta waves, Q waves?
Would you like to go deeper into any specific section? I can do:
- Practice cases with real ECG patterns to interpret
- Deep dive into MI localisation and reciprocal changes
- Arrhythmia algorithms (when to cardiovert, when to use drugs)
- Torsades de Pointes and long QT management
Search for ECG images of each abnormality
Finding Sources
Finding Sources
Finding Sources
Finding Sources
Reading File
Reading File
Reading File
Reading File
Reading File
Reading File
Reading File
Reading File
Reading File
Reading File
Finding Sources
Finding Sources
Reading File
Reading File
Reading File
Reading File
Reading File
Reading File
Reading File
Reading File
Reading File
Reading File
Reading File
Reading File
Reading File
Reading File
Reading File
Loading Image
Loading Image
Loading Image
Loading Image
Loading Image
Loading Image
Loading Image
Loading Image
Loading Image
Loading Image
Here is the complete visual ECG atlas from the medical library. All images are from authoritative textbooks (Tintinalli's Emergency Medicine, Rosen's Emergency Medicine, Braunwald's Heart Disease, Goldman-Cecil Medicine, Morgan & Mikhail's Anesthesiology).
ECG Abnormalities - Visual Atlas
1. Atrial Fibrillation (AF)
What to look for: No P waves, chaotic baseline, irregularly irregular R-R intervals.
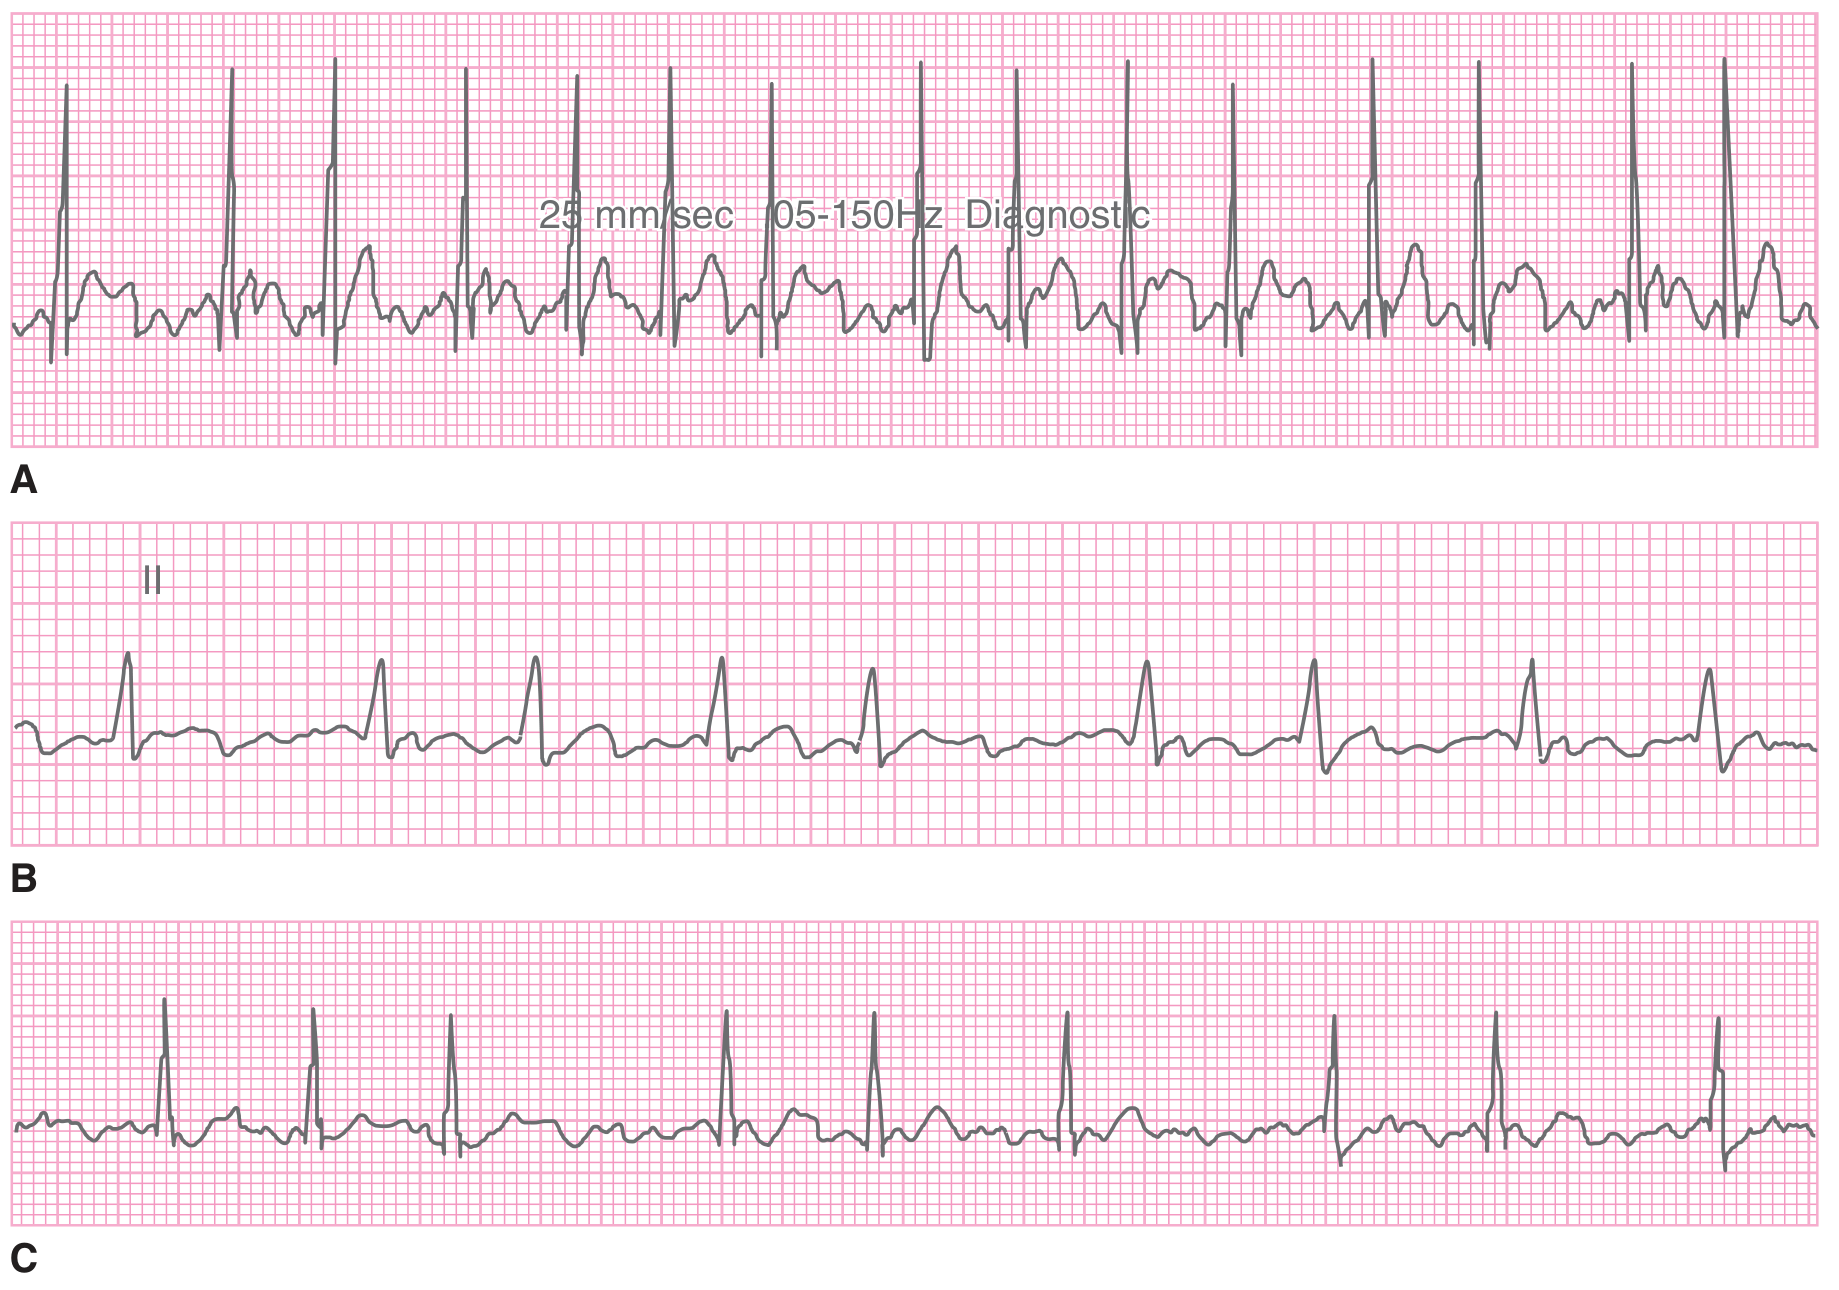
Three real examples of AF. Strip A (top): fast ventricular rate ~150 bpm. Strip B (middle): controlled rate ~80 bpm. Strip C (bottom): slower rate. Key: no organized P waves anywhere, beat-to-beat intervals are always different.
2. Ventricular Tachycardia (VT) - Monomorphic
What to look for: Wide QRS (>120 ms), fast regular rate >100 bpm, no P waves associated with QRS.
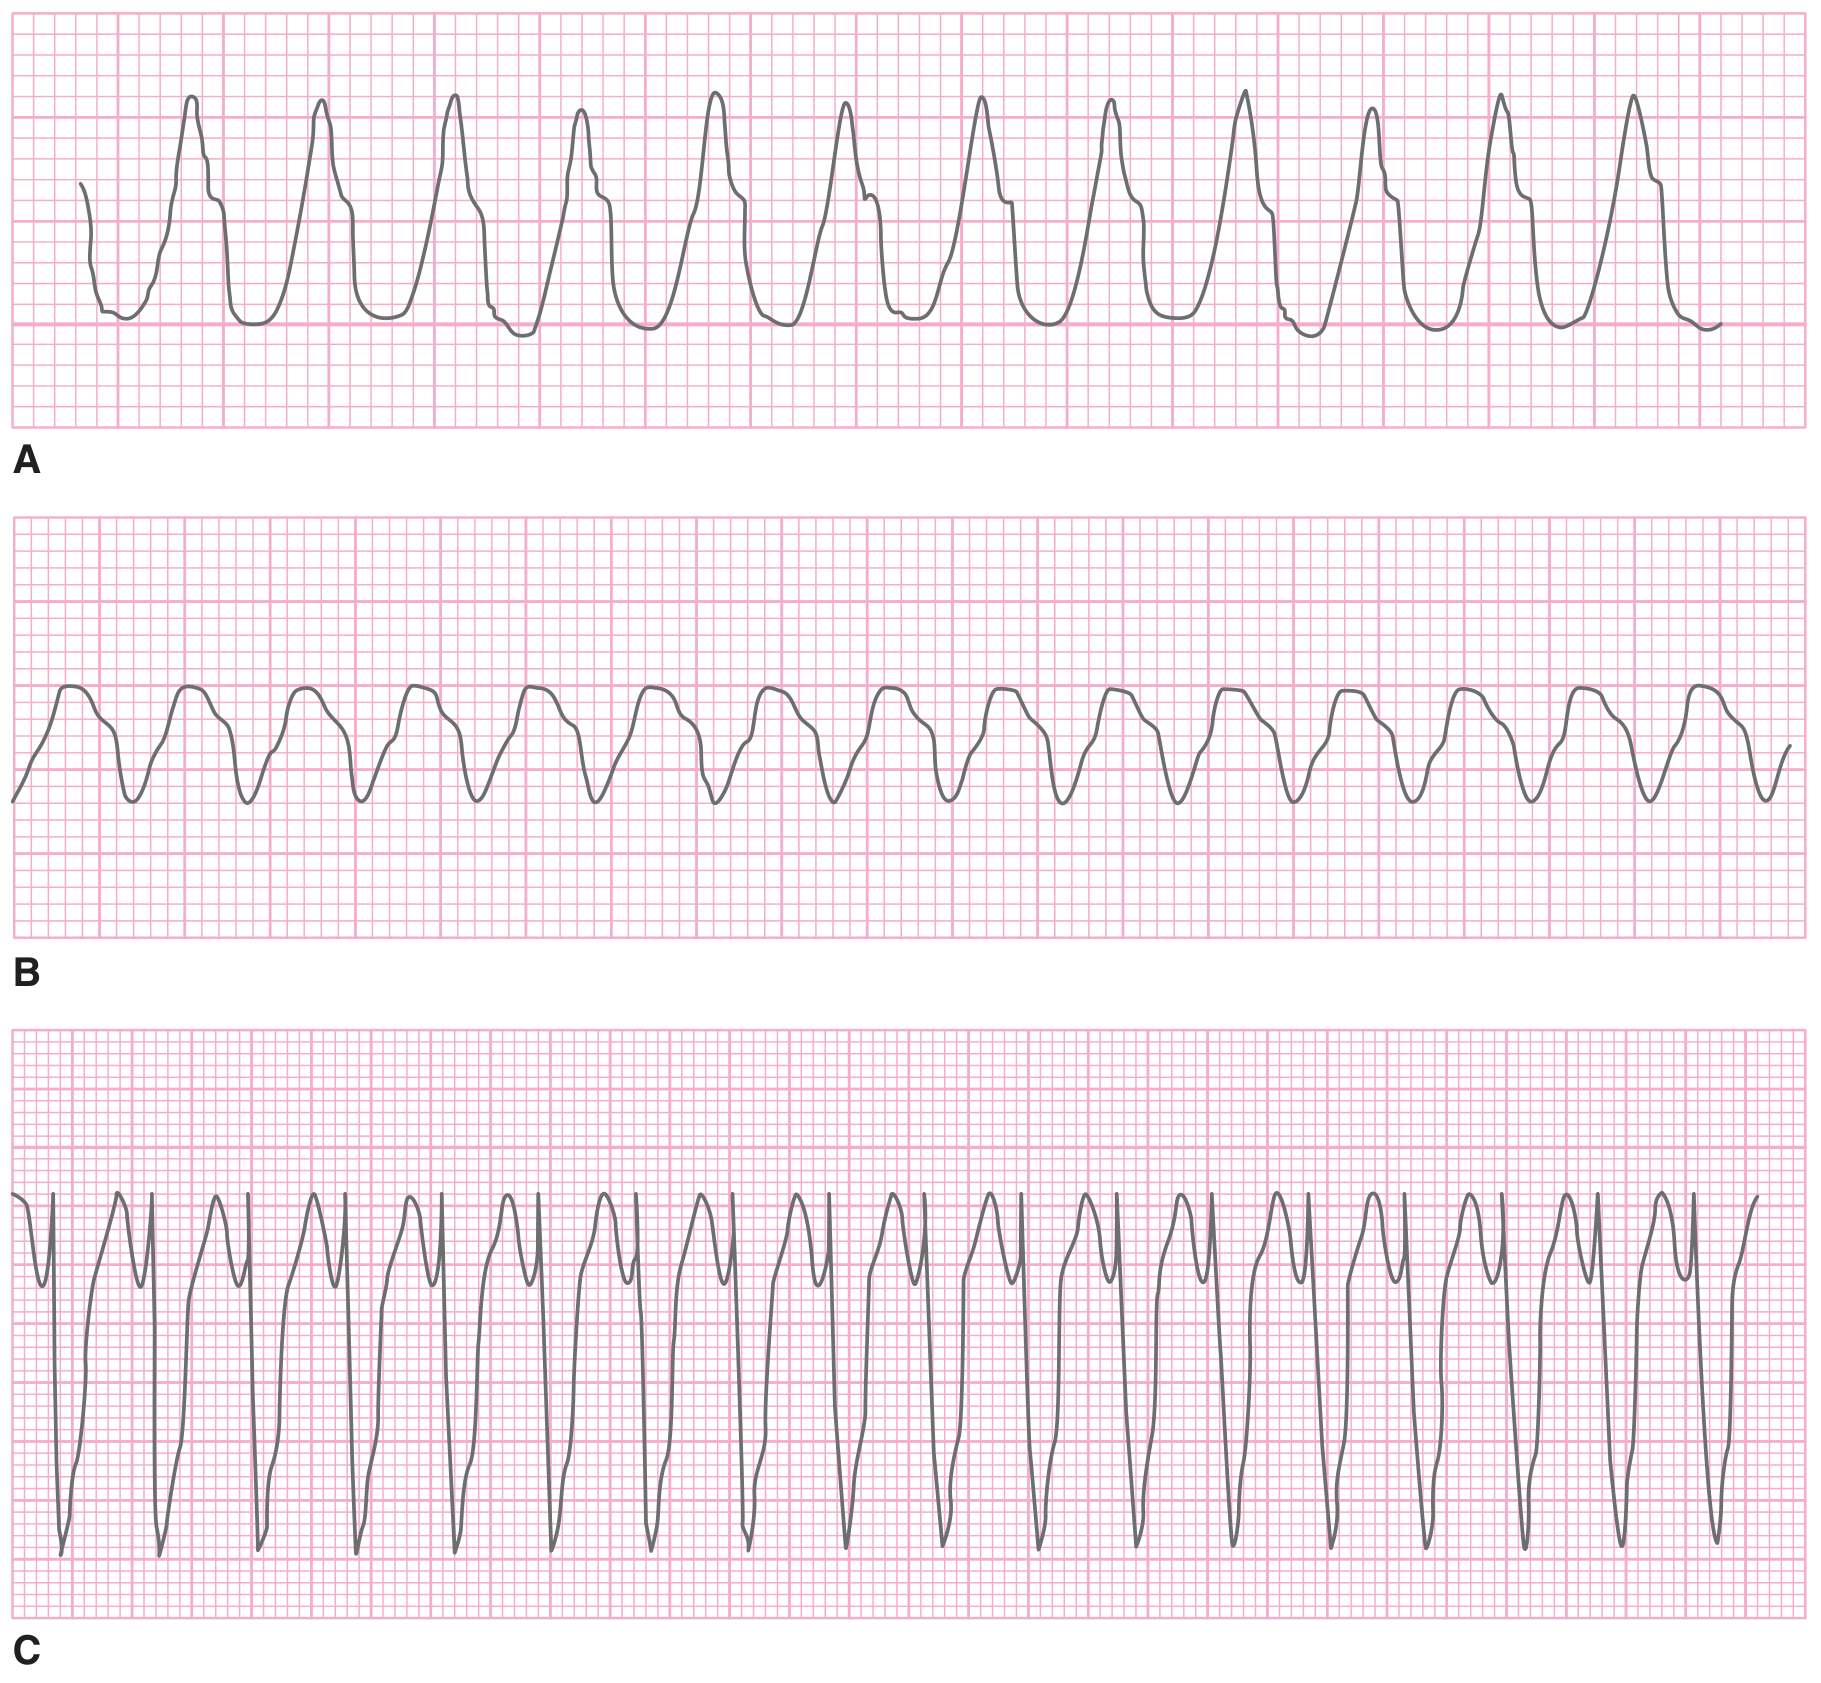
A: VT at 270 bpm - very wide complexes. B: VT at 220 bpm - classic monomorphic pattern. C: VT at 180 bpm - slightly slower but still wide and regular. All have consistent beat-to-beat QRS morphology.
3. VT vs SVT with Aberrancy - Key Distinguishing Features
What to look for: AV dissociation (C), fusion beats and capture beats (D) = diagnostic of VT.
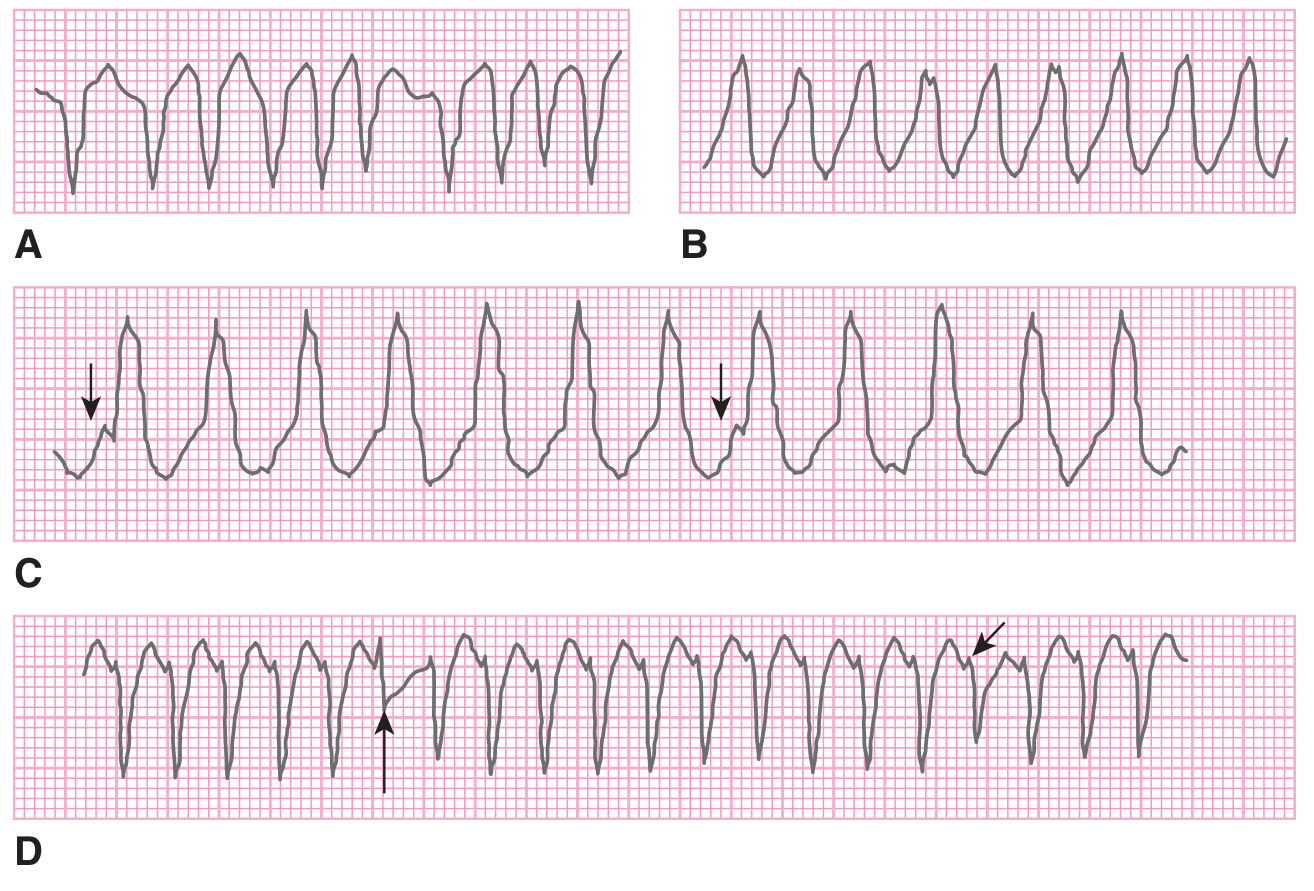
Panel C (arrows): P waves marching completely independently of QRS - this is AV dissociation, pathognomonic for VT. Panel D (arrows): capture beat (narrow QRS) and fusion beat (intermediate morphology) amid wide complexes - confirms VT.
4. Second-Degree AV Block - Mobitz I (Wenckebach)
What to look for: PR interval gets progressively longer until one QRS drops (missing beat), then resets.
Arrows point to the P waves that are blocked (no QRS follows). Before each blocked P, the PR interval was getting longer and longer - classic Wenckebach pattern.
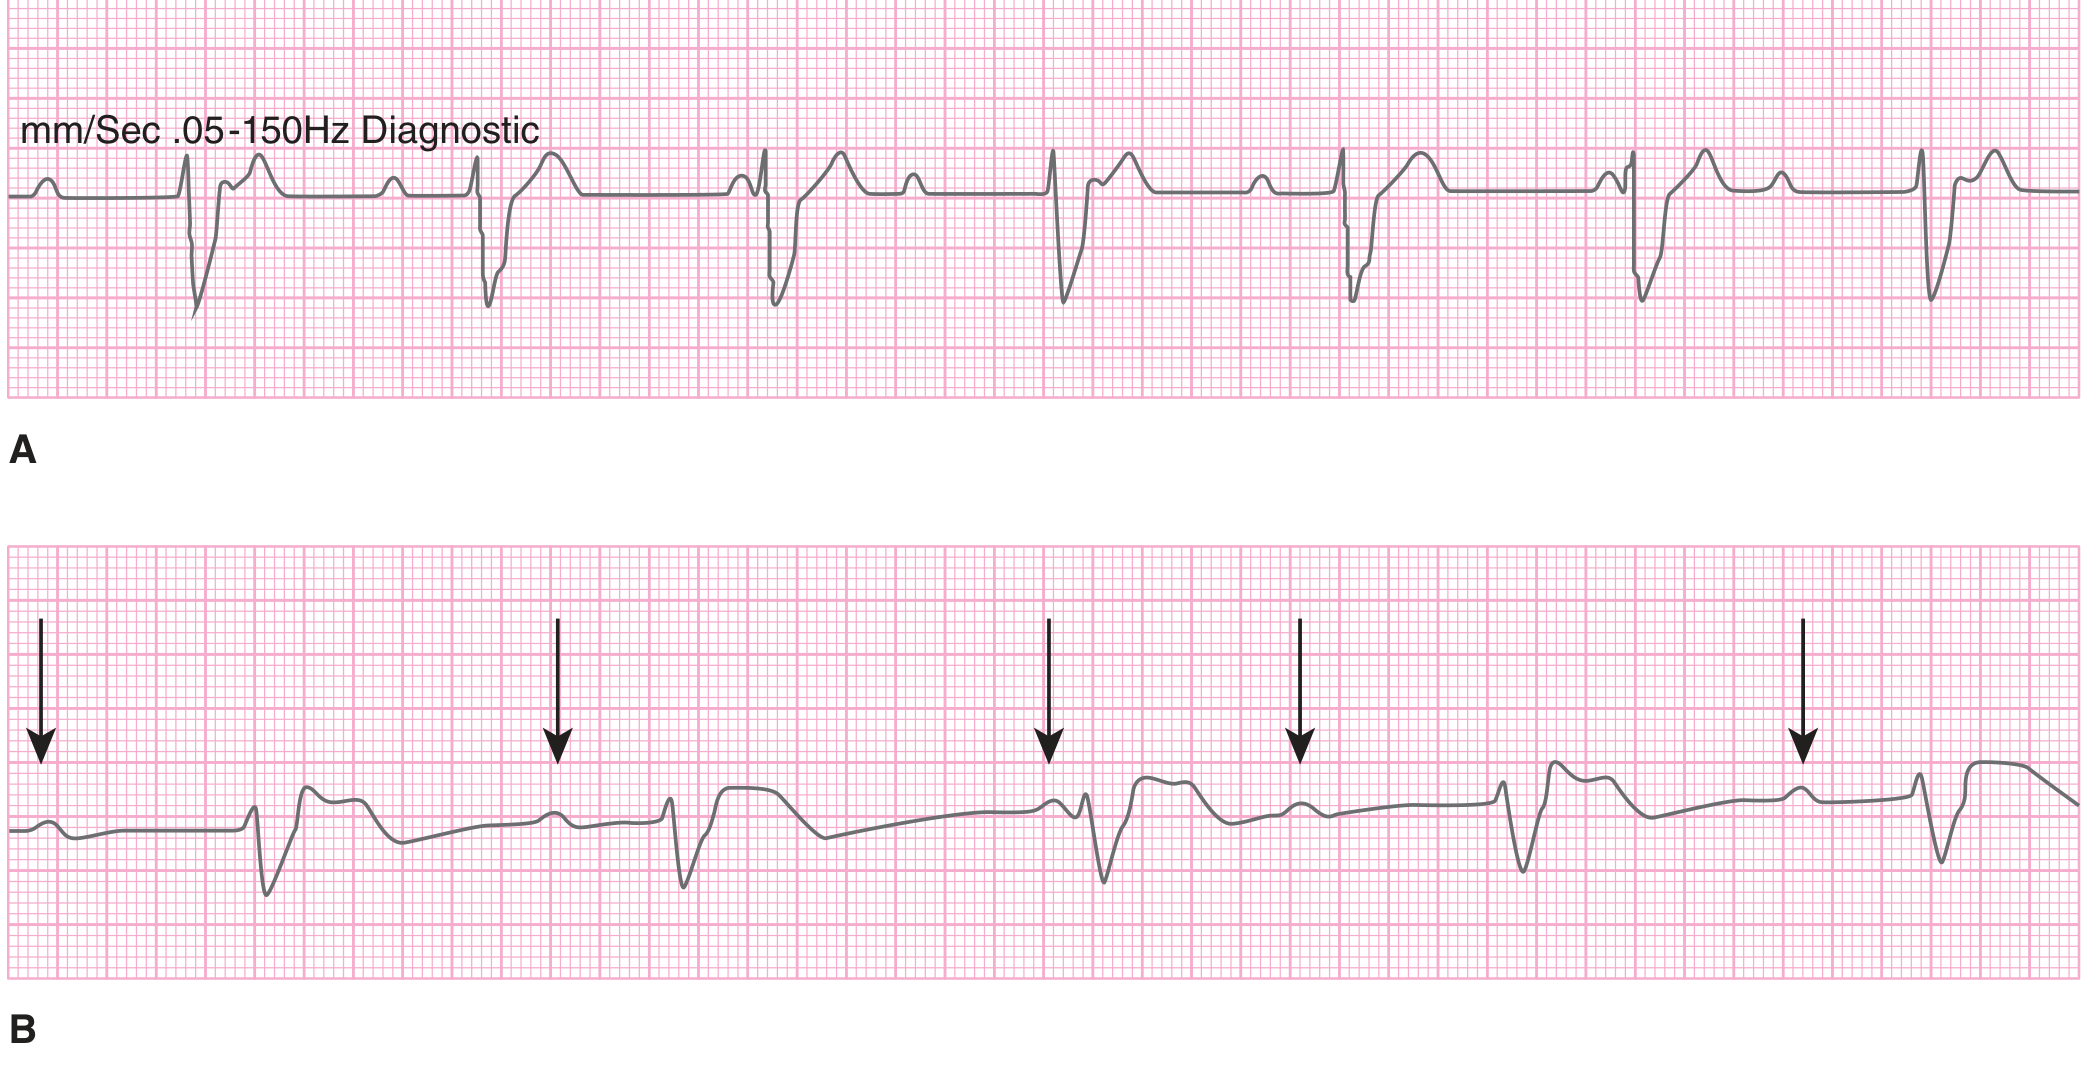
5. Second-Degree AV Block - Mobitz II
What to look for: Constant PR interval, then suddenly a QRS is missing with NO prior PR prolongation.
A: Narrow QRS - sudden dropped beat, PR stays the same before and after. B: Wide QRS - infranodal block. C: High-grade AV block with 2 consecutive P waves blocked (arrows) - very dangerous, nearly complete block.
6. Third-Degree AV Block (Complete Heart Block)
What to look for: P waves and QRS complexes completely independent (marching to their own rates). P rate > QRS rate.
Top strip (A): See the slow, wide escape QRS complexes with P waves randomly placed throughout - no P consistently precedes any QRS. Bottom strip (B): Arrows point to visible P waves marching at their own rate, completely dissociated from the escape rhythm.
7. WPW (Wolff-Parkinson-White Syndrome)
What to look for: Short PR (<120 ms), delta wave (slurred upstroke of QRS), wide QRS at baseline.
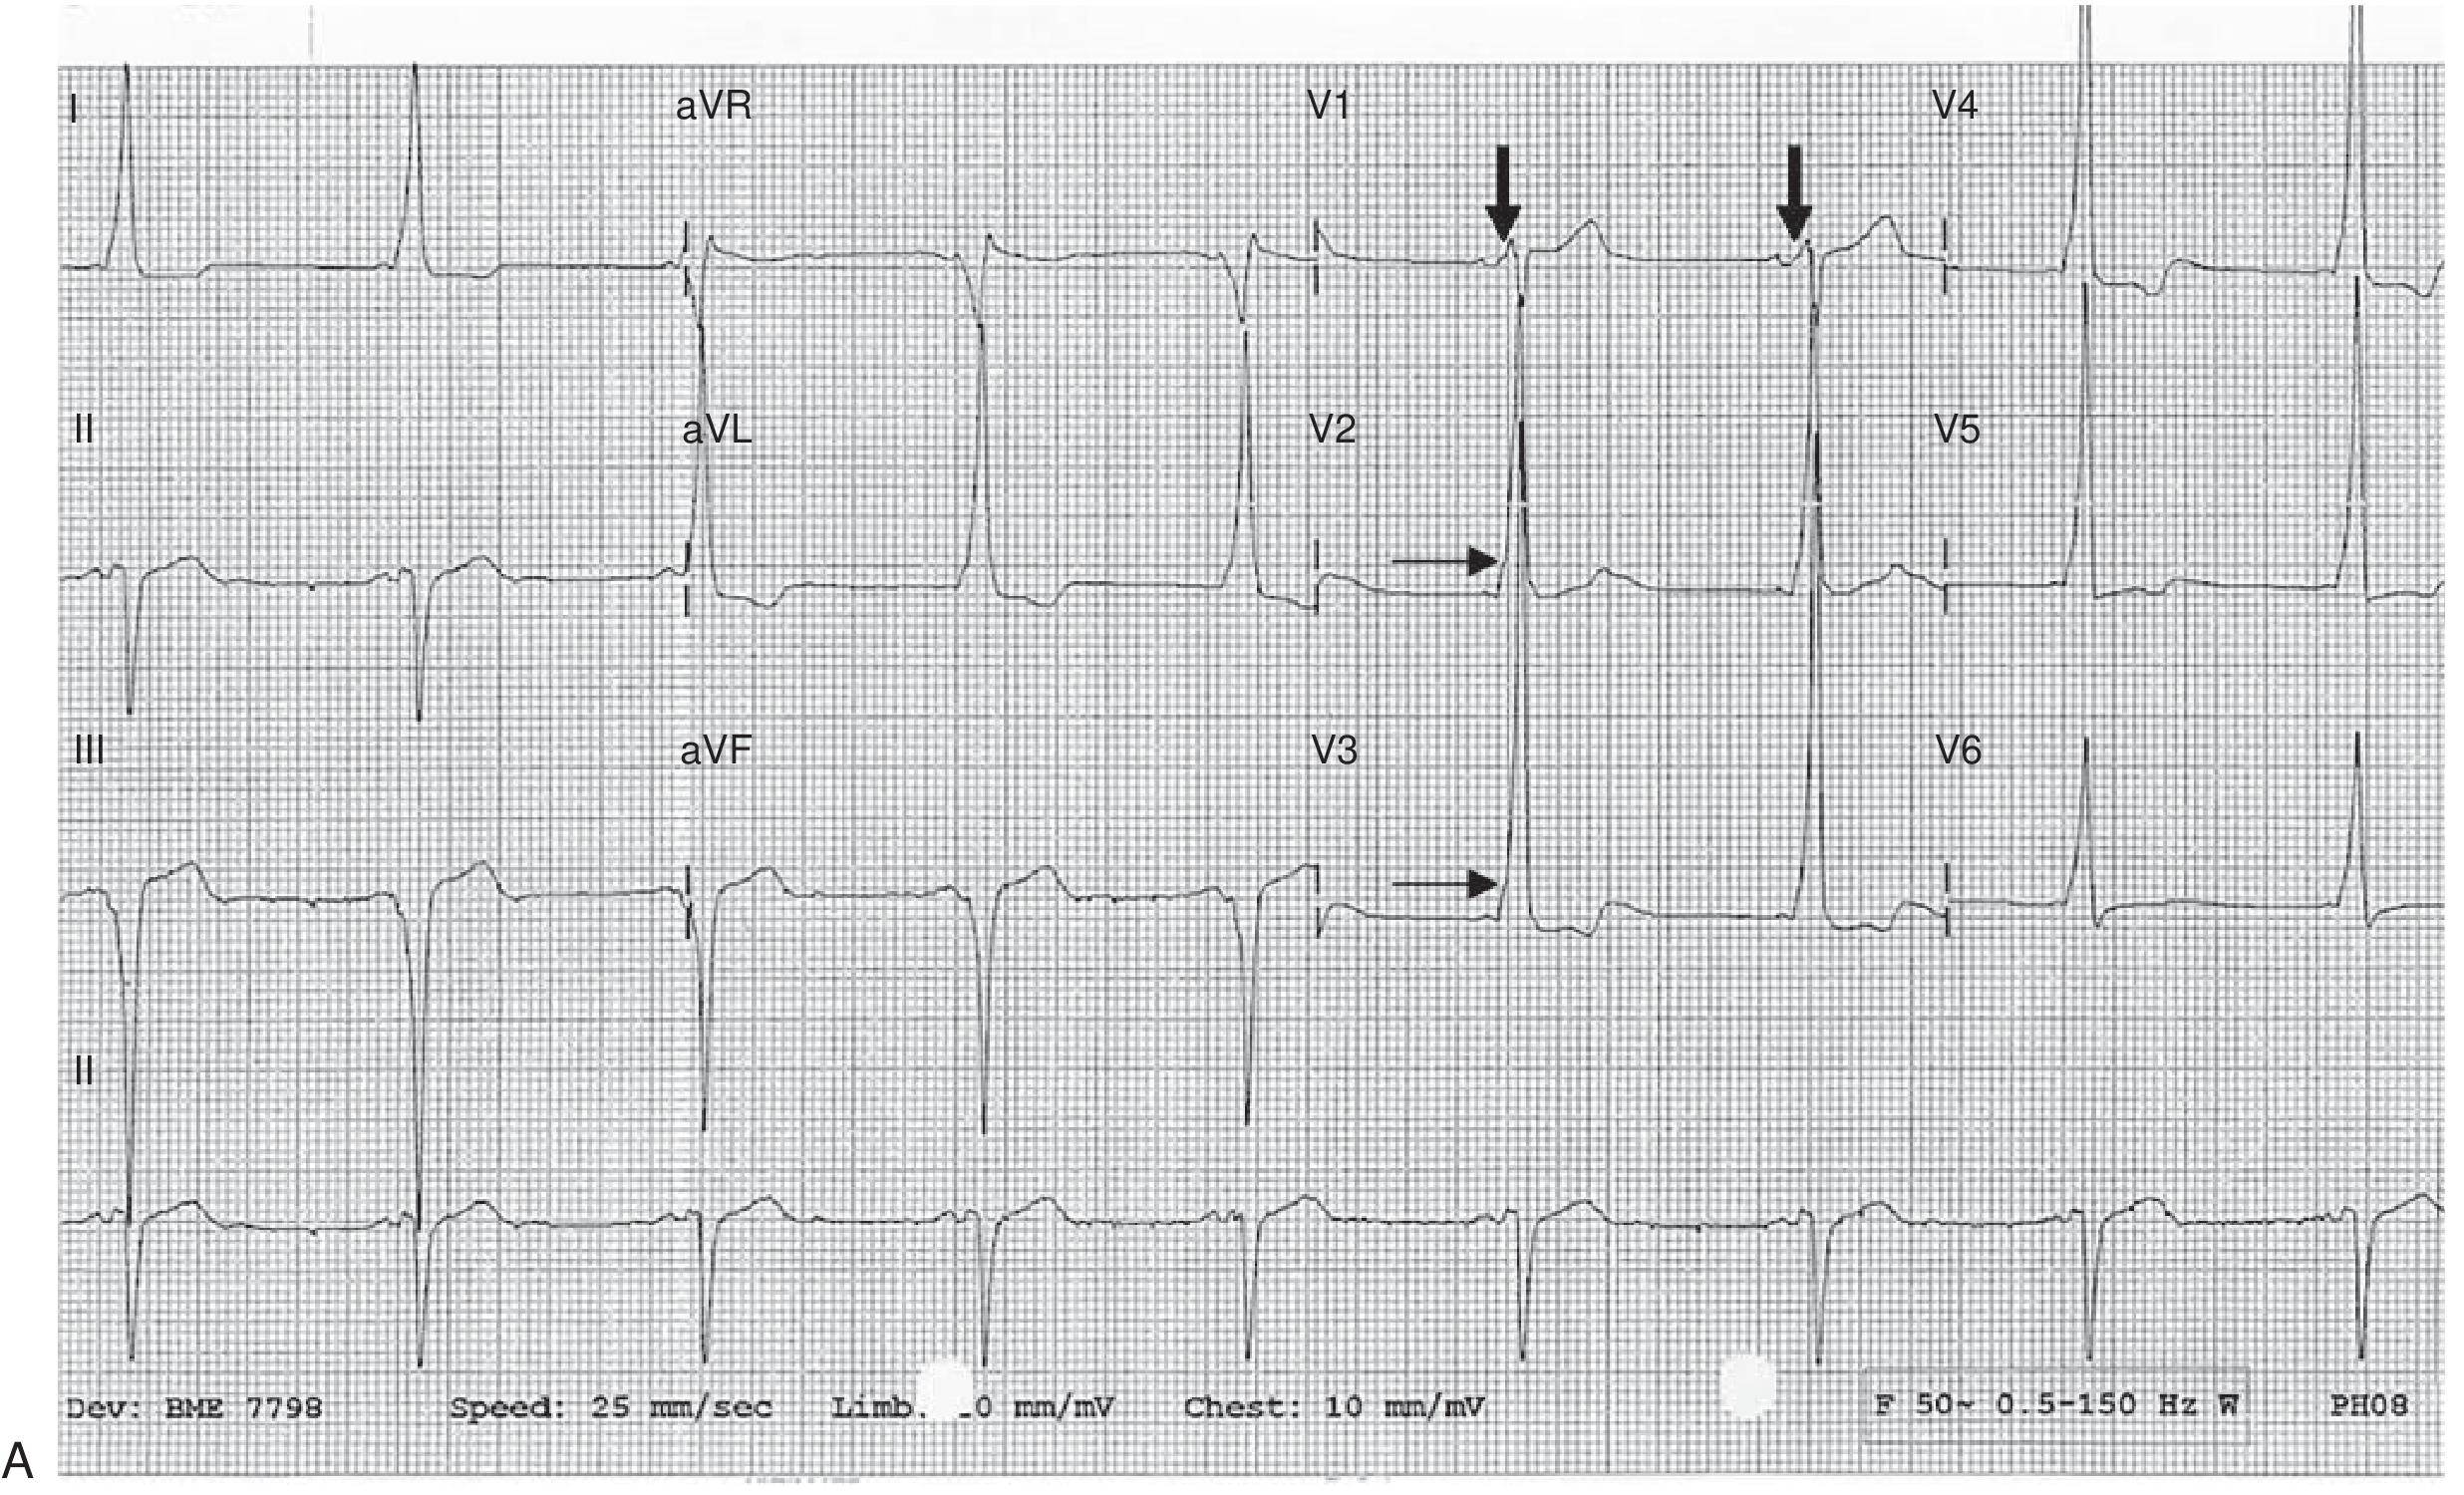
Thick arrows (V1, V2): The delta wave inflection point where slow accessory pathway conduction merges with rapid His-Purkinje conduction. Horizontal arrows (V2, V3): the transition point. Note the PR interval is clearly shortened across all leads.
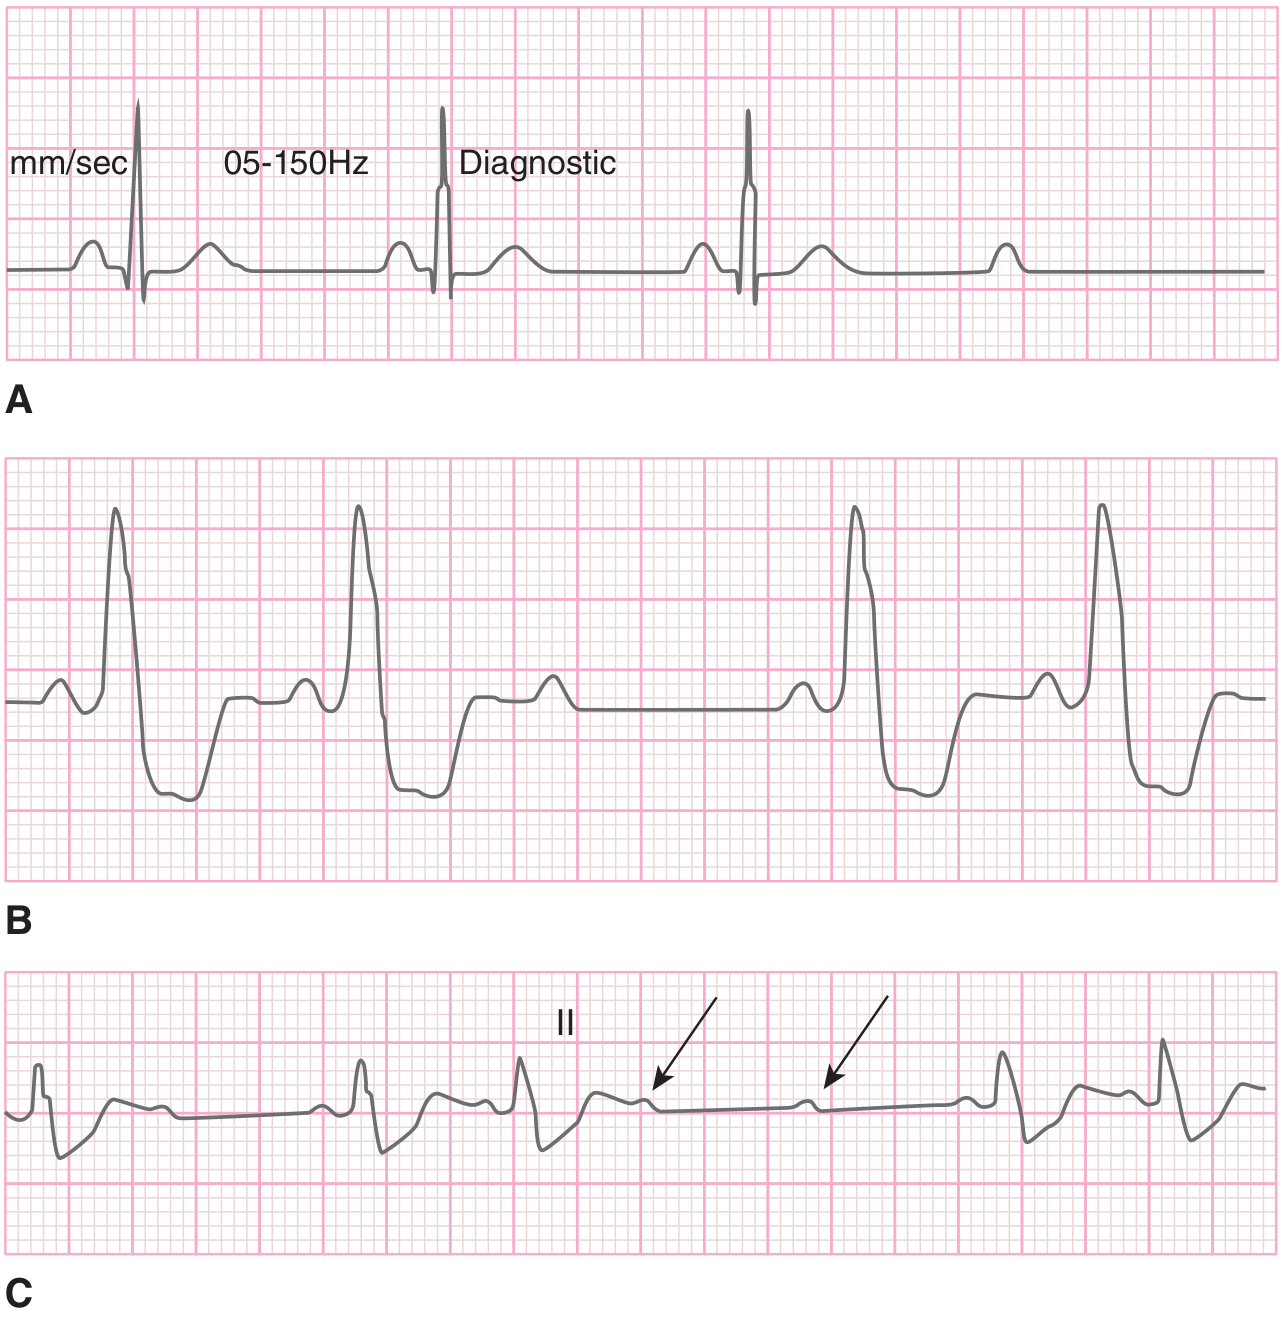
8. Hyperkalemia - Progressive ECG Changes
What to look for: Peaked T → wide QRS → loss of P → sine wave → VF.
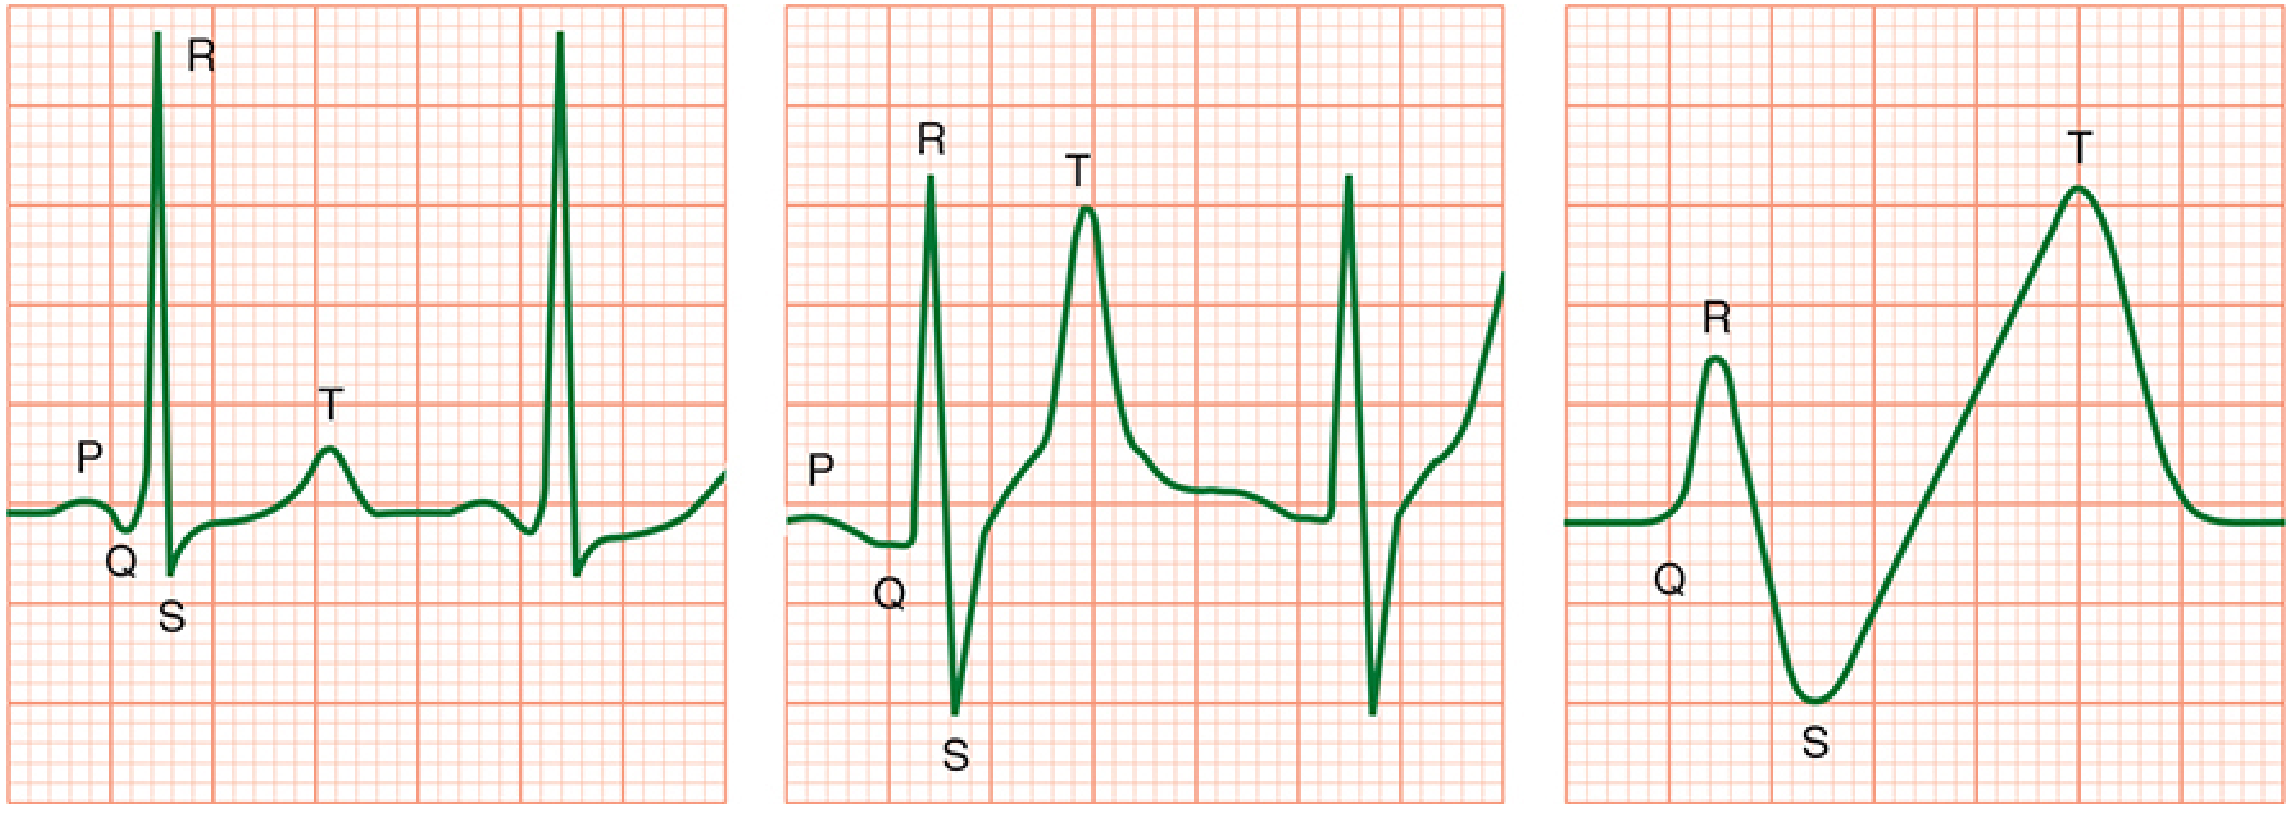
Left panel: Normal baseline (P, QRS, T labeled). Middle panel: Moderately elevated K⁺ - note the tall, peaked, narrow T wave dwarfing the R wave, with some QRS widening and PR prolongation. Right panel: Severely elevated K⁺ - classic sine wave, P wave gone, QRS and T wave merge - immediately pre-VF.
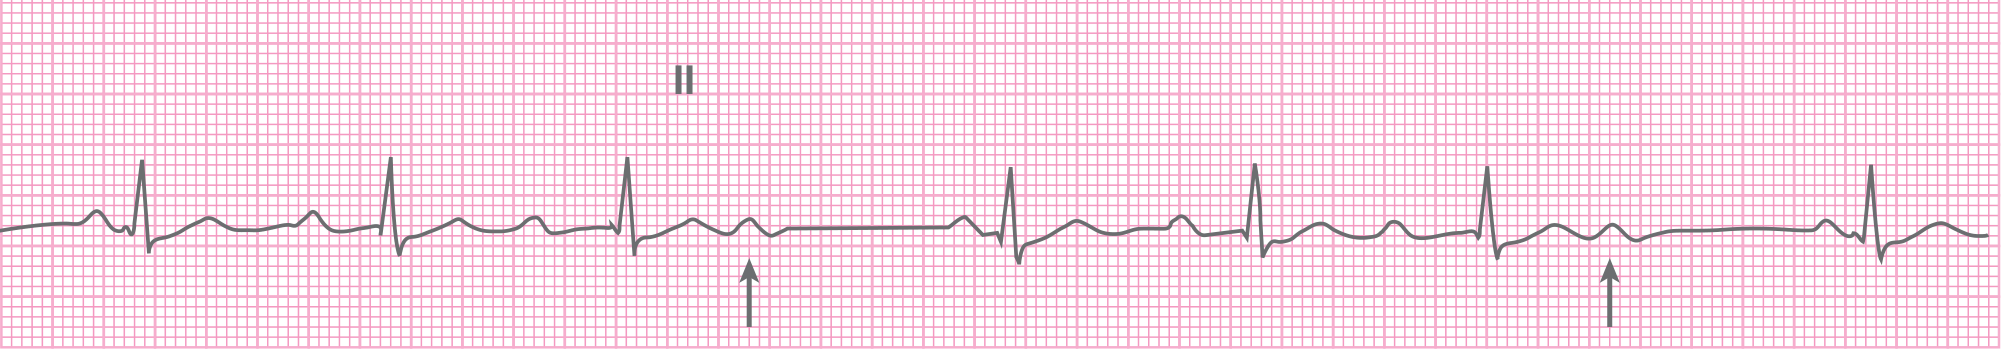
9. First-Degree AV Block
What to look for: Every P conducts, but PR > 200 ms (> 1 big square). Regular, just slow conduction.
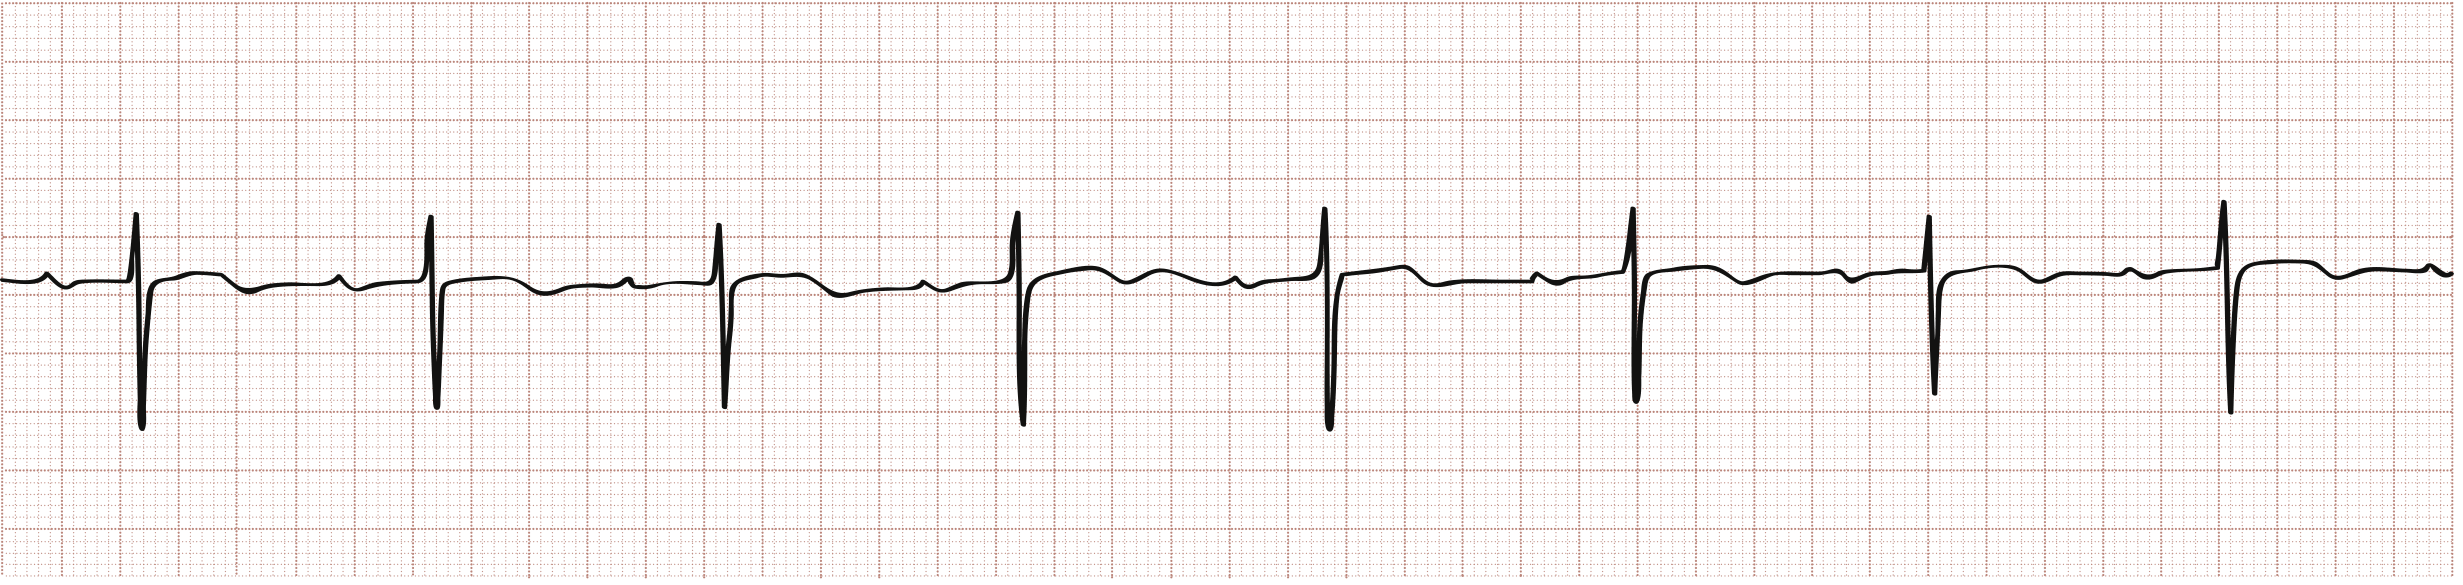
Every P wave is followed by a QRS, but the PR interval is visibly prolonged - you can measure it is >200 ms. No dropped beats.
10. Second-Degree AV Block Mobitz I (Wenckebach) - Classic Strip
What to look for: Grouped beats (clusters of QRS), PR gets longer within each group, last beat drops.
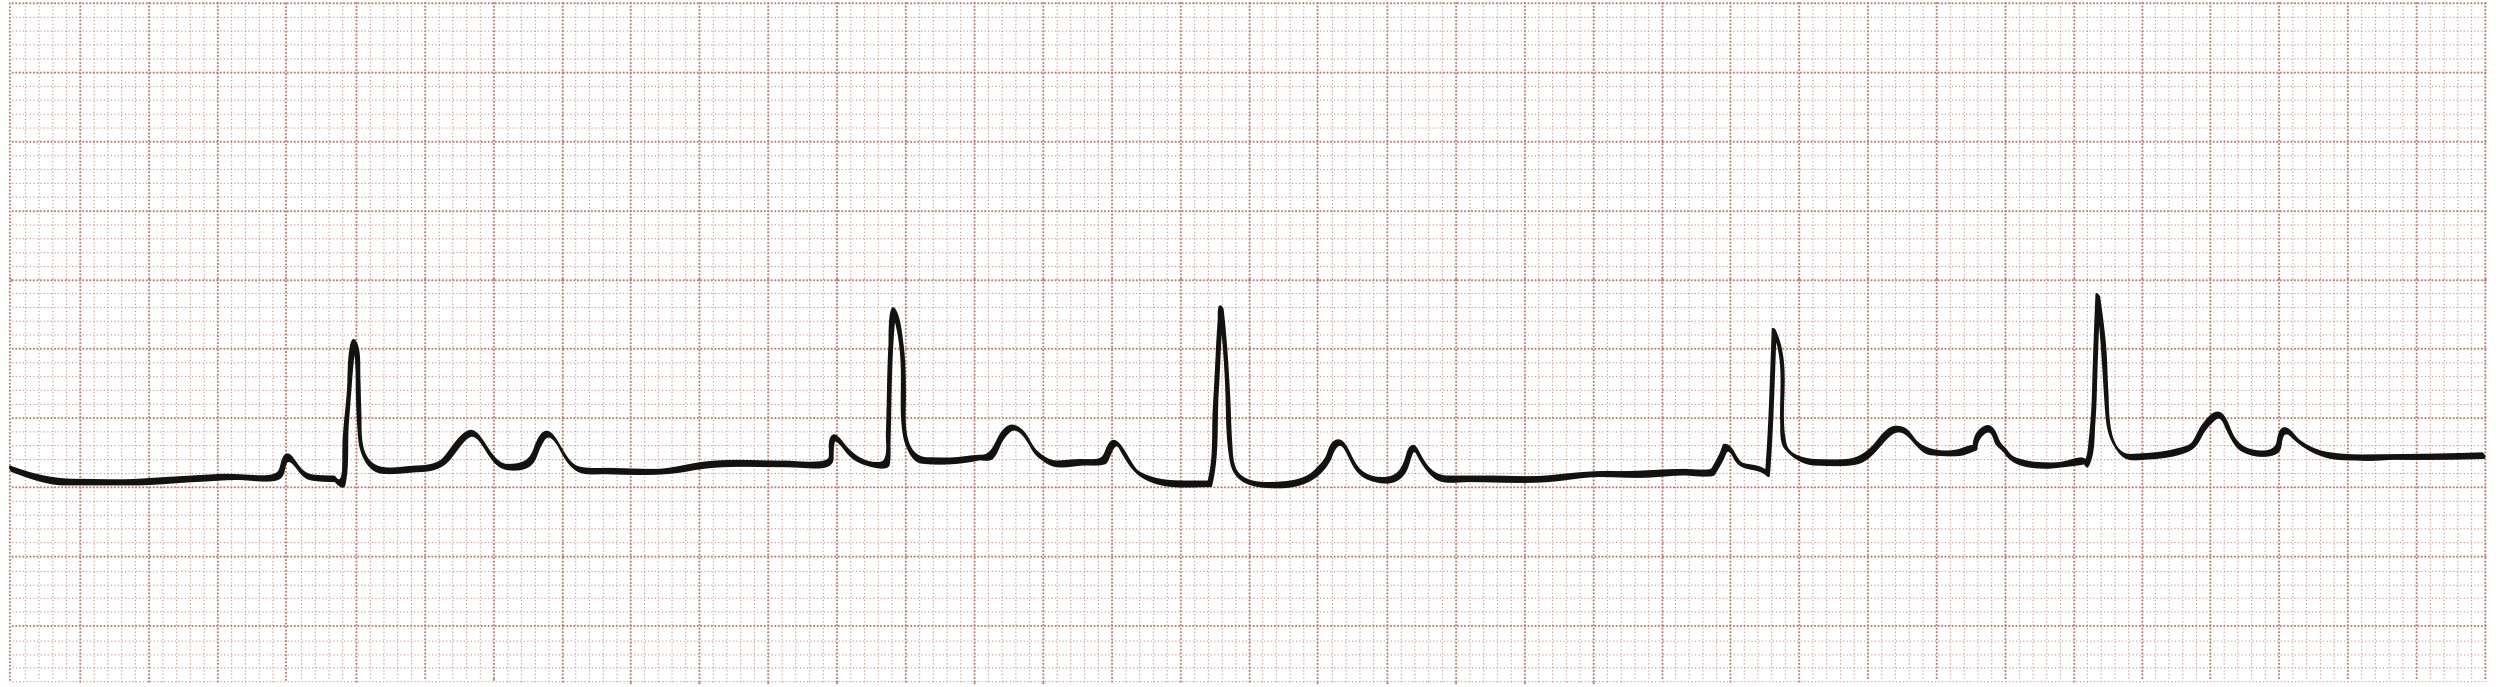
You can see the PR interval getting slightly longer across each group of beats, then a pause (dropped QRS), then the cycle resets. Classic "grouped beating" of Wenckebach.
11. STEMI - Hyperacute T waves → ST Elevation (Same Patient, 30 min apart)
What to look for: Early: tall, broad T waves in affected leads. Later: frank ST elevation.
A: Chest pain but ST not yet elevated - look at V3-V4, huge broad peaked T waves = hyperacute T waves (earliest STEMI sign, often missed!). B: Same patient 30 min later - clear ST elevation in V1-V4, now obvious anterior STEMI.
12. Bundle Branch Blocks (RBBB and LBBB)
(These were shared in the previous session but reproduced here for completeness)
RBBB - rSR' (M-shape) in V1, wide S in lateral leads:
LBBB - broad notched R in lateral leads, deep S in V1-V3:
Quick Visual Recognition Table
| Abnormality | Single Most Important Visual Feature |
|---|---|
| AF | No P waves, irregular beats |
| Atrial Flutter | Sawtooth F waves in II/III/aVF |
| Monomorphic VT | Wide QRS, regular, fast, no P-QRS link |
| Wenckebach | PR gets longer → dropped QRS → repeats |
| Mobitz II | Constant PR → sudden dropped QRS |
| Complete heart block | P and QRS march independently |
| RBBB | rSR' (M shape) in V1 |
| LBBB | Broad notched R in I/V5/V6 |
| WPW | Short PR + delta wave |
| Hyperkalemia | Peaked T → sine wave |
| Early STEMI | Hyperacute T waves in affected territory |
| Established STEMI | Convex ST elevation in territory |
| Wenckebach (first-degree) | Long PR, every P conducts |
These are all sourced directly from Tintinalli's Emergency Medicine, Rosen's Emergency Medicine, Braunwald's Heart Disease, Goldman-Cecil Medicine, and Morgan & Mikhail's Anesthesiology.
Would you like to practice interpreting ECGs with a quiz, or go deeper into any specific abnormality?
This is a shared conversation. Sign in to Orris to start your own chat.