

Answer all these questions in details
ECG waves labeled diagram P QRS T wave
normal ECG electrocardiogram labeled P wave QRS complex T wave
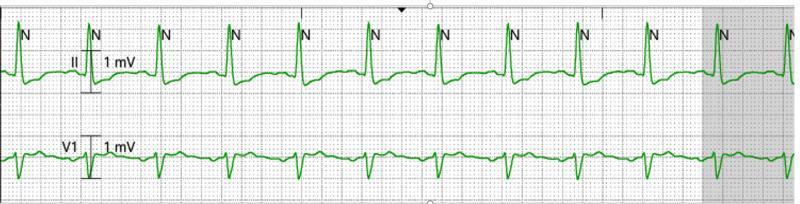
This diagnostic image shows a two-lead electrocardiogram (ECG) telemetry strip displayed on a standard grid background. The top tracing is labeled Lead II and the bottom tracing is labeled Lead V1, each with a 1 mV calibration marker. The tracings demonstrate a normal sinus rhythm with regular P waves, narrow QRS complexes, and upright T waves. Each QRS complex is automatically annotated with the letter 'N', indicating a recognized normal beat by the telemetry system. Lead II exhibits tall R waves, while Lead V1 shows a predominantly negative S-wave morphology with a small initial R wave, consistent with standard precordial lead placement. This strip serves as a clinical illustration of successful restoration of normal sinus rhythm following an intervention for electrical storm, specifically after an ultrasound-guided left stellate ganglion block. The rhythm is stable, with consistent PR and RR intervals throughout the captured segment.
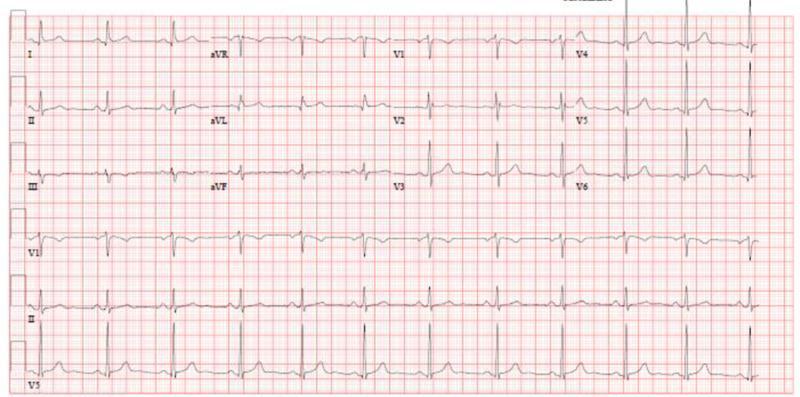
This diagnostic image is a standard 12-lead electrocardiogram (ECG) displayed on a pink-and-white grid-calibrated background. The tracing represents a human heart at rest and demonstrates a normal sinus rhythm. All 12 leads are clearly labeled and organized into columns: the limb leads (I, II, III), augmented vector leads (aVR, aVL, aVF), and precordial leads (V1 through V6), with additional rhythm strips provided at the bottom (VI, II, V5). Each cardiac cycle displays a distinct P wave preceding every QRS complex, followed by a consistent T wave. The heart rate is regular, and the morphology of the waveforms—including the PR interval, QRS duration, and ST segments—appears within normal physiological limits, showing no signs of acute ischemia, hypertrophy, or conduction blocks. This visual is suitable for cardiology education to demonstrate baseline normal findings in a healthy cardiac patient.
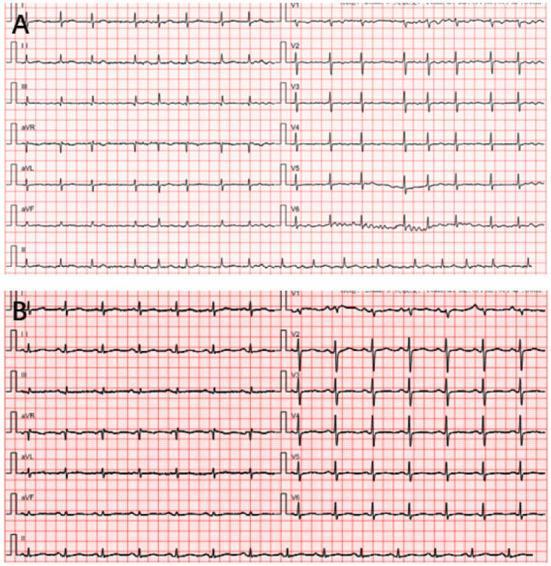
The image consists of two 12-lead electrocardiogram (ECG) tracings, labeled A and B, displayed on a standard grid. Panel A shows a pre-procedure ECG demonstrating atrial fibrillation, characterized by an irregularly irregular rhythm with varying R-R intervals and the absence of discernible P waves. The QRS complexes are narrow, and the baseline shows minor wandering artifact but no significant interference. Panel B shows a postoperative 12-lead ECG. This tracing displays a regular rhythm with a heart rate of approximately 120 beats per minute, consistent with sinus tachycardia. Each QRS complex is narrow and preceded by a discernible P wave in most leads, indicating a return to sinus rhythm following intervention (radiofrequency catheter ablation). The T waves in both tracings appear normal in morphology across the limb (I, II, III, aVR, aVL, aVF) and precordial (V1-V6) leads, with no obvious signs of acute ST-segment elevation or depression. This comparison serves as clinical documentation of rhythm conversion from atrial fibrillation to sinus tachycardia in a patient post-ablation.
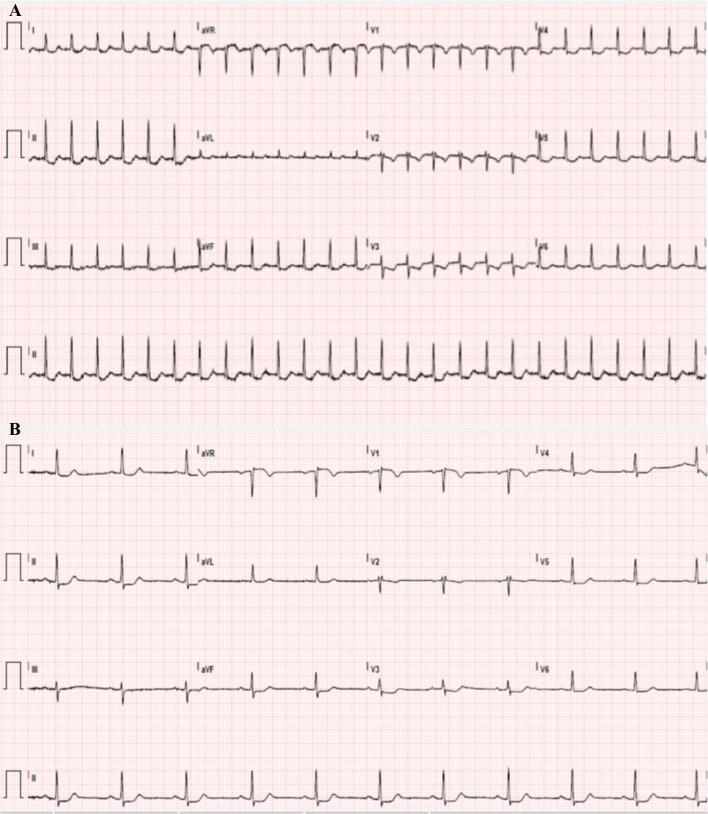
This diagnostic image consists of two 12-lead electrocardiogram (ECG) tracings, labeled Panel A and Panel B, comparing cardiac rhythms in the same patient. Panel A displays a supraventricular tachycardia (SVT), characterized by a rapid, regular heart rate with narrow QRS complexes and absent or obscured P waves. Panel B demonstrates the patient's transition to normal sinus rhythm. In this second tracing, the heart rate is significantly slower and regular, with clearly identifiable P waves preceding each QRS complex. A notable diagnostic finding in Panel B is the presence of ST-segment depressions, most prominent in leads II and V3 through V5, accompanied by T-wave flattening or inversion. These findings are clinically relevant for evaluating myocardial ischemia or strain following a tachyarrhythmia. The comparison is essential for cardiology and emergency medicine education, illustrating the spontaneous resolution of SVT and the subsequent identification of underlying repolarization abnormalities.
Short Answer Physiology Questions - Detailed Answers
1. State Starling's Law of Force of Contraction (Frank-Starling Law)
- Increased end-diastolic volume stretches the sarcomeres to a more optimal length (approximately 2.0-2.2 µm)
- At this length, actin-myosin cross-bridging is maximized
- This leads to greater myofilament Ca²⁺ sensitivity (myofilament length-dependent activation), producing a stronger contraction
- The heart therefore automatically adjusts its output to match venous return
- The Frank-Starling curve can shift left (enhanced inotropy - e.g., with exercise, adrenergic stimulation, digitalis) or right (decreased inotropy - e.g., heart failure)
- It keeps cardiac output of left and right ventricles balanced
2. Functions of the Juxtaglomerular Apparatus (JGA)
- Macula densa (specialized DCT cells)
- Juxtaglomerular (granular) cells (in afferent arteriole wall)
- Extraglomerular mesangial (Lacis) cells
| Function | Mechanism |
|---|---|
| Renin secretion | JG granular cells secrete renin in response to ↓ renal perfusion pressure, ↓ Na⁺/Cl⁻ delivery to macula densa, or sympathetic stimulation |
| Tubuloglomerular feedback (TGF) | Macula densa senses ↑NaCl in distal tubule → signals afferent arteriole to constrict → ↓ GFR (autoregulation) |
| Autoregulation of GFR & RBF | Maintains GFR relatively constant despite changes in arterial pressure (between ~80-180 mmHg) |
| Erythropoietin production | Contributes to EPO secretion in response to hypoxia |
| Prostaglandin synthesis | Local prostaglandins modulate afferent arteriolar tone |
3. Define Osmosis
- Osmotic pressure: The hydrostatic pressure required to stop net osmotic flow; it is proportional to the number of solute particles (osmolarity)
- Formula (van't Hoff): π = nCRT (where n = number of particles, C = concentration, R = gas constant, T = temperature)
- Osmolarity: Normal plasma osmolarity = 285-295 mOsm/L
- Isotonic solution: 0.9% NaCl (normal saline) or 5% dextrose - no net water movement across cell membrane
- Hypotonic solution: Water moves INTO cells → cell swelling/lysis
- Hypertonic solution: Water moves OUT of cells → cell shrinkage/crenation
4. Name the Neuroglial Cells. Functions of Astrocytes
Neuroglial (Glial) Cells of the CNS:
- Astrocytes (most abundant)
- Oligodendrocytes (myelin in CNS)
- Microglia (CNS immune cells/macrophages)
- Ependymal cells (line ventricles, produce CSF)
Functions of Astrocytes:
| Function | Details |
|---|---|
| Structural support | Provide scaffolding for neurons; guide neuronal migration during development |
| Blood-Brain Barrier (BBB) | Astrocytic "end-feet" surround capillaries, induce tight junctions in endothelial cells to form the BBB |
| Ionic homeostasis | Regulate extracellular K⁺ concentration ("K⁺ spatial buffering") - prevents neuronal hyperexcitability |
| Neurotransmitter uptake | Remove and recycle glutamate and GABA from synaptic cleft |
| Metabolic support | Supply lactate and glutamine to neurons; store glycogen as energy reserve |
| Synapse formation | Release thrombospondins and other factors that promote synaptogenesis |
| Scar formation | Form glial scar (reactive gliosis) after CNS injury |
| CSF production | Contribute to formation of extracellular fluid and CSF |
| Calcium signaling | Participate in "tripartite synapse" - respond to neurotransmitters and release gliotransmitters |
5. Functions of Angiotensin II
| Function | Details |
|---|---|
| Vasoconstriction | Potent constrictor of systemic arterioles → ↑ TPR → ↑ blood pressure. Acts on AT₁ receptors |
| Aldosterone release | Stimulates adrenal cortex (zona glomerulosa) → ↑ aldosterone → Na⁺ and water retention |
| ADH (vasopressin) release | Acts on posterior pituitary → ↑ ADH → ↑ water reabsorption in collecting ducts |
| Thirst stimulation | Acts on hypothalamic thirst center → ↑ water intake |
| Direct tubular effect | Stimulates Na⁺/H⁺ exchanger in proximal tubule → ↑ Na⁺ reabsorption |
| Sympathetic activation | Facilitates norepinephrine release from sympathetic nerve terminals |
| Cardiac & vascular hypertrophy | Acts as a growth factor → hypertrophy of cardiomyocytes and vascular smooth muscle (AT₁ receptor) |
| Inhibits renin release | Negative feedback on JG cells |
| Stimulates thromboxane A₂ | Promotes vasoconstriction and platelet aggregation |
| Inotropic effect | Mild positive inotropic effect on the heart |
6. Intrapulmonary Pressure and Its Normal Value
| Phase | Pressure |
|---|---|
| At rest (end of expiration/FRC) | 0 mmHg (equal to atmospheric pressure = 760 mmHg) |
| During inspiration | -1 to -3 mmHg (below atmospheric) → air flows in |
| During expiration | +1 to +3 mmHg (above atmospheric) → air flows out |
- Intrapleural (intrathoracic) pressure: Normally -5 mmHg at rest (more negative = -8 mmHg during inspiration)
- Transpulmonary pressure = Intrapulmonary pressure - Intrapleural pressure = distending pressure keeping lungs inflated
- At FRC, lung recoil inward is balanced by chest wall recoil outward; intrapulmonary pressure equals atmospheric
7. Name the Contractile Proteins
Principal Contractile Proteins:
- Myosin - the thick filament; contains globular heads (S1 fragments) that form cross-bridges with actin; has ATPase activity
- Actin - the thin filament; two helical chains of G-actin monomers form F-actin; interacts with myosin heads during contraction
Regulatory Proteins (associated with thin filament):
- Tropomyosin - double-stranded α-helical protein that covers actin-myosin binding sites at rest
- Troponin complex (three subunits):
- Troponin T (TnT): binds to tropomyosin
- Troponin I (TnI): inhibitory subunit; inhibits actin-myosin interaction
- Troponin C (TnC): binds Ca²⁺; conformational change removes tropomyosin inhibition → contraction begins
Other structural proteins:
- Titin - noncontractile elastic protein connecting myosin to Z-disc; acts as molecular spring
- α-Actinin - anchors actin at Z-discs
8. Define Dead Space. Types of Dead Space
Types of Dead Space:
- The volume of air occupying the conducting airways (nose, pharynx, larynx, trachea, bronchi, bronchioles up to but not including respiratory bronchioles)
- These structures have no alveolar walls and cannot exchange gases
- Approximately 2 mL/kg body weight (or 1 mL per pound of body weight)
- Volume of air in alveoli that are ventilated but not perfused (VA/Q = ∞)
- Examples: pulmonary embolism (alveoli ventilated but capillary flow blocked)
- Normally minimal in healthy individuals
- The total wasted ventilation
- Measured using the Bohr equation: $$\frac{V_{D_{phys}}}{V_T} = \frac{PaCO_2 - P\bar{E}CO_2}{PaCO_2}$$
- Where: V_D = dead space volume, V_T = tidal volume, PaCO₂ = arterial CO₂, PĒCO₂ = mixed expired CO₂
- Normal: Physiological dead space ≈ Anatomical dead space (~150 mL; ~30% of tidal volume of 500 mL)
- In disease (COPD, pulmonary embolism), alveolar dead space increases → physiological dead space >> anatomical dead space
9. Draw a Labeled Diagram of ECG Waves
         R
         |
    P    |        T
   /\    |       /\
  /  \   |      /  \
-/----\--+--Q--/----\--S----  (isoelectric line)
         |
    PR   QRS    ST   QTc
| Wave/Interval | Represents | Normal Duration |
|---|---|---|
| P wave | Atrial depolarization (SA node → atria) | < 0.12 sec; amplitude < 2.5 mm |
| PR interval | AV conduction time (atria → ventricles via AV node) | 0.12 - 0.20 sec |
| QRS complex | Ventricular depolarization | 0.06 - 0.10 sec |
| Q wave | Septal depolarization (small, initial negative deflection) | < 0.04 sec; < 25% of R height |
| R wave | Main ventricular depolarization (positive deflection) | - |
| S wave | Terminal ventricular depolarization (negative deflection) | - |
| ST segment | Isoelectric - entire ventricular myocardium depolarized | - |
| T wave | Ventricular repolarization | Upright in most leads |
| QT interval | Total ventricular depolarization + repolarization | < 0.44 sec (corrected, QTc) |
| U wave | Repolarization of Purkinje fibers (small, sometimes seen) | After T wave |
10. Define Muscle Tone
- It is not a voluntary contraction - it is a reflex phenomenon
- Not all motor units are active simultaneously - they take turns firing (asynchronous firing), preventing fatigue
- The muscle remains in a state of readiness and maintains posture
- Maintained by the tonic stretch reflex via the gamma motor neuron system
- Gamma motor neurons maintain tension on muscle spindles (intrafusal fibers)
- Muscle spindle afferents (Ia fibers) continuously send signals to alpha motor neurons → maintaining baseline contraction
- The reticular formation, cerebellum, and basal ganglia modulate tone via descending pathways
| Condition | Tone Change | Cause/Example |
|---|---|---|
| Hypertonia | ↑ Tone | UMN lesion (spasticity - pyramidal), Parkinson's (rigidity - extrapyramidal) |
| Spasticity | Velocity-dependent ↑ tone | Stroke, spinal cord injury |
| Rigidity | Constant ↑ tone (lead pipe/cogwheel) | Parkinson's disease |
| Hypotonia | ↓ Tone ("floppy") | LMN lesion, cerebellar disease, myopathy, hypothyroidism |
| Flaccidity | Complete loss of tone | LMN injury (anterior horn, nerve root, peripheral nerve) |
- Postural tone - maintains erect posture against gravity
- Resting tone - baseline muscle stiffness at complete rest
- Phasic tone - fluctuating tone during movement
Summary Table
| Q | Topic | Key Point |
|---|---|---|
| 1 | Starling's Law | ↑ End-diastolic volume → ↑ stretch → ↑ force of contraction |
| 2 | JGA functions | Renin secretion, TGF, GFR autoregulation |
| 3 | Osmosis | Water moves across semipermeable membrane to area of higher solute concentration |
| 4 | Neuroglial/Astrocytes | BBB, K⁺ buffering, glutamate uptake, scaffolding |
| 5 | Angiotensin II | Vasoconstriction, aldosterone release, ADH, thirst, Na⁺ reabsorption |
| 6 | Intrapulmonary pressure | 0 mmHg at rest; -1 to -3 during inspiration; +1 to +3 during expiration |
| 7 | Contractile proteins | Myosin, Actin (primary); Tropomyosin, Troponin (T, I, C) - regulatory |
| 8 | Dead space | Anatomical (airways, ~150 mL) + Alveolar = Physiological dead space |
| 9 | ECG waves | P (atrial depol.) → PR → QRS (ventricular depol.) → ST → T (ventricular repol.) |
| 10 | Muscle tone | Continuous partial contraction at rest via gamma motor neuron/stretch reflex |