
Write short note on macular function tests for pg ophthalmology exam
macular function tests ophthalmology PG exam short note
https://www.ncbi.nlm.nih.gov/books/NBK587444
Amsler grid macular degeneration test
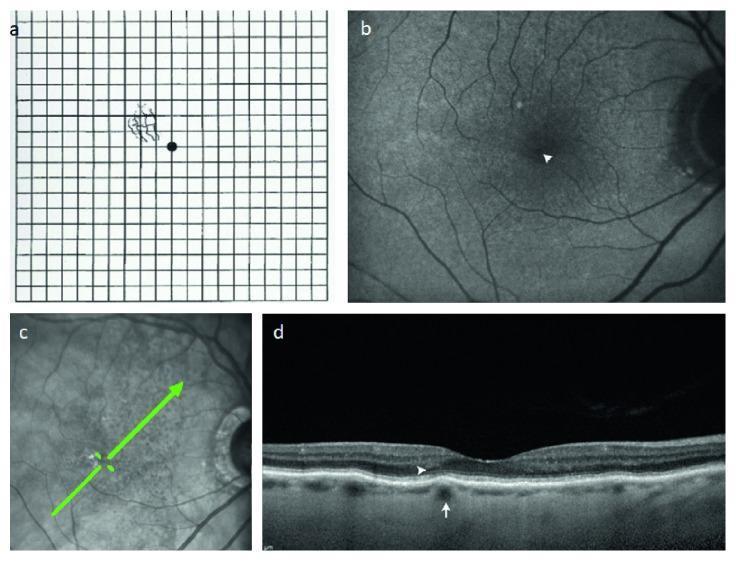
This four-panel image series illustrates the clinical and diagnostic findings of focal choroidal elevation (FCE) in a patient with atrophic age-related macular degeneration (ARMD). Panel (a) shows an Amsler grid with patient-drawn wavy, irregular lines (metamorphopsia) in the superior-nasal quadrant relative to the central fixation point. Panel (b) presents fundus autofluorescence (FAF) of the right eye, highlighting a pinpoint area of relative hypoautofluorescence (white arrowhead). Panel (c) is a scanning laser ophthalmoscopic (SLO) image with a green arrow indicating the scan location for the subsequent Spectral Domain Optical Coherence Tomography (SD-OCT). Panel (d) displays the SD-OCT cross-section, revealing a focal choroidal elevation (white arrow) characterized by a localized upward protrusion of the choroid. Overlying this elevation, a white arrowhead identifies a subtle disruption of the ellipsoid zone (IS/OS line), which corresponds to the area of metamorphopsia reported on the Amsler grid. The sequence demonstrates the anatomical correlation between deep choroidal structural changes and functional visual distortion in ARMD.

TABLE 6 TREATMENT RECOMMENDATIONS AND FOLLOW-UP FOR AGE-RELATED MACULAR DEGENERATION <table><thead><tr><th>Recommended Treatment</th><th>Diagnoses Eligible for Treatment</th><th>Follow-up Recommendations</th></tr></thead><tbody><tr><td></td><td></td><td>• Patients without subfoveal atrophy should be monitored for monocular near vision (reading/Amsler grid).</td></tr><tr><td>Antioxidant vitamin and mineral supplements as recommended in the original AREDS and AREDS2 reports<sup>5, 63</sup></td><td>• Intermediate AMD (AREDS category 3)<br>• Advanced AMD in one eye (AREDS category 4)</td><td>Return examination at 6–18 months if asymptomatic or prompt examination for new symptoms suggestive of CNV<br><br>• Monitoring of monocular near vision (reading/Amsler grid)<br>• Fundus photography and/or fundus autofluorescence as appropriate<br>• Fluorescein angiography and/or OCT for suspicion of CNV</td></tr></tbody></table>
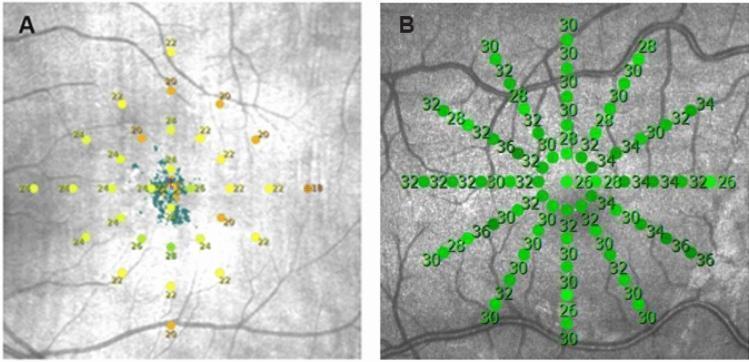
This diagnostic image displays two comparative grayscale fundus photographs (A and B) overlaid with microperimetry stimulus grids, used to assess macular functional sensitivity. Panel A illustrates a custom stimulus grid consisting of 33 test points arranged in a radial pattern at eccentricities of 0°, 1°, 3°, 5°, and 7° from the foveal fixation point. The points are color-coded (yellow, orange, green) to represent threshold sensitivity values in decibels (dB), superimposed on a macular region showing subtle pigmentary changes and central drusen characteristic of intermediate age-related macular degeneration (iAMD). Panel B shows a higher-density normative database grid (MAIA) with 61 points located at 0°, 1°, 2°, 3°, 4°, and 5° from fixation. In this panel, the points are uniform in color (green) and labeled with numerical sensitivity values. Both grids are centered on the macula, demonstrating the spatial distribution of functional testing relative to retinal vascular landmarks. These visuals serve as educational tools for understanding retinal sensitivity mapping in macular pathology and comparing different perimetric protocols.
Macular Function Tests
Introduction
- Detect early or subtle maculopathy
- Differentiate macular disease from optic nerve disease
- Predict post-operative visual prognosis (e.g., before cataract surgery)
- Monitor known macular disease
Classification
- Visual Acuity
- Amsler Grid
- Photostress Test (Macular Dazzle Test)
- Color Vision Tests
- Contrast Sensitivity
- Entoptic Phenomenon tests
- Maddox Rod Test
- 2-Point Discrimination Test
- Potential Acuity Meter (PAM)
- Laser Interferometry
- Electroretinogram (ERG) - Pattern ERG (PERG)
- Visual Evoked Potential (VEP)
- Fluorescein Angiography (FFA)
- Optical Coherence Tomography (OCT)
- Microperimetry
Detailed Tests
1. Visual Acuity
- Distance VA (Snellen chart)
- Near VA (Jaeger's chart)
- Color vision
- Contrast sensitivity
2. Amsler Grid
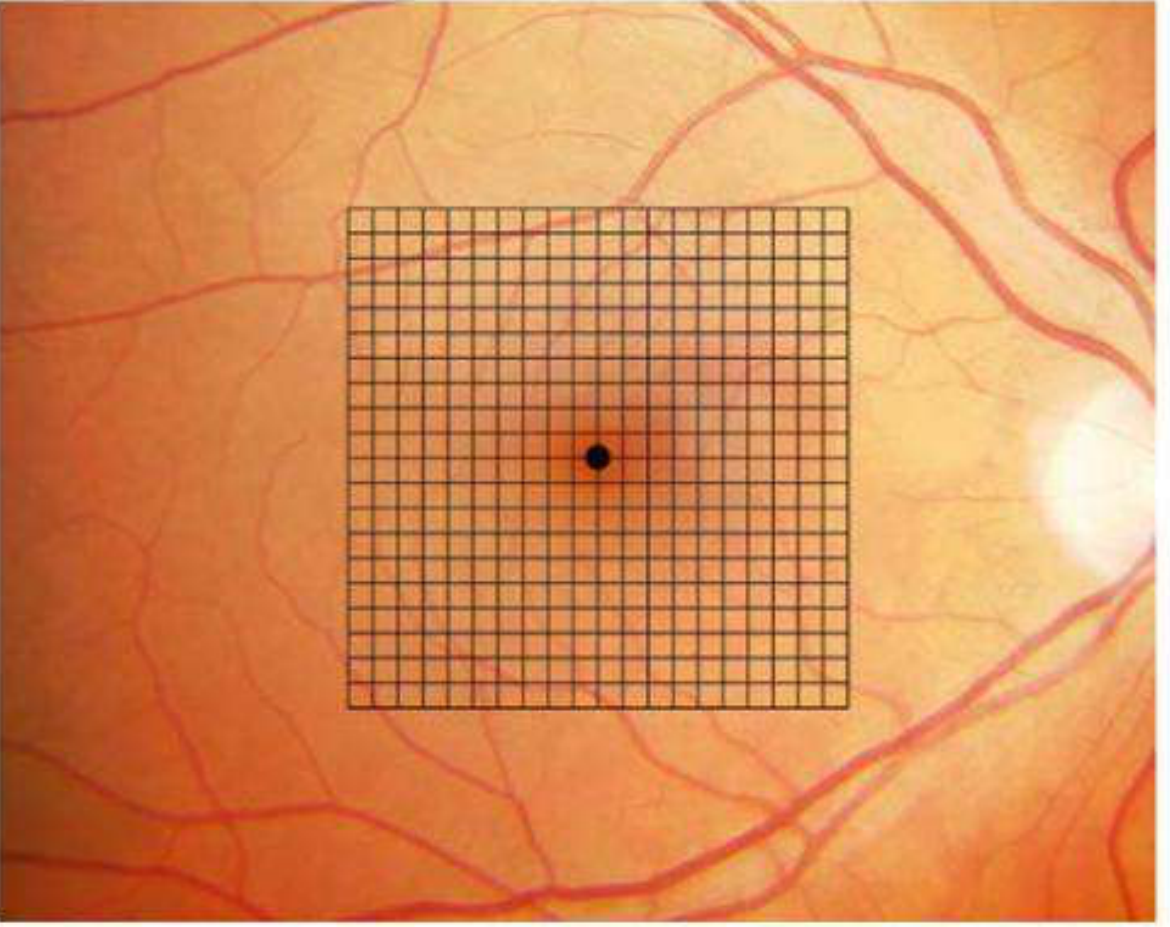
- Pupils should NOT be dilated (to avoid photostress effect)
- Tested before slit-lamp examination
- Presbyopic correction should be worn
- Each eye tested separately
| Chart | Design | Use |
|---|---|---|
| 1 | White grid on black background | Standard macular screening |
| 2 | Grid + diagonal lines | Central scotoma (aids fixation) |
| 3 | Red squares on black | Toxic maculopathy, optic neuropathy, chiasmal lesions |
| 4 | Random dots | Differentiates scotoma from metamorphopsia |
| 5 | Horizontal lines | Metamorphopsia, reading difficulty |
| 6 | White background, closer lines | Detailed metamorphopsia evaluation |
| 7 | Fine central grid (0.5° squares) | More sensitive detection |
3. Photostress Test (Macular Dazzle Test)
- Best-corrected distance VA is first measured
- A pen torch or indirect ophthalmoscope light is held ~3 cm from the eye for ~10 seconds
- The Photostress Recovery Time (PSRT) = time taken to read 3 letters of the pre-test acuity line
- Normal PSRT: 15-30 seconds
- The fellow (normal) eye is tested for comparison
- Macular disease: PSRT is prolonged (>50 seconds) in the affected eye
- Optic neuropathy: PSRT is normal (photoreceptors are intact)
- If PSRT of worse eye = better eye, macular disease is NOT the cause - suggests optic nerve disorder
4. Color Vision Testing
- Ishihara's pseudo-isochromatic plates - screening for red-green defects (X-linked, congenital)
- Farnsworth-Munsell 100 Hue Test - detailed, classifies color defect axis
- Farnsworth D-15 Panel - quick screening
- City University Color Vision Test
5. Contrast Sensitivity
- Snellen acuity tests only high-contrast targets
- Macular disease causes marked impairment for intermediate and higher spatial frequencies
- Measured using: Pelli-Robson chart, Vistech gratings, Cambridge Low Contrast Gratings
6. Entoptic Phenomenon Tests
- Transilluminate the sclera with a bright light in a dark room; move the light rapidly
- Patient perceives shadows of the retinal blood vessels (branching tree pattern)
- Normal macular function = patient perceives the vascular shadow
- Poor macular function = unable to perceive vasculature
- View a uniform blue light source - patient sees "corpuscles" (white blood cells) moving in perifoveal capillaries
- Normal: >15 corpuscles seen
- Abnormal: Partial/complete loss or slowing of corpuscle movement = poor retinal function
7. Maddox Rod Test (2-Point Discrimination)
- Two small lights are presented close together
- Normal: Patient perceives 2 separate lights
- Abnormal: Sees only one light (macular dysfunction)
- The Maddox rod is a series of parallel cylinders that converts a point of white light into a red line; useful in assessing macular integrity
8. Potential Acuity Meter (PAM)
9. Laser Interferometry
- Uses a laser to create interference fringes on the retina, bypassing media opacities
- Measures retinal resolution ability (spatial frequency)
- Less affected by refractive errors and cataracts than other tests
- Expressed as cycles/degree
- Used to predict post-cataract visual potential
10. Objective Tests
| Test | What it measures | Key notes |
|---|---|---|
| Pattern ERG (PERG) | Foveal/macular ganglion cell function | Reduced in macular disease and glaucoma |
| Flash ERG | Global rod and cone function | Scotopic ERG: rods; Photopic: cones |
| Visual Evoked Potential (VEP) | Cortical response; neural integrity | Affected in optic nerve and cortical disease |
| Microperimetry | Retinal sensitivity mapped to fundus image | Correlates structure (OCT) with function |
| OCT | Structural imaging of retinal layers | Gold standard for macular anatomy |
| Fluorescein Angiography (FFA) | Vascular integrity, leakage, ischemia | Identifies neovascularization, RPE disease |
Exam High-Yield Points
- Photostress test differentiates macular from optic nerve disease - prolonged PSRT (>50 s) = macular disease; normal PSRT = optic neuropathy
- Normal PSRT = 15-30 seconds (Kanski)
- Amsler grid covers central 20 degrees held at 33 cm; Chart 1 is standard, Chart 2 for central scotoma
- PAM and Laser interferometry predict visual prognosis before cataract surgery
- Entoptic phenomenon - perceiving retinal vessels = normal macula; blue field entoptic: >15 corpuscles = normal
- Color vision: tritan (blue-yellow) defects = macular/glaucoma; red-green = optic nerve/congenital
- Contrast sensitivity is more sensitive than Snellen for early maculopathy
- PERG is the electrophysiological test specifically for macular/foveal function
- Amsler grid should be tested before slit-lamp exam and with pupils undilated