
Make a note of macular function test
Reading File
Finding Sources
Finding Sources
Finding Sources
Finding Sources
Reading File
Finding Sources
Reading File
Reading File
Reading File
Reading File
Finding Sources
Loading Image
Finding Sources
Loading Image
Reading File
I have enough material to compile a comprehensive, well-structured note on macular function tests. Here is the complete note:
Macular Function Tests
Source: Kanski's Clinical Ophthalmology - A Systematic Approach, 10th Edition
The macula is responsible for central, high-resolution, and colour vision. Tests of macular function assess visual acuity, fixation, contrast sensitivity, colour vision, and photoreceptor integrity.
1. Visual Acuity (VA)
- Distance VA using Snellen or LogMAR (ETDRS) charts is the most fundamental macular function test, as the fovea drives fine-detail resolution.
- Near VA is a sensitive indicator for macular disease. Charts are held at a comfortable reading distance with appropriate corrections. The smallest legible type is recorded per eye.
- LogMAR charts are preferred in clinical trials due to greater accuracy.
2. Amsler Grid
The most practical bedside test of central macular function.
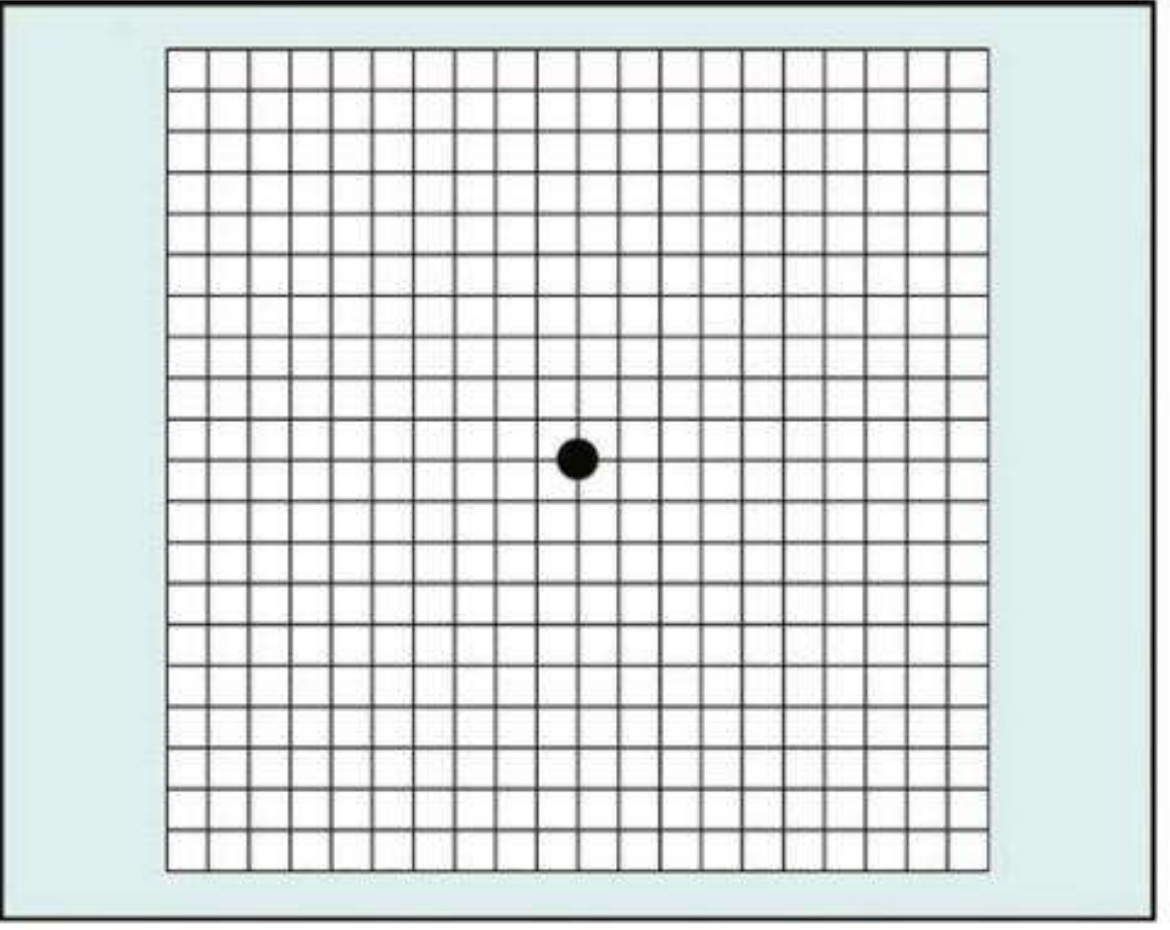
Purpose: Evaluates the central 20° of visual field centred on fixation. Detects metamorphopsia (distortion) and scotomas. Used for screening and home monitoring of macular disease (especially macular neovascularization).
Charts (7 total):
| Chart | Description | Use |
|---|---|---|
| 1 | White grid on black background; 400 squares, each 1° | Standard |
| 2 | Similar + diagonal lines | Aids fixation in central scotoma |
| 3 | Red squares on black | Detects subtle colour scotomas; toxic maculopathy, optic neuropathy |
| 4 | Random dots only | Distinguishes scotomas from metamorphopsia |
| 5 | Horizontal lines | Detects metamorphopsia along specific meridians; reading difficulty |
| 6 | White background, closer central lines | More detailed meridional evaluation |
| 7 | Fine central grid (0.5° squares) | More sensitive central testing |
Technique:
- Pupils should NOT be dilated; avoid slit-lamp examination beforehand (to prevent photostress effect)
- Chart held at ~33 cm, well illuminated
- One eye covered; patient fixes on central dot
- Asks about: distortion/waviness of lines, blank spots, ability to see all four corners and sides
- Macular disease - wavy/distorted lines (metamorphopsia)
- Optic neuropathy - missing or faint lines, no distortion
- Missing corner/border - raises possibility of glaucoma or retinitis pigmentosa
3. Photostress Test
A bedside test that differentiates macular disease from optic nerve disease.
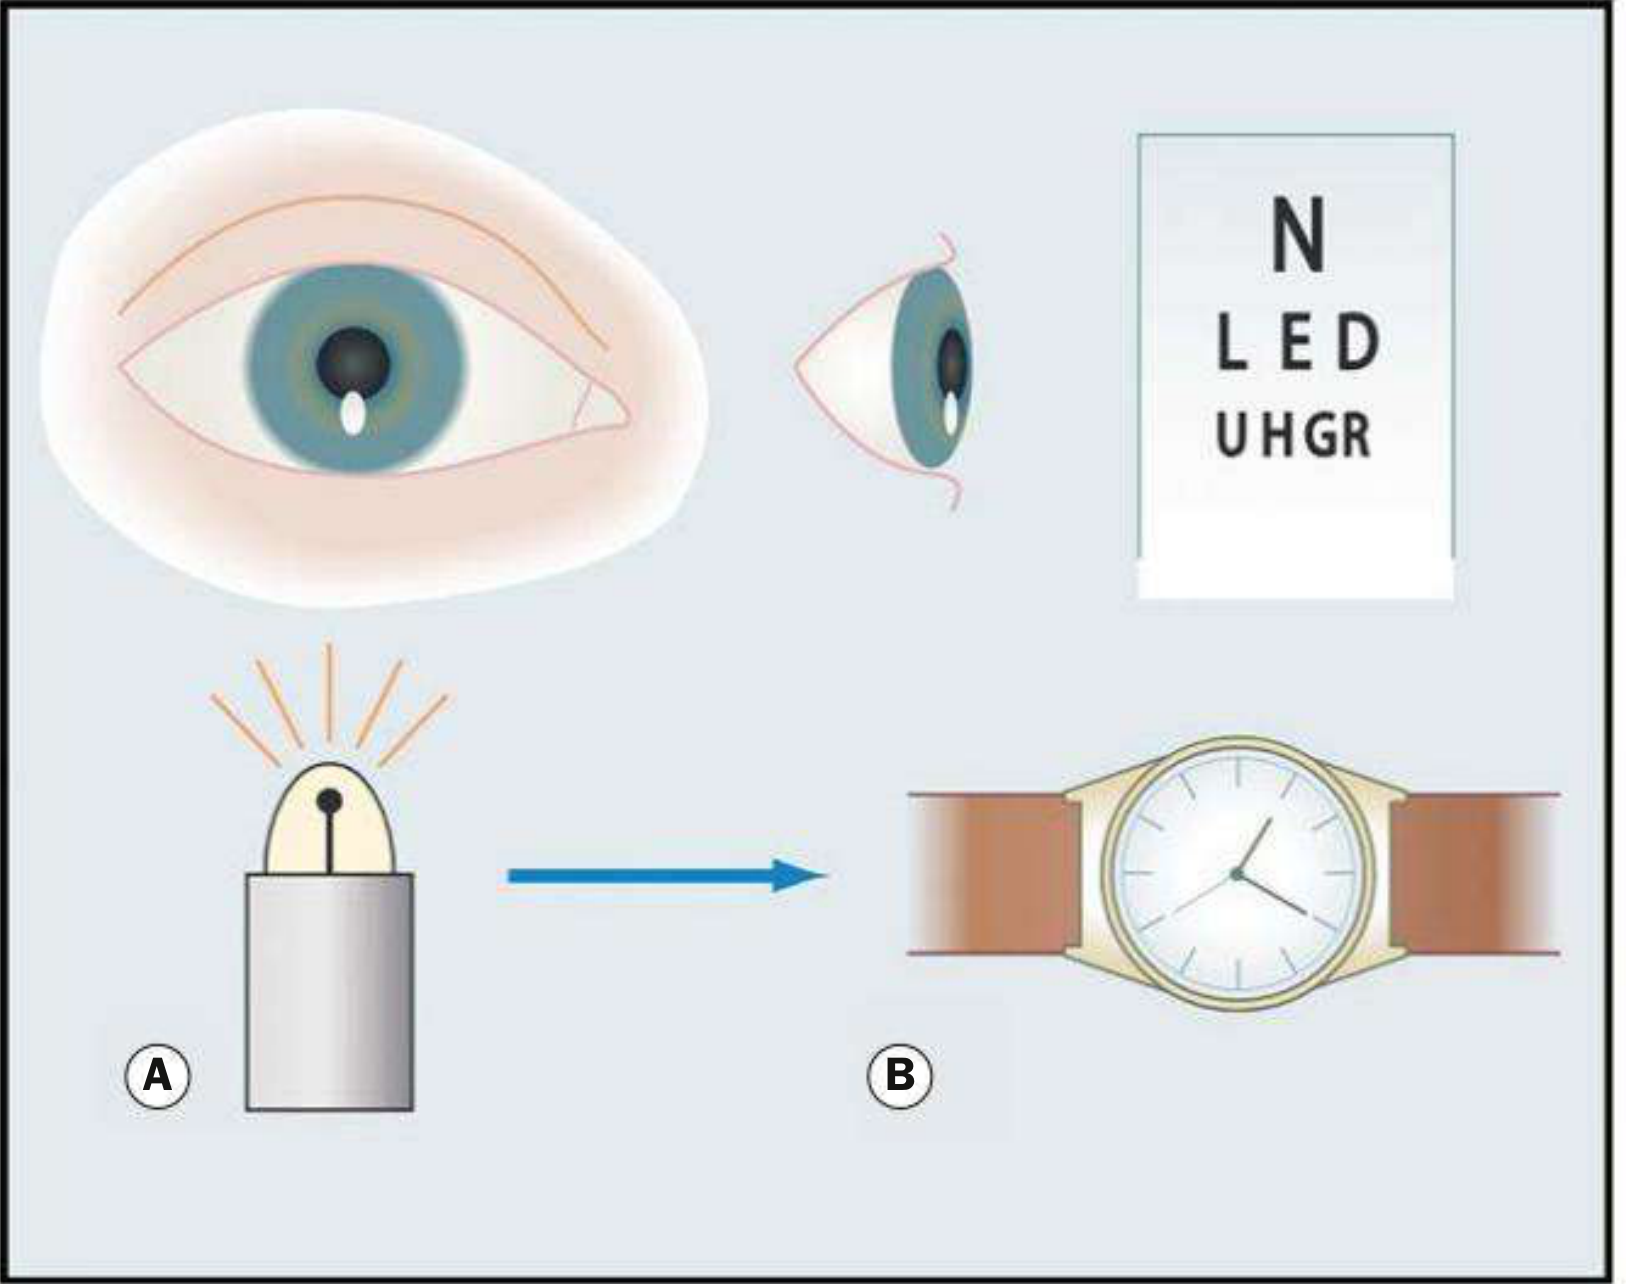
Principle: Bleaches visual pigment with bright light, creating a temporary scotoma. Recovery time depends on photoreceptor ability to re-synthesize visual pigment. Prolonged in macular disease because the RPE (retinal pigment epithelium) is involved in pigment regeneration.
Technique:
- Record best-corrected distance VA
- Patient fixates on a pen torch or indirect ophthalmoscope light held ~3 cm away for ~10 seconds
- Photostress Recovery Time (PSRT) = time taken to read any 3 letters of the pre-test VA line
- Repeat on the fellow (normal) eye and compare
Interpretation:
- Normal PSRT: 15-30 seconds
- Prolonged PSRT (sometimes >50 seconds) = macular disease (e.g., mild cystoid macular oedema, central serous retinopathy)
- Normal PSRT = optic neuropathy (the RPE is intact)
Clinical use: Useful when ophthalmoscopy is equivocal; differentiates macular from optic nerve visual loss.
4. Contrast Sensitivity
Principle: Measures the ability to distinguish an object from its background - different from high-contrast VA. Can be reduced while standard VA is preserved (e.g., amblyopia, optic neuropathy, cataracts, higher-order aberrations).
Tests:
- Pelli-Robson Chart - viewed at 1 metre; rows of equal-sized letters with decreasing contrast (0.15 log units per group of 3 letters). Patient reads until lowest-contrast triplet is reached.
- Sinusoidal gratings - patient views increasingly lower-contrast gratings.
- SPARCS (Spaeth-Richman) - computer-based; ~5-10 min per eye; measures both central and peripheral contrast sensitivity; suitable for illiterate patients.
Use: Useful for objectively demonstrating functional deficit in patients with good VA but subjective visual symptoms (especially in low illumination).
5. Colour Vision Testing
Relevance to macular function: Acquired macular disease tends to produce blue-yellow (tritan) defects; optic nerve lesions produce red-green defects.
Tests:
| Test | Description | Detects |
|---|---|---|
| Ishihara | 16 plates + 1 test plate; dot matrix patterns concealing numbers | Congenital protan and deuteran (red-green) defects; also assesses optic nerve function |
| City University | 10 plates; central colour + 4 peripheral colours; patient picks closest match | All types of acquired and congenital defects |
| Hardy-Rand-Rittler (HRR) | Similar to Ishihara | All 3 congenital colour defects (protan, deutan, tritan) |
| Farnsworth-Munsell 100-Hue | 85 colour caps arranged in sequence | Sensitive; congenital + acquired defects; identifies axis of colour deficiency |
| Farnsworth D-15 | Abbreviated version | Screening; identifies type of defect |
6. Microperimetry
Purpose: Measures retinal sensitivity and fixation stability in macular disease. Allows exact correlation between fundus pathology and functional abnormality. More sensitive than standard automated perimetry (SAP).
Instrument: MAIA perimeter - table-top, uses a line-scanning laser ophthalmoscope (SLO) with 850 nm illumination.
Technique:
- 20 minutes mesopic dark adaptation
- Fundus tracking via SLO
- Goldmann size 3 stimuli projected onto central 9° of fundus
- 4-2 staircase thresholding; 200 ms stimulus duration
- Normal retinal sensitivity: 18 dB
- Results: colour-coded sensitivity maps + fixation loss indices
Uses:
- Assessing therapeutic interventions on the macula
- Early glaucoma with subtle change near fixation
- Monitoring retinal dystrophies
7. Electrophysiological Tests
Electroretinogram (ERG)
- Records the electrical response of the retina to light stimulation
- Full-field ERG - global retinal function
- Pattern ERG - predominantly macular/ganglion cell function
- Multifocal ERG (mfERG) - simultaneously records responses from a distribution of retinal areas across the macular region while patient fixates; used to evaluate macular function topographically
Electro-oculogram (EOG)
- Measures the standing potential of the eye (RPE function)
- Arden ratio (light peak:dark trough) - normally >1.85
- Abnormal in Best vitelliform macular dystrophy (even in carriers with no fundus changes)
Visual Evoked Potential (VEP)
- Records cortical responses to visual stimuli
- Used to monitor macular pathway function and investigate non-organic visual loss
- Flash VEP or pattern VEP (checkerboard reversal)
Summary Table: Macular vs Optic Nerve Disease
| Test | Macular Disease | Optic Nerve Disease |
|---|---|---|
| Amsler grid | Wavy/distorted lines (metamorphopsia) | Missing/faint lines (no distortion) |
| Photostress test | Prolonged PSRT (>50 sec) | Normal PSRT |
| Colour vision | Blue-yellow defect | Red-green defect |
| Light brightness test | Usually normal (early/moderate disease) | Reduced brightness (afferent defect) |
| EOG | Abnormal in RPE disease (Best disease) | Normal |
Kanski's Clinical Ophthalmology - A Systematic Approach, 10th Edition, Chapter 1 (Ophthalmic Assessment)
This is a shared conversation. Sign in to Orris to start your own chat.