
Why there is hypoglycemia in alcohol intoxication
alcohol ethanol hypoglycemia gluconeogenesis mechanism
ethanol metabolism NADH gluconeogenesis inhibition hypoglycemia diagram
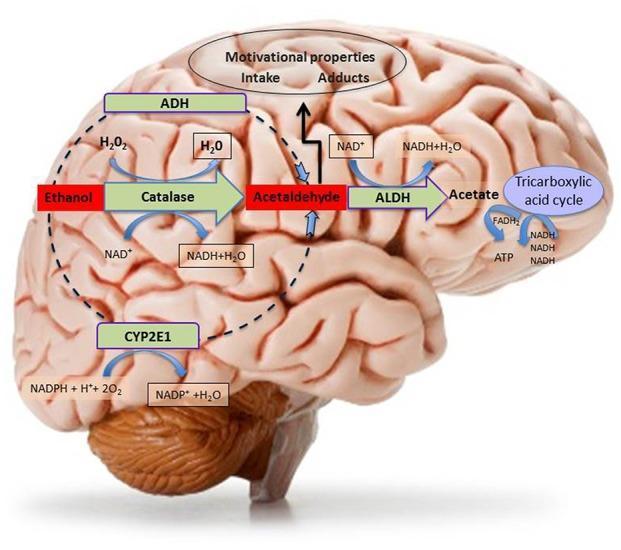
This medical illustration presents a pathophysiology diagram of the central metabolism of ethanol superimposed on a lateral view of the human brain. The diagram outlines three primary oxidative pathways for the conversion of ethanol to acetaldehyde within the CNS: 1) the Catalase pathway, requiring H2O2 and NAD+ co-factors; 2) the CYP2E1 (Cytochrome P450 2E1) pathway, involving NADPH and oxygen; and 3) the Alcohol Dehydrogenase (ADH) pathway. Acetaldehyde is subsequently metabolized into acetate by the enzyme Aldehyde Dehydrogenase (ALDH), a reaction coupled with the conversion of NAD+ to NADH. The resulting acetate enters the Tricarboxylic Acid (TCA) cycle to generate energy (ATP, NADH, FADH2). Additionally, the diagram illustrates the clinical significance of brain-generated acetaldehyde, indicating its role in motivational properties, ethanol intake, and the formation of adducts. This educational resource is designed to explain the biochemical basis of alcohol addiction and neurotoxicity, highlighting the regional metabolic processes that occur within brain tissue.
This pathophysiology diagram illustrates the mechanisms leading to post-operative hypoglycemia following the resection of pheochromocytoma and paraganglioma (PPGL). The algorithm starts with the surgical removal of the PPGL tumor, resulting in a sudden drop in catecholamine secretion. This drop triggers two main pathways. First, pre-operative insulin resistance combined with the removal of catecholamine-induced inhibition leads to increased insulin secretion from pancreatic beta cells, causing hyperinsulinism. Second, pre-operative use of beta-blockers results in beta-2 receptor blockade. This blockade inhibits both beta cells and alpha cells; specifically, it decreases glucagon secretion from alpha cells. The reduction in glucagon leads to diminished hepatic gluconeogenesis and glycogenolysis. The convergence of hyperinsulinism and decreased glucose production by the liver results in the clinical outcome of post-operative hypoglycemia. The diagram utilizes icons for the adrenal gland, pancreas, and liver to represent the multi-organ involvement in glucose homeostasis alterations post-PPGL resection.
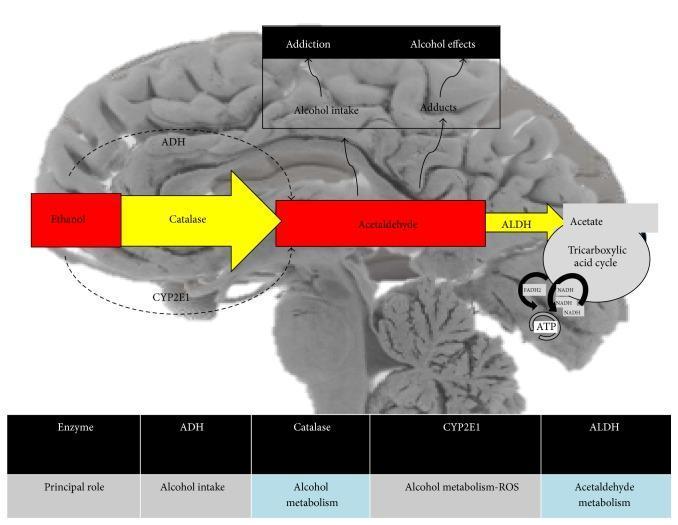
This pathophysiology diagram overlays the metabolic pathway of ethanol on a sagittal cross-section of a human brain. The illustration details the oxidative processes converting ethanol to acetaldehyde and subsequently to acetate. The primary pathway is facilitated by enzymes including Alcohol Dehydrogenase (ADH) and Catalase, represented by large yellow arrows, alongside the Cytochrome P450 2E1 (CYP2E1) system. Acetaldehyde is further processed by Aldehyde Dehydrogenase (ALDH) into acetate, which then enters the Tricarboxylic acid (TCA) cycle (Krebs cycle) to generate energy in the form of ATP, with associated cofactors NADH and FADH2. The diagram also highlights clinical associations with ethanol consumption in the brain, including 'Addiction,' 'Alcohol intake,' 'Alcohol effects,' and the formation of 'Adducts.' A supplementary table at the bottom summarizes the principal roles of the key metabolic enzymes: ADH (alcohol intake), Catalase (alcohol metabolism), CYP2E1 (alcohol metabolism and Reactive Oxygen Species/ROS generation), and ALDH (acetaldehyde metabolism). This educational resource illustrates the biochemical mechanisms of alcohol processing and neurobiological impact.
Hypoglycemia in Alcohol Intoxication
The Core Problem: NADH Overload
- Ethanol → Acetaldehyde (by alcohol dehydrogenase, ADH)
- Acetaldehyde → Acetate (by aldehyde dehydrogenase, ALDH)
"In each reaction, electrons are transferred to oxidized nicotinamide adenine dinucleotide (NAD+), resulting in an increase in the ratio of the reduced form (NADH) to NAD+."
- Lippincott's Biochemistry, 8th ed.
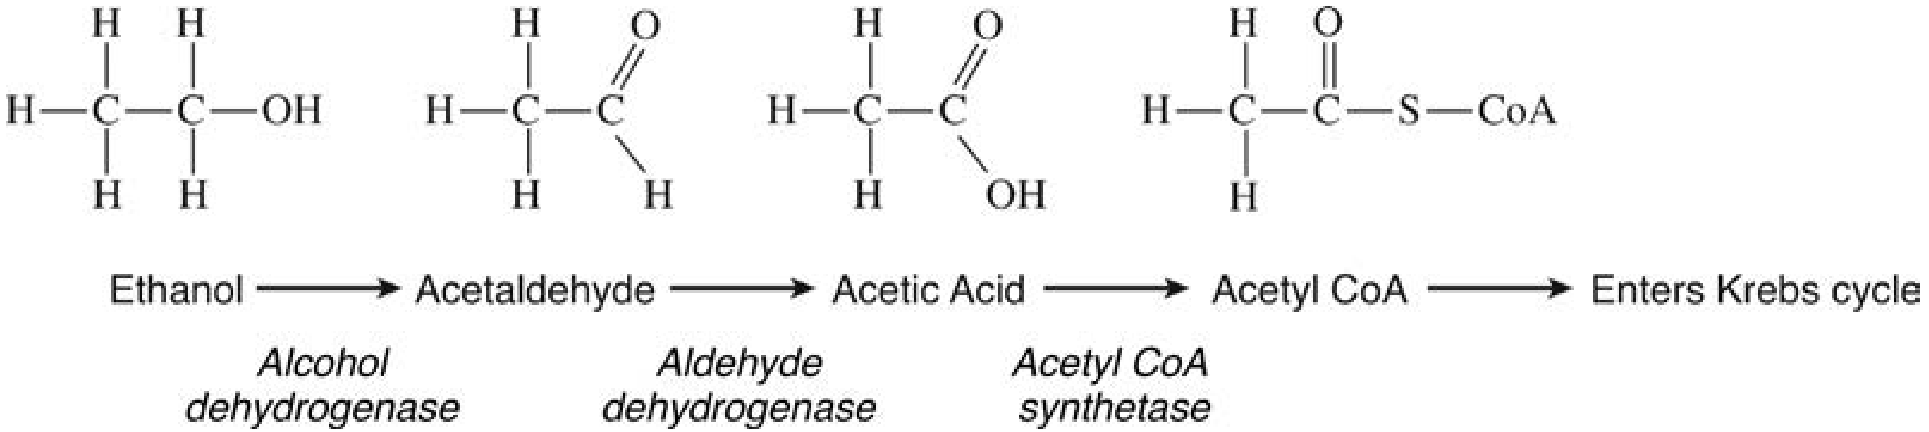
How High NADH Blocks Gluconeogenesis
- Glycogenolysis - breaking down glycogen stores
- Gluconeogenesis - synthesizing glucose from precursors
| Substrate | What Happens Under High NADH |
|---|---|
| Pyruvate | Reduced to lactate (NADH drives lactate dehydrogenase backward: pyruvate + NADH → lactate + NAD+) |
| Oxaloacetate (OAA) | Reduced to malate (malate dehydrogenase: OAA + NADH → malate + NAD+) |
| Glycerol | Blocked from entering gluconeogenesis |
| Alanine | Transaminated to pyruvate, which is then diverted to lactate |
- Pyruvate → Lactate means pyruvate cannot be converted to glucose via pyruvate carboxylase
- OAA → Malate means OAA is unavailable to act as the key intermediate in the gluconeogenic pathway
"The ethanol-mediated increase in NADH causes these gluconeogenic precursors to be diverted into alternate pathways, resulting in the decreased synthesis of glucose."
Why Glycogen Cannot Compensate
- Fasting or malnourished individuals - glycogen stores already depleted
- Chronic alcoholics - poor nutrition means minimal glycogen reserves
- Children - smaller glycogen stores relative to metabolic demand
- People who drank on an empty stomach - no recent carbohydrate intake to replenish glycogen
"Ethanol ingestion may cause hypoglycemia, usually in children and malnourished individuals due to low glycogen stores and reduced gluconeogenesis."
Additional Contributor: Alcoholic Ketoacidosis
- Ketoacidosis alongside hypoglycemia
- Further worsening of the metabolic picture, especially in alcoholic ketoacidosis (AKA)
Clinical Consequences
- Hypoglycemia can mimic or worsen the behavioral effects of intoxication: agitation, impaired judgment, combativeness, and altered consciousness
- This is why a glucose check is mandatory in any altered/intoxicated patient - you cannot distinguish hypoglycemia from intoxication clinically
- Patients on insulin who drink alcohol are at particularly high risk, since the drug-plus-gluconeogenesis-block effect is compounded
Summary Diagram (Mechanism at a Glance)
Ethanol
   ↓ (ADH) → NAD+ → NADH ↑↑
Acetaldehyde
   ↓ (ALDH) → NAD+ → NADH ↑↑
Acetate

NADH ↑↑ Effect on Liver:
  Pyruvate → Lactate        } Gluconeogenesis
  OAA → Malate              } BLOCKED
  Glycerol → blocked        }

If glycogen stores empty → HYPOGLYCEMIA
OAA unavailable → Acetyl-CoA → Ketones → KETOACIDOSIS
- Lippincott's Illustrated Reviews: Biochemistry, 8th ed., pp. 887-888
- Tintinalli's Emergency Medicine, A Comprehensive Study, p. 1264
- Basic Medical Biochemistry: A Clinical Approach, 6th ed.