
Flow chart on hypersensitivity 1 reaction
type I hypersensitivity IgE mast cell sensitization degranulation mechanism
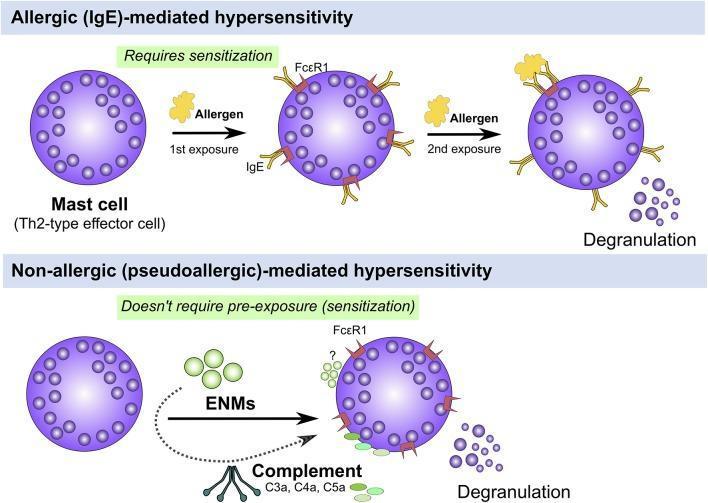
A comparative pathophysiology diagram illustrating two mechanisms of mast cell activation and degranulation in hypersensitivity. The top panel depicts 'Allergic (IgE)-mediated hypersensitivity,' showing a multi-step process: initial sensitization where an allergen exposure leads to IgE antibodies binding to Fć̵R1 receptors on a Th2-type effector mast cell, followed by a second exposure where allergen cross-linking of the IgE-Fć̵R1 complex triggers degranulation. The bottom panel depicts 'Non-allergic (pseudoallergic)-mediated hypersensitivity,' highlighting that this pathway does not require prior sensitization. Instead, activation is triggered by direct interaction with Engineered Nanomaterials (ENMs) or anaphylatoxins from the complement system (C3a, C4a, C5a), leading directly to the release of intracellular granules. Visually, mast cells are shown as spherical purple cells with dense internal granules that are expelled into the extracellular space upon activation. The diagram serves as an educational tool to distinguish classic Type I hypersensitivity from direct mast cell triggers relevant to toxicology and immunology.
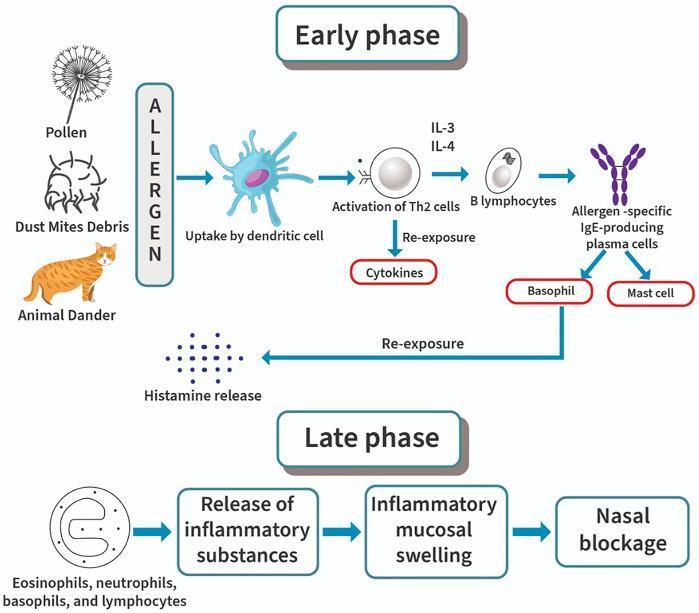
This pathophysiology diagram illustrates the two-phase immunological response in allergic rhinitis. The 'Early Phase' section details the sensitization process, starting with allergens such as pollen, dust mite debris, and animal dander being uptaken by dendritic cells. This triggers the activation of Th2 cells, which release cytokines and stimulate B lymphocytes via IL-3 and IL-4. These B cells differentiate into allergen-specific IgE-producing plasma cells that bind to basophils and mast cells. Upon allergen re-exposure, these sensitized cells undergo degranulation, leading to immediate histamine release. The 'Late Phase' section depicts the subsequent inflammatory cascade occurring hours later, characterized by the recruitment and infiltration of eosinophils, neutrophils, basophils, and lymphocytes. This influx results in the release of inflammatory substances, causing inflammatory mucosal swelling and culminating in clinical nasal blockage. The diagram serves as an educational tool for understanding Type I hypersensitivity and the transition from acute mast cell-mediated symptoms to chronic inflammatory tissue changes in the nasal mucosa.
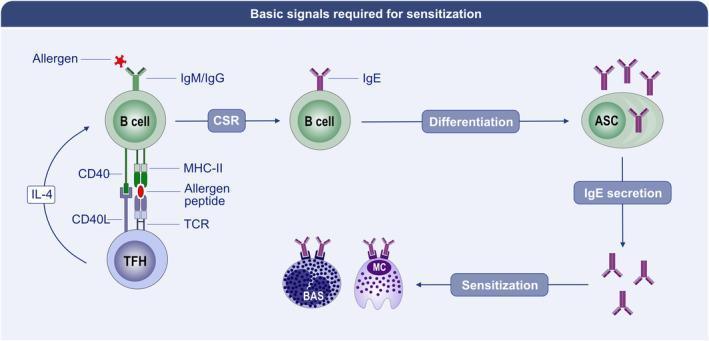
This pathophysiology diagram illustrates the cellular and molecular sequence of events leading to allergic sensitization. The process begins with an allergen binding to a B cell receptor (IgM/IgG). The B cell acts as an antigen-presenting cell, displaying allergen peptides via MHC-II to a T follicular helper (TFH) cell's T cell receptor (TCR). This interaction is mediated by costimulation between CD40 on the B cell and CD40L on the TFH cell, alongside TFH secretion of Interleukin-4 (IL-4). These signals trigger class-switch recombination (CSR), causing the B cell to switch to IgE production. The IgE-switched B cell then undergoes differentiation into an IgE antibody-secreting cell (ASC). Secreted IgE antibodies circulate and bind to high-affinity IgE receptors (FcεRI) on the surface of basophils (BAS) and mast cells (MC). This binding, termed sensitization, primes these effector cells for future degranulation upon re-exposure to the specific allergen. The diagram highlights the critical role of T-B cell cross-talk in the pathogenesis of Type I hypersensitivity.
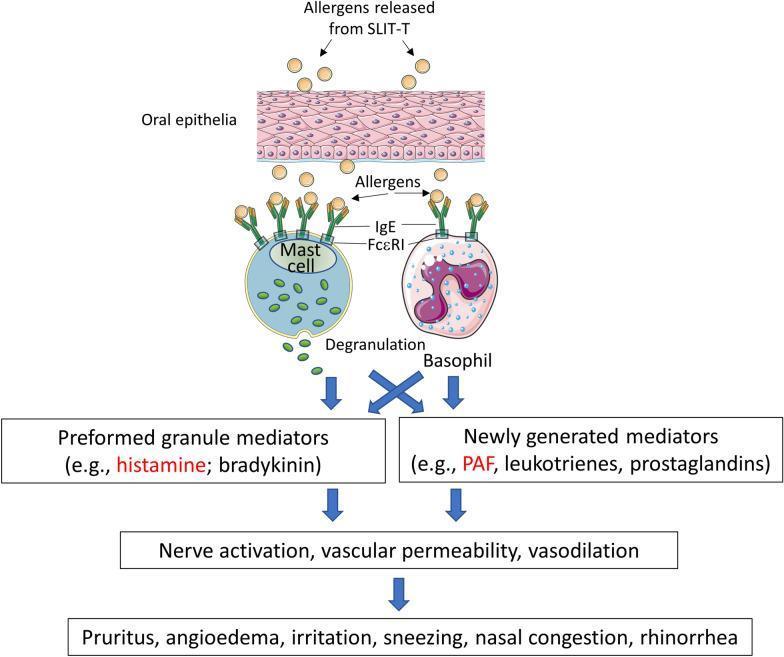
This pathophysiology diagram illustrates the biological mechanism of local allergic reactions induced by sublingual immunotherapy tablets (SLIT-T). The process begins with the release of allergens from SLIT-T into the oral epithelia. These allergens cross the epithelial barrier and bind to IgE antibodies complexed with FcεRI receptors on the surface of mast cells and basophils. This cross-linking triggers mast cell degranulation, releasing preformed granule mediators such as histamine and bradykinin. Simultaneously, it stimulates basophils to produce newly generated mediators, including platelet-activating factor (PAF), leukotrienes, and prostaglandins. The flowchart then maps these inflammatory mediators to their downstream physiological effects: nerve activation, increased vascular permeability, and vasodilation. Finally, the diagram lists the resulting clinical symptoms, such as pruritus, angioedema, irritation, sneezing, nasal congestion, and rhinorrhea. This educational resource summarizes the Type I hypersensitivity response specific to the sublingual route of allergen administration.
A detailed medical educational flowchart showing the mechanism of Type I (Immediate) Hypersensitivity reaction. The flowchart has two main phases clearly labeled: SENSITIZATION PHASE and EFFECTOR PHASE. SENSITIZATION PHASE (top section, blue background): Step 1: First Allergen Exposure box - shows allergen (pollen, dust mites, food, venom) entering the body Arrow down to Step 2: Antigen Presenting Cells (Dendritic Cells/APCs) capture allergen and present to T cells Arrow down to Step 3: Naive CD4+ T cell differentiates into Th2 cell (driven by IL-4, IL-13 from epithelial cells, TSLP, IL-25, IL-33) Arrow down to Step 4: Th2 cells produce cytokines box showing: IL-4, IL-5, IL-13 Arrow from IL-4/IL-13 to Step 5: B cell class switching to IgE production (plasma cells) Arrow down to Step 6: IgE antibodies bind to FcεRI receptors on Mast Cells and Basophils = SENSITIZATION COMPLETE Note box: IL-5 activates eosinophils EFFECTOR PHASE (bottom section, orange/red background): Step 7: Second Allergen Exposure - same allergen re-enters Arrow down to Step 8: Allergen cross-links IgE-FcεRI complexes on mast cells Arrow down to Step 9: Mast Cell Degranulation / Activation (central large box) Three arrows branching down to mediator groups: Left branch - PREFORMED MEDIATORS (minutes): Histamine, Tryptase, Heparin, Chondroitin sulfate → Effects: Vasodilation, increased vascular permeability, smooth muscle contraction, mucus secretion, bronchoconstriction Middle branch - NEWLY SYNTHESIZED LIPID MEDIATORS (minutes): Prostaglandin D2 (PGD2) → Bronchoconstriction, mucus secretion; Leukotrienes LTC4/LTD4 → Intense bronchoconstriction, vascular permeability; LTB4 → Chemotaxis of neutrophils/eosinophils; PAF → Platelet aggregation Right branch - CYTOKINES (hours - Late Phase): TNF, IL-4, IL-5, IL-13, Chemokines → Eosinophil, neutrophil, basophil, monocyte, T cell recruitment → Tissue damage, mucosal injury Bottom section showing CLINICAL MANIFESTATIONS in boxes: - SYSTEMIC: Anaphylaxis (shock, airway obstruction) - RESPIRATORY: Asthma, Allergic Rhinitis (hay fever) - SKIN: Urticaria, Angioedema, Atopic Dermatitis - GI: Food allergy, gastroenteritis - EYES: Allergic Conjunctivitis Timeline bar at bottom: Immediate reaction (0-30 min) vs Late-phase reaction (2-24 hours later) Color coding: sensitization phase in cool blue tones, effector/early phase in warm orange, late phase in red, clinical manifestations in green boxes. Clean professional medical textbook style with clear arrows and labels.
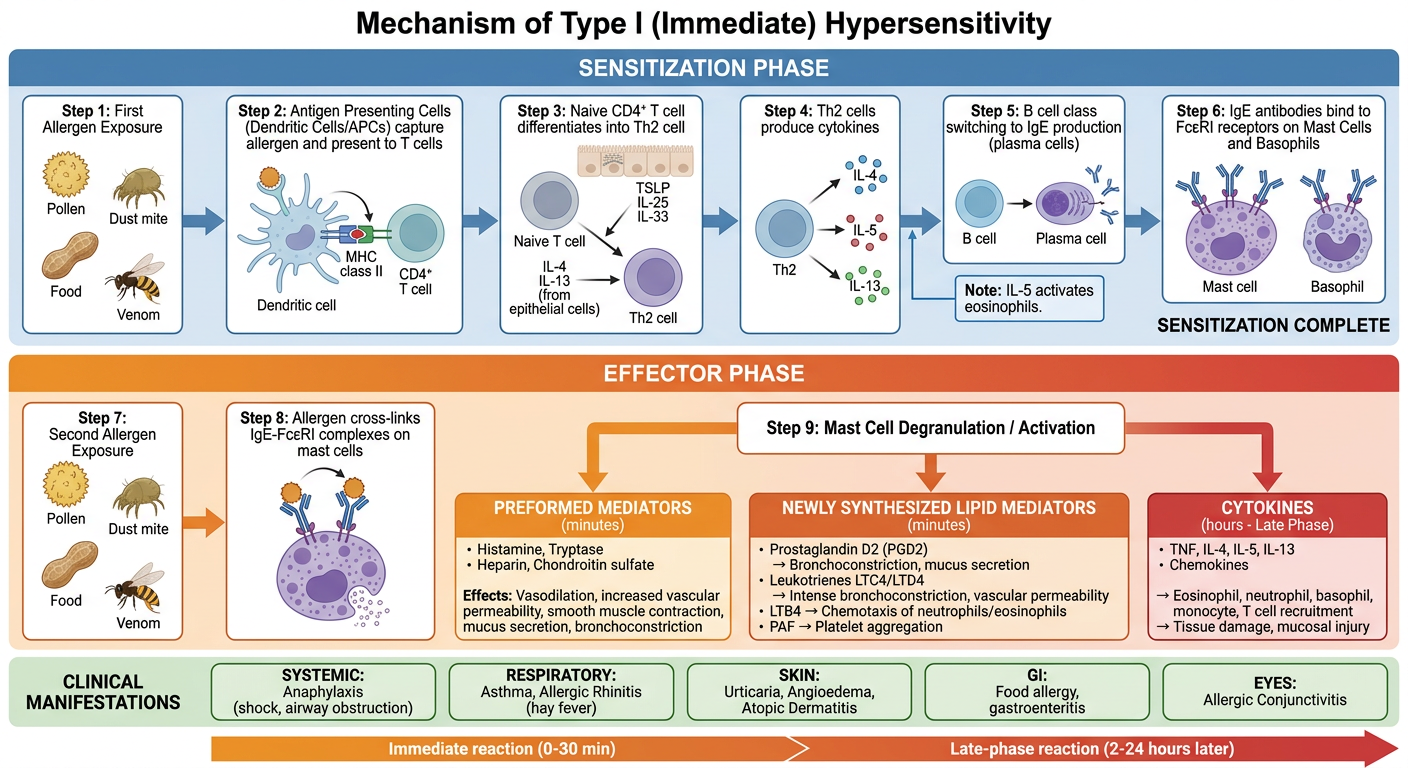
Type I (Immediate) Hypersensitivity - Key Steps
Phase 1: Sensitization (First Exposure)
- Allergen entry - Environmental antigens (pollen, dust mites, food, venom) enter the body
- Antigen presentation - Dendritic cells/APCs capture the allergen; injured epithelia release IL-25, IL-33, TSLP
- Th2 differentiation - Naive CD4+ T cells differentiate into Th2 cells under cytokine influence
- Cytokine secretion - Th2 cells produce IL-4, IL-5, IL-13
- IL-4 + IL-13 → B cell class-switching to IgE
- IL-5 → eosinophil activation
- IL-13 → mucus secretion by epithelium
- Mast cell sensitization - Secreted IgE binds to FcεRI receptors on mast cells and basophils
- No symptoms yet; individual is now sensitized
Phase 2: Effector Response (Re-exposure)
- Allergen re-exposure triggers cross-linking of IgE-FcεRI complexes
- Mast cell activation/degranulation → release of three mediator groups:
| Mediator Group | Examples | Effects |
|---|---|---|
| Preformed granule (seconds-minutes) | Histamine, tryptase, heparin | Vasodilation, increased permeability, bronchoconstriction, mucus secretion |
| Newly synthesized lipid (minutes) | PGD2, LTC4, LTD4, LTB4, PAF | Intense bronchoconstriction (LTC4/LTD4 = 1000x more potent than histamine), chemotaxis |
| Cytokines (hours) | TNF, IL-4, IL-5, IL-13, chemokines | Late-phase inflammation, eosinophil/neutrophil recruitment, tissue injury |
Two Phases of Clinical Reaction
| Phase | Timing | Features |
|---|---|---|
| Immediate reaction | 0-30 minutes | Vasodilation, edema, smooth muscle spasm |
| Late-phase reaction | 2-24 hours later | Eosinophils, neutrophils, tissue destruction (no new antigen needed) |
Clinical Manifestations
- Systemic: Anaphylaxis (most severe - can be fatal)
- Respiratory: Bronchial asthma, allergic rhinitis (hay fever)
- Skin: Urticaria (hives), angioedema, atopic dermatitis
- GI: Food allergy, gastroenteritis
- Eyes: Allergic conjunctivitis
- Atopic individuals have higher IgE levels and more IL-4-producing Th2 cells
- Mast cells are also activated (non-IgE) by C3a/C5a (anaphylatoxins), morphine, codeine, cold, heat
- Basophils are the circulating equivalent of tissue mast cells
- The Th2 response has a physiological role - protection against helminths