
Pathogenesis of right heart failure and left heart failure and clinical features, investigations and management Give me a LAQ answer for mbbs proff exam to get 90 percent marks
heart failure pathophysiology diagram left right ventricular
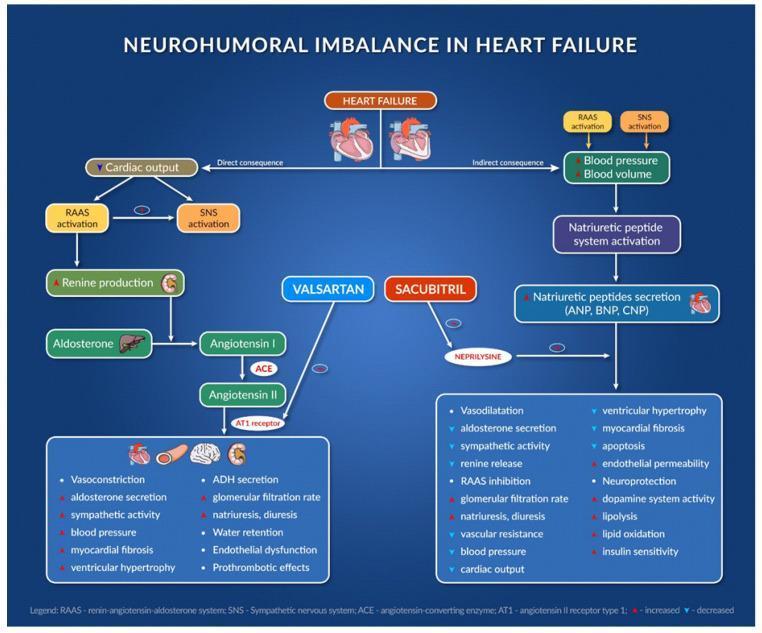
A complex pathophysiology diagram and pharmacological flowchart titled 'Neurohumoral Imbalance in Heart Failure'. It illustrates the interaction between the Renin-Angiotensin-Aldosterone System (RAAS), the Sympathetic Nervous System (SNS), and the Natriuretic Peptide (NP) system in the context of heart failure. The left side of the diagram outlines the RAAS cascade: Renin production leads to Angiotensin I, which is converted to Angiotensin II by ACE, ultimately binding to the AT1 receptor to cause deleterious effects like vasoconstriction, myocardial fibrosis, and water retention. The right side shows the NP system (ANP, BNP, CNP) which promotes diuresis and vasodilation. Centrally, the diagram depicts the pharmacological intervention of the ARNI class: Valsartan (an ARB) inhibiting the AT1 receptor, and Sacubitril (a neprilysin inhibitor) preventing the breakdown of natriuretic peptides. A comparison list at the bottom contrasts the pathological effects of uncontrolled RAAS/SNS activation against the beneficial physiological outcomes of ARNI therapy, including reduced ventricular hypertrophy, increased insulin sensitivity, and improved cardiac output. The diagram uses standard medical icons for the heart, kidneys, and liver to indicate anatomical sites of hormone production and action.
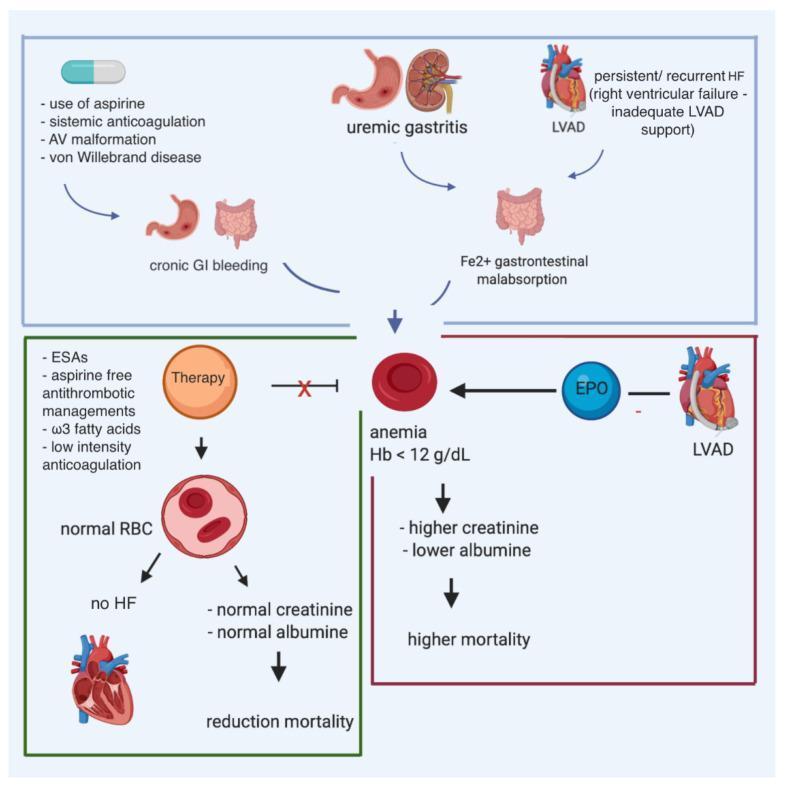
This pathophysiology diagram illustrates the multifactorial causes and consequences of anemia in patients with heart failure (HF) and a left ventricular assist device (LVAD). The top section identifies contributors to anemia, including chronic gastrointestinal (GI) bleeding secondary to aspirin use, systemic anticoagulation, arteriovenous (AV) malformations, and von Willebrand disease. Other contributing factors shown are uremic gastritis, iron (Fe2+) malabsorption, and persistent right ventricular failure. Central to the diagram is the manifestation of anemia (defined as Hemoglobin < 12 g/dL), which correlates with elevated creatinine, decreased albumin, and increased mortality. The diagram also highlights therapeutic interventions such as erythropoiesis-stimulating agents (ESAs), aspirin-free antithrombotic management, omega-3 fatty acids, and low-intensity anticoagulation. Successful therapy is depicted as leading to normal red blood cell (RBC) counts, resolution of heart failure symptoms, and reduced mortality. The role of erythropoietin (EPO) is also noted in the context of LVAD-related anemia management.
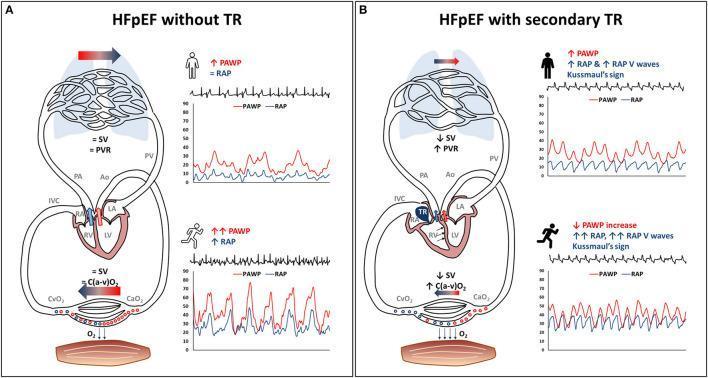
This pathophysiology diagram illustrates the hemodynamic differences between patients with heart failure with preserved ejection fraction (HFpEF) without tricuspid regurgitation (TR) (Panel A) and those with secondary tricuspid regurgitation (STR) (Panel B) during rest and exercise. The visual combines cardiovascular circuit diagrams with pressure tracings for pulmonary artery wedge pressure (PAWP) and right atrial pressure (RAP). In typical HFpEF (left), exercise triggers a steep increase in PAWP and a mild increase in RAP, maintaining relatively normal stroke volume (SV) and pulmonary vascular resistance (PVR). Conversely, HFpEF with STR (right) shows right atrial hypertension with prominent RAP V waves and Kussmaul's sign. Hemodynamic features in the STR group include a flatter PAWP rise during exercise, significantly reduced forward SV, and increased PVR, representing pulmonary vascular derecruitment and left ventricular underfilling. The diagram also highlights a greater reliance on peripheral oxygen extraction, indicated by a higher arteriovenous oxygen difference (C(a-v)O2) in the STR phenotype to compensate for low cardiac output during physical exertion.
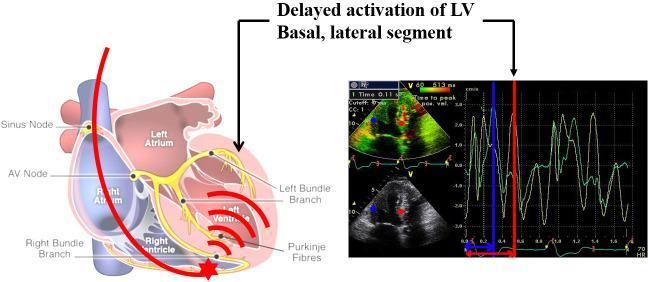
This composite medical illustration demonstrates the pathophysiology of right ventricular (RV) pacing-induced left ventricular (LV) dyssynchrony. The left side features a schematic anatomical diagram of the heart showing the cardiac conduction system (Sinus node, AV node, Bundle branches, and Purkinje fibers). A red line represents a pacing lead traversing the right atrium to the RV apex (marked by a red star). Red wavefront arcs illustrate electrical activation spreading from the RV pacing site to the LV, highlighting the late activation of the LV lateral wall. The right side contains diagnostic images, including a color tissue Doppler echocardiogram and a corresponding velocity-time tracing. The Doppler tracing shows two distinct myocardial velocity curves (green) with vertical blue and red marker lines indicating the significant temporal delay between segmental contractions. A label and arrows point to both the LV basal lateral segment on the diagram and the delayed peak on the Doppler tracing, identifying the mechanical dyssynchrony resulting from the non-physiological electrical sequence of RV apical pacing.
HEART FAILURE - LEFT AND RIGHT
Long Answer Question (LAQ) - MBBS Prof Standard
DEFINITION
CLASSIFICATION
| Type | Ejection Fraction | Description |
|---|---|---|
| HFrEF | < 40% | Heart failure with reduced EF (systolic failure) |
| HFmrEF | 40-49% | Mildly reduced EF |
| HFpEF | ≥ 50% | Preserved EF (diastolic failure) |
- Class I: No limitation of physical activity
- Class II: Slight limitation; comfortable at rest
- Class III: Marked limitation; comfortable only at rest
- Class IV: Symptoms at rest; any activity causes discomfort
PART 1: LEFT HEART FAILURE (LHF)
CAUSES
- Ischemic heart disease (IHD) - most common
- Systemic hypertension
- Aortic and mitral valvular disease (stenosis or regurgitation)
- Primary myocardial disease (dilated cardiomyopathy, myocarditis)
- Arrhythmias
PATHOGENESIS
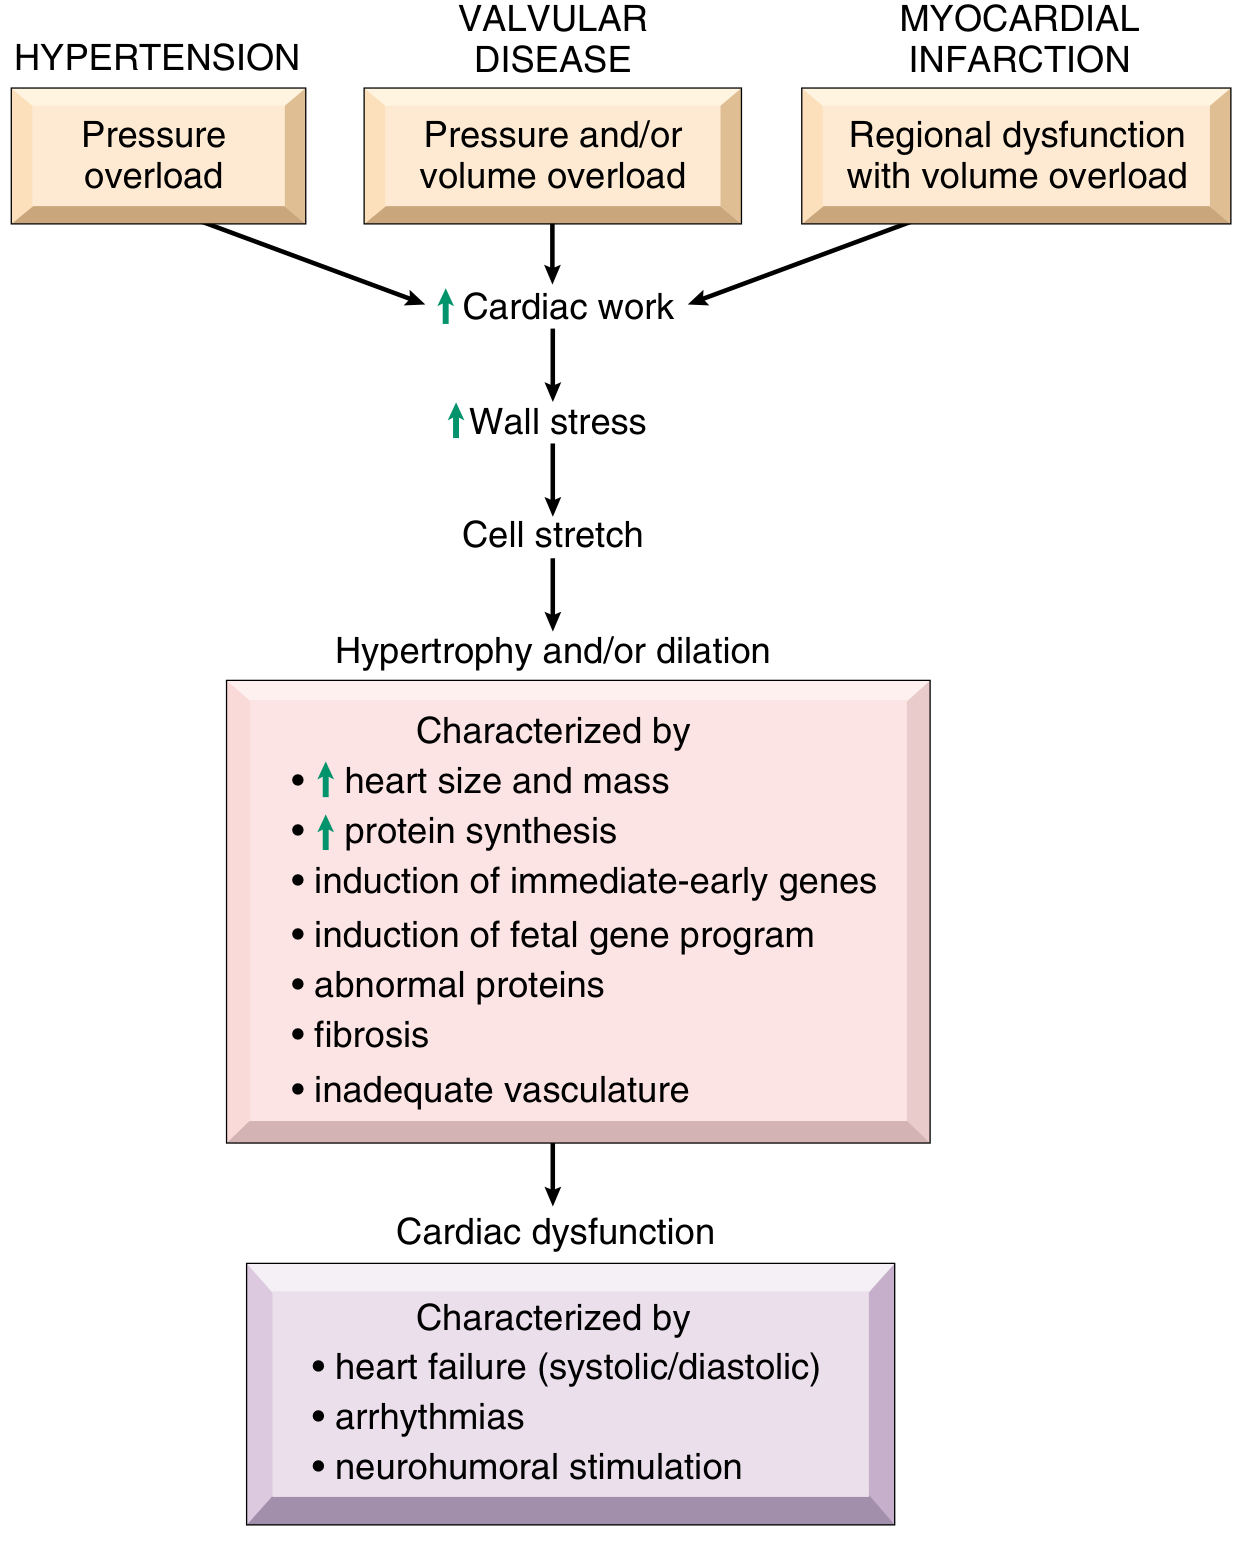
- Pressure overload → new sarcomeres assemble in parallel → concentric hypertrophy (increased wall thickness)
- Volume overload → new sarcomeres assemble in series → eccentric hypertrophy (ventricular dilation)
- Immediate-early genes (FOS, JUN, MYC) are induced, followed by expression of fetal gene programs (fetal myosin, natriuretic peptides, collagen)
- Capillary density does NOT increase proportionally with hypertrophy → relative ischemia
- Interstitial fibrosis develops from activated fibroblasts → impaired diastolic filling
- Ca²⁺ handling is impaired: SERCA pump dysfunction → reduced SR Ca²⁺ reuptake
- Phosphorylation of RyR channels → SR Ca²⁺ leakage → arrhythmias
- Apoptosis of myocytes accelerates → net muscle loss
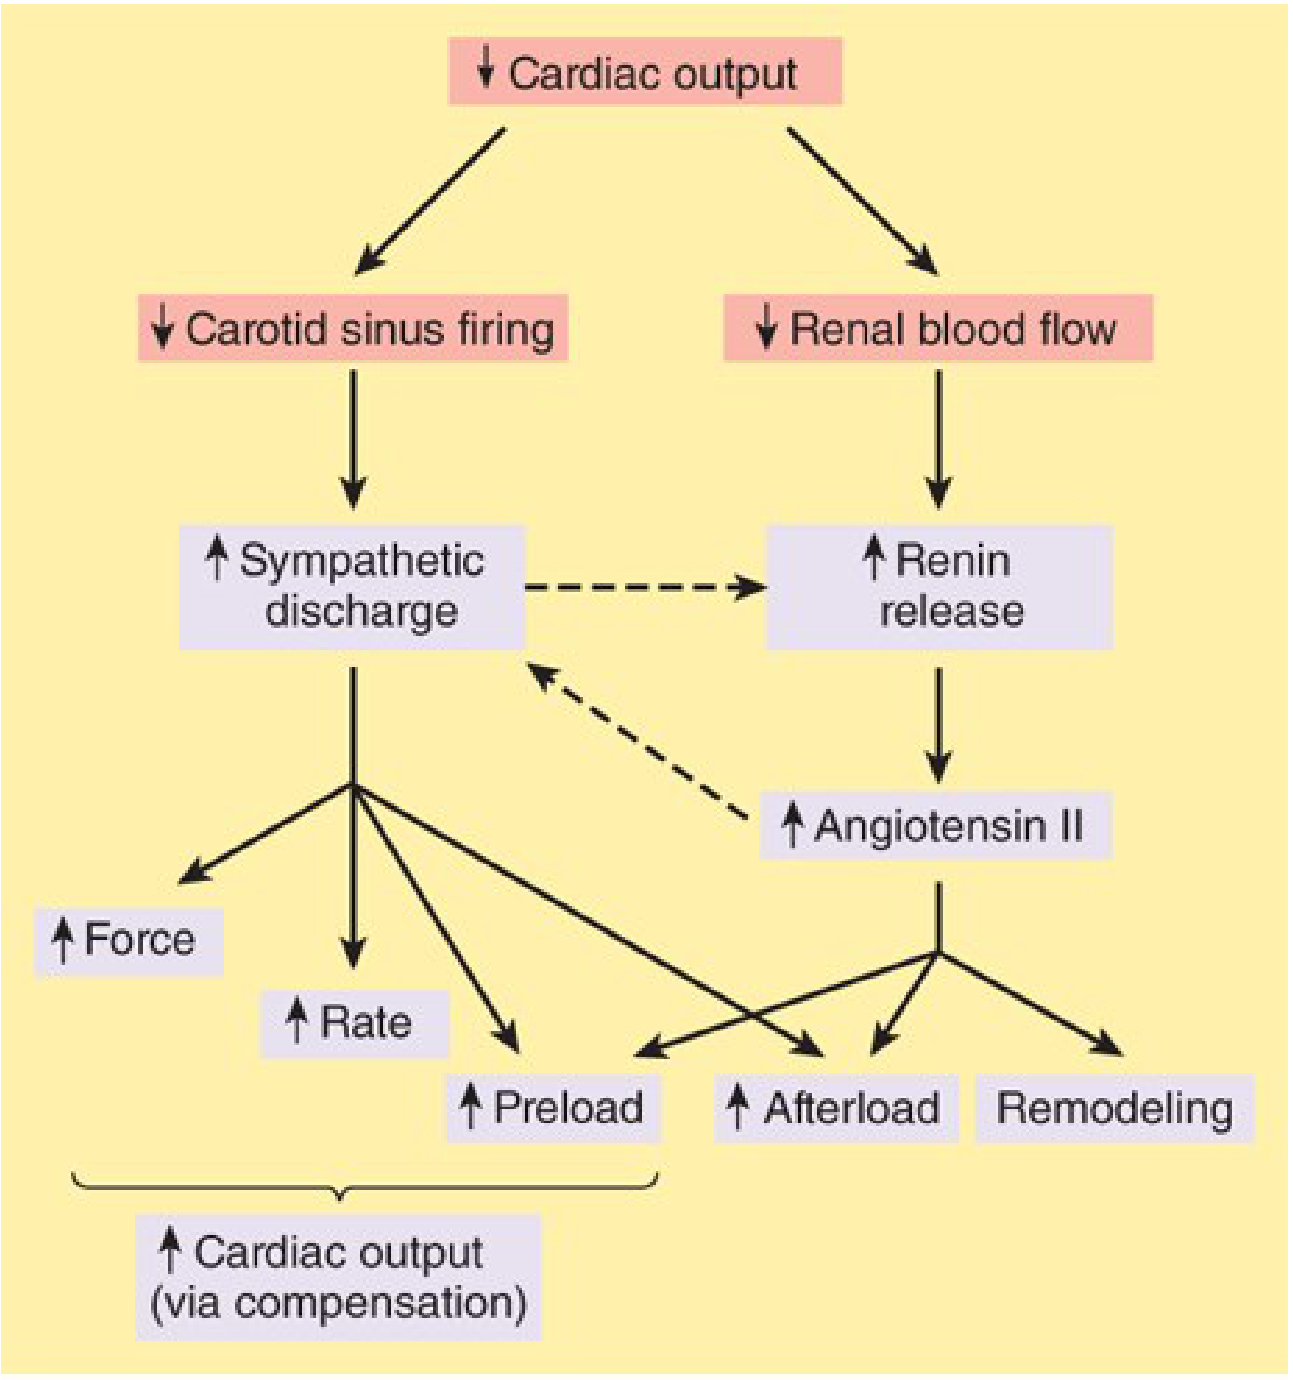
- Baroreceptor reflex reset → ↑ sympathetic outflow → tachycardia, ↑ contractility, vasoconstriction
- RAAS activation → ↓ renal perfusion → ↑ renin → ↑ angiotensin II → aldosterone → Na⁺/H₂O retention → ↑ preload and afterload
- ADH release → water retention → further volume overload
- Endothelin release from endothelium → potent vasoconstriction → ↑ afterload
- This creates a vicious cycle: ↓ CO → RAAS/SNS activation → ↑ afterload → further ↓ EF → ↓ CO
- ↑ LV end-diastolic pressure → ↑ left atrial pressure → ↑ pulmonary venous pressure → pulmonary congestion → pulmonary edema
- Extravasated RBCs are phagocytosed by alveolar macrophages → hemosiderin-laden macrophages = "heart failure cells" (pathognomonic)
- Secondary dilation of LA → risk of atrial fibrillation and mural thrombus
- Eventual → pulmonary arterial hypertension → right heart strain
CLINICAL FEATURES OF LEFT HEART FAILURE
- Dyspnea on exertion - earliest and most common symptom
- Orthopnea - dyspnea when supine; relieved by sitting (graded in number of pillows)
- Paroxysmal nocturnal dyspnea (PND) - sudden breathlessness at night; patient wakes up gasping
- Cardiac asthma - bronchospasm due to pulmonary edema
- Fatigue and weakness - reduced cardiac output → poor skeletal muscle perfusion
- Cheyne-Stokes respiration - in severe failure; oscillating hyperpnea and apnea
- Reduced exercise tolerance
- Cough (often nocturnal, dry or with pink frothy sputum in acute pulmonary edema)
- Nocturia (redistribution of peripheral edema when supine at night → ↑ renal perfusion)
- Tachycardia - compensatory
- Cardiomegaly - displaced apex beat (laterally and inferiorly)
- S3 gallop - due to rapid ventricular filling in volume-overloaded heart (low-pitched, early diastole)
- S4 gallop - due to increased myocardial stiffness (diastolic dysfunction)
- Pulsus alternans - alternating strong and weak pulses; sign of severe LV dysfunction
- Fine bilateral basal crepitations (crackles) - edematous alveoli snapping open on inspiration
- Cardiac wheeze - bronchospasm
- Cool peripheries, mottled skin (low output)
- In severe failure: central cyanosis, Cheyne-Stokes breathing, hypotension
PART 2: RIGHT HEART FAILURE (RHF)
CAUSES
- Secondary to LHF - most common cause overall (through pulmonary hypertension)
- Pulmonary arterial hypertension (PAH)
- Cor pulmonale (COPD, pulmonary fibrosis, recurrent PE)
- Tricuspid or pulmonary valve disease
- Right ventricular MI
- Atrial septal defect (ASD) with volume overload
- Cardiomyopathy
PATHOGENESIS
| Organ | Effect |
|---|---|
| Liver | Congestive hepatomegaly → "nutmeg liver" (centrilobular congestion); centrilobular necrosis in severe failure; cardiac cirrhosis in chronic failure |
| Spleen | Congestive splenomegaly with platelet sequestration |
| Kidneys | Greater fluid retention and peripheral edema than in LHF; azotemia |
| GI tract | Bowel wall edema → malabsorption of nutrients and drugs |
| Subcutaneous tissue | Pedal/pretibial pitting edema; sacral edema in bedridden patients; anasarca in severe cases |
| Pleura/Pericardium | Pleural effusions (serous, bilateral), pericardial effusions, ascites |
| CNS | Venous congestion and hypoxia → irritability, confusion, mental dysfunction |
CLINICAL FEATURES OF RIGHT HEART FAILURE
- Swelling of legs/ankles - dependent pitting edema; worse in evening
- Abdominal distension - ascites, hepatomegaly
- Right hypochondrial pain/discomfort - hepatic congestion with stretching of Glisson's capsule
- Anorexia, nausea, vomiting - bowel wall edema and mesenteric congestion
- Fatigue
- Breathlessness (if also secondary LHF component present)
- Elevated JVP (Jugular Venous Pressure) - hallmark sign; best seen with patient at 45°
- Kussmaul's sign - paradoxical rise of JVP on inspiration (in constrictive pericarditis or severe RHF)
- Hepatomegaly - tender, pulsatile liver (tricuspid regurgitation causes systolic pulsation)
- Hepatojugular reflux - compression of liver causes ↑ JVP
- Pitting edema of lower limbs - bilateral, symmetrical; sacral in bedridden patients
- Ascites
- Cyanosis - peripheral
- Parasternal heave (RV enlargement)
- Loud P2 (if pulmonary hypertension present)
- Pansystolic murmur at left sternal edge (functional tricuspid regurgitation in dilated RV)
COMPARISON: LEFT vs RIGHT HEART FAILURE
| Feature | Left Heart Failure | Right Heart Failure |
|---|---|---|
| Dyspnea, PND, orthopnea | ++++ | Only if secondary LHF |
| Peripheral edema | Absent or mild | ++++ |
| JVP elevated | Absent | ++++ |
| Basal crepitations | Present | Absent |
| Hepatomegaly | Absent/mild | Present |
| Ascites | Absent | Present |
| Pulmonary congestion | Present | Absent (primary RHF) |
| S3 gallop | Present | May be present |
| Cardiomegaly | LV predominant | RV predominant |
| Main cause | IHD, HTN | Cor pulmonale, LHF |
INVESTIGATIONS
1. Electrocardiogram (ECG)
- May show: left ventricular hypertrophy (LVH), right ventricular hypertrophy (RVH)
- Signs of underlying cause: Q waves (MI), atrial fibrillation, bundle branch block
- ST-T changes, P-mitrale (LA enlargement), P-pulmonale (RA enlargement)
- Note: A normal ECG makes heart failure unlikely
2. Chest X-Ray (CXR)
- Cardiomegaly (cardiothoracic ratio > 0.5)
- Upper lobe blood diversion/pulmonary venous hypertension (earliest sign)
- Kerley B lines - short horizontal lines at costophrenic angles (interstitial edema)
- Bat-wing/butterfly pattern of pulmonary edema (alveolar)
- Pleural effusions (often right > left)
- Perihilar haziness ("hilar haze")
- RV enlargement
- Prominent pulmonary arteries (if pulmonary HTN)
- Pleural effusions
3. Echocardiography (Most Important Investigation)
- Gold standard for diagnosis and classification
- Measures ejection fraction (EF): distinguishes HFrEF from HFpEF
- Assesses wall motion abnormalities (regional = IHD; global = cardiomyopathy)
- Valvular assessment (stenosis, regurgitation)
- Measures LV dimensions, wall thickness
- Diastolic dysfunction assessment (E/A ratio, E/e' ratio)
- RV function: TAPSE (tricuspid annular plane systolic excursion)
- Estimates pulmonary artery pressure
- Detects pericardial effusion and mural thrombus
4. Natriuretic Peptides (BNP / NT-proBNP)
- BNP is released by ventricular cardiomyocytes in response to increased wall stress
- BNP > 100 pg/mL or NT-proBNP > 300 pg/mL: supports diagnosis of HF
- A normal BNP virtually excludes significant cardiac failure (high negative predictive value)
- Used to: diagnose HF (especially in acute dyspnea), guide therapy, assess prognosis
- NT-proBNP has longer half-life; more stable than BNP
5. Blood Tests
- CBC: anemia (high-output state or contributory cause)
- Renal function (BUN, Creatinine, electrolytes): baseline; prerenal azotemia in severe failure; Na⁺ levels for prognosis
- Liver function tests: elevated transaminases, bilirubin in hepatic congestion
- Thyroid function tests: hyperthyroidism as cause; hypothyroidism as exacerbating factor
- Serum iron studies / ferritin: iron deficiency is common and treatable comorbidity
- Glucose / HbA1c: diabetes as risk factor
- Troponin: myocardial injury; elevated in acute decompensation
6. Cardiac Catheterization
- Right heart catheterization (Swan-Ganz): direct hemodynamic measurement (PCWP, PAP, CO)
- Left heart catheterization: coronary angiography to assess IHD
- Used when diagnosis uncertain or pre-transplant evaluation
7. Additional Investigations
- Cardiac MRI: gold standard for myocardial fibrosis, infiltrative diseases (amyloid, sarcoid), cardiomyopathy evaluation; accurate EF measurement
- Nuclear imaging (MUGA scan): accurate EF measurement
- Exercise stress test: functional capacity assessment, prognosis
- Holter monitor / 24-hr ECG: arrhythmia detection
- Serum albumin: nutritional status, especially in chronic RHF
MANAGEMENT
General Principles
Non-Pharmacological Management
- Salt restriction: < 2 g sodium/day to reduce fluid retention
- Fluid restriction: 1.5-2 L/day in moderate-severe failure
- Daily weight monitoring: >2 kg in 2 days = seek medical attention
- Graded aerobic exercise: improves functional capacity (in stable heart failure)
- Smoking cessation, alcohol abstinence
- Vaccination: influenza, pneumococcal
- Patient education: symptom recognition, medication adherence
Pharmacological Management
A. Diuretics - Symptom Relief
- Loop diuretics (Furosemide 20-160 mg/day): first-line for congestion; reduce preload by promoting Na⁺/water excretion
- Thiazides (metolazone): used as add-on in diuretic resistance
- Monitor: electrolytes (especially K⁺), renal function, blood pressure
B. ACE Inhibitors / ARBs - Prognostic Benefit
- ACE inhibitors (enalapril, ramipril, lisinopril): block conversion of Ang I to Ang II → ↓ afterload, ↓ aldosterone → reduce preload and afterload, prevent remodeling
- Proven to reduce mortality in HFrEF; first-line if tolerated
- ARBs (valsartan, candesartan): used if ACE inhibitor not tolerated (cough)
- ARNI (sacubitril/valsartan): superior to ACE inhibitor alone in HFrEF; inhibits neprilysin (preserves natriuretic peptides) + blocks AT1 receptor; reduces mortality and hospitalizations (PARADIGM-HF trial)
C. Beta-Blockers - Prognostic Benefit
- (Carvedilol, metoprolol succinate, bisoprolol)
- Counteract harmful effects of chronic sympathetic activation
- Reduce tachycardia, prevent arrhythmias, reduce myocardial O₂ demand, reverse remodeling
- Start at low dose and titrate up in stable patients; avoid in acute decompensation
- Reduce all-cause mortality by ~34% in HFrEF
D. Mineralocorticoid Receptor Antagonists (MRA)
- (Spironolactone, eplerenone)
- Block aldosterone → ↓ Na⁺ retention, ↓ myocardial fibrosis
- Reduce mortality and sudden cardiac death in HFrEF (RALES trial)
- Monitor K⁺ and renal function (risk of hyperkalemia)
E. SGLT2 Inhibitors - New Standard of Care
- (Dapagliflozin, empagliflozin)
- Originally diabetic drugs; shown to reduce HF hospitalization and cardiovascular death in both HFrEF and HFpEF
- Mechanism: osmotic diuresis, reduced preload/afterload, direct cardiac effects
F. Ivabradine
- Reduces heart rate by inhibiting If (funny) current in SA node
- Used in symptomatic HFrEF with HR ≥ 70 bpm despite maximum beta-blocker dose
- Reduces HF hospitalization
G. Digoxin
- Positive inotrope; also slows ventricular rate in AF
- Inhibits Na⁺/K⁺-ATPase → ↑ intracellular Ca²⁺ → ↑ contractility
- Narrow therapeutic window; monitor levels (target 0.5-0.9 ng/mL)
- Does not reduce mortality but reduces hospitalizations; used in refractory HFrEF
H. Hydralazine + Isosorbide Dinitrate
- For patients who cannot tolerate RAAS-blocking agents (e.g., renal failure, hyperkalemia)
- Particularly beneficial in self-identified Black patients (A-HeFT trial)
I. Anticoagulation
- Indicated in HF with atrial fibrillation (CHA₂DS₂-VASc score)
- May be considered in HF with severely reduced EF and LV thrombus
Device Therapy
| Device | Indication |
|---|---|
| ICD (Implantable Cardioverter-Defibrillator) | HFrEF with EF < 35%, NYHA class II-III, on optimal medical therapy for >3 months; primary prevention of sudden cardiac death |
| CRT (Cardiac Resynchronization Therapy) | HFrEF with EF < 35% + LBBB + QRS > 130 ms; biventricular pacing restores synchrony |
| CRT-D | Combined CRT + ICD |
| LVAD (Left Ventricular Assist Device) | Bridge to transplant or destination therapy in end-stage HF |
Surgical Management
- Cardiac transplantation: gold standard for end-stage refractory HF
- Coronary revascularization (CABG/PCI): when IHD is the cause with viable myocardium
- Valve surgery: for valvular heart disease causing HF
- Ventricular restoration surgery: in selected dilated cardiomyopathy cases
Management of Acute Decompensated Heart Failure (ADHF)
- Position: sitting up, legs dependent to reduce preload
- High-flow oxygen (target SpO₂ > 94%)
- Non-invasive ventilation (CPAP/BiPAP) for acute pulmonary edema
- IV furosemide (40-80 mg) - rapid diuresis
- IV morphine (controversial; reduces anxiety, preload) - use with caution
- IV nitrates (GTN infusion): vasodilation → ↓ preload and afterload - avoid if SBP < 90 mmHg
- Inotropes (dobutamine, milrinone): for cardiogenic shock (low CO, hypotension)
- Vasopressors (norepinephrine): cardiogenic shock with hypotension
- Monitor closely: urine output, SpO₂, BP, renal function, electrolytes
KEY CONCEPTS TO REMEMBER (Memory Aids)
- A - ACE inhibitor/ARB/ARNI
- B - Beta-blocker
- C - Cardioprotection with MRA (spironolactone)
- D - Diuretic (loop) + Dapagliflozin (SGLT2i)
- E - Exercise (supervised), Education, ICD/CRT (device)
PROGNOSIS
Give me the answers for mitral regurgitation and also for mitral stenosis in the similar above pattern
mitral stenosis pathophysiology diagram rheumatic valve
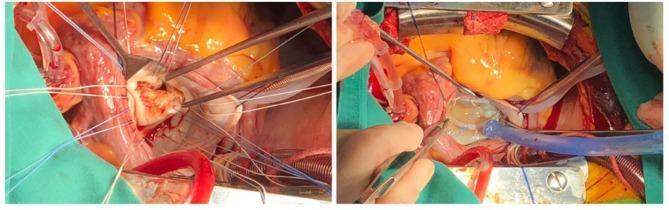
A two-panel clinical photograph illustrating a modified release technique for rheumatic mitral stenosis valvuloplasty (MVP) within an intraoperative cardiac surgical field. The left panel (pre-MVP) shows the mitral valve accessed through a trans-septal approach. The valve leaflets exhibit classic rheumatic features: significant thickening, fibrous contracture, and visible calcification, leading to a restricted orifice and compromised coaptation. The right panel (post-MVP) demonstrates the results of the surgical intervention, which includes commissurotomy and leaflet thinning. The repaired leaflets show physiological bulging and an improved coaptation area, as visualized during an intraoperative water test. An annuloplasty ring is visible, providing structural support to the valve apparatus. Surrounding both panels is a standard surgical field containing retractors, cannulas for cardiopulmonary bypass, and various stay sutures used to expose the left atrium and valve commissures. This comparison highlights the transition from a stenotic, calcified rheumatic valve to a functional, pliable configuration following surgical reconstruction.
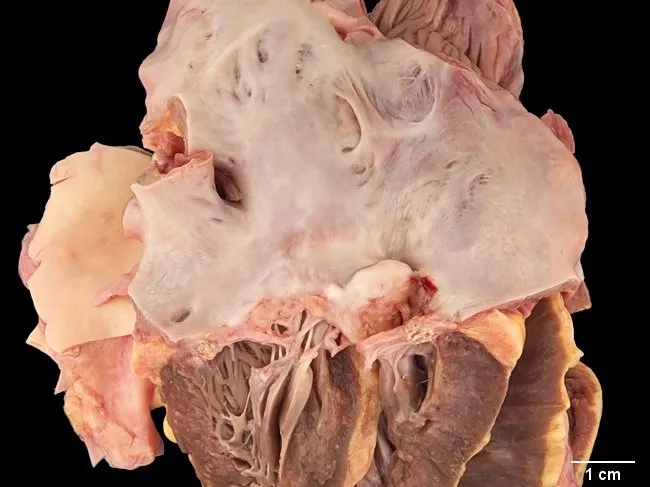
Gross pathology photograph of an excised mitral valve from a 55-year-old woman with long-standing systemic lupus erythematosus, illustrating Libman-Sacks endocarditis. The valve is stenotic with restricted leaflet mobility and marked left atrial dilation. Vascularized scar tissue is evident on the mitral leaflets near the line of closure, and the chordae tendineae are scarred and thickened. The surfaces exhibit irregular, pale to tan areas consistent with prior vegetations and repair, without visible bacterial organisms. The specimen demonstrates sterile vegetations and fibrinous thrombi embedded with immune complexes and mononuclear cells—hallmarks of nonbacterial thrombotic endocarditis in autoimmune disease. These changes produce impaired valvular function, typically mitral stenosis with or without regurgitation, and contribute to chronic left atrial enlargement. Clinically, Libman-Sacks endocarditis indicates active systemic lupus erythematosus with cardiac involvement and may increase risk of embolization and heart failure. The image supports the differential diagnosis against infectious endocarditis, rheumatic valvulitis, and marantic endocarditis, emphasizing autoimmune valvulopathy. This gross finding correlates with histopathology showing sterile vegetations; echocardiography often complements diagnosis in vivo. The case underscores the importance of multidisciplinary management combining immunosuppression and, when needed, valvular intervention. This image is suitable for educational, surgical planning, and pathophysiology research contexts and supports standardized reporting and citation.
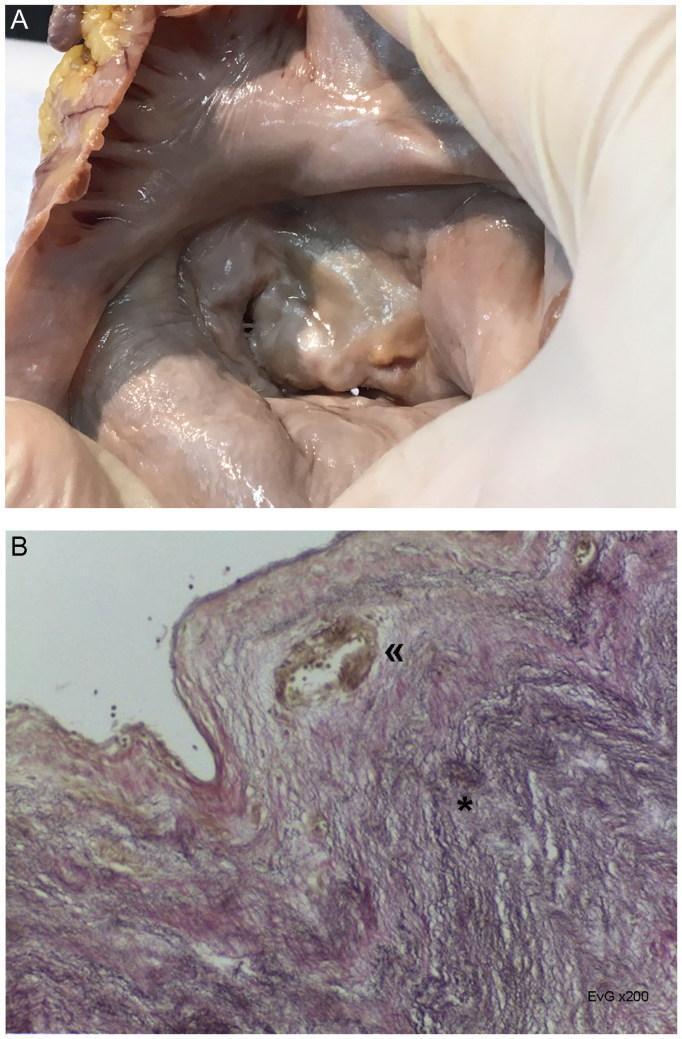
This composite educational material demonstrates macroscopic and microscopic features of Rheumatic (post-inflammatory) Valvulopathy. Image A is a clinical photograph of a human mitral valve specimen from an autopsy, viewed from the atrial aspect. It illustrates significant valvular stenosis characterized by thickening of the leaflets and fusion of the commissures, resulting in the classic 'fish mouth' or 'smiling face' slit-like deformity. Image B is a histopathological micrograph of the valve leaflet at x200 magnification, stained with Elastic van Gieson (EvG). The microscopic section reveals extensive fibroelastosis, indicated by the dense network of elastic and collagen fibers (marked by an asterisk), and the presence of neovascularization featuring thick-walled vessels at the distal part of the leaflet (marked by double chevrons). These findings are diagnostic markers for chronic rheumatic heart disease, demonstrating the structural remodeling that leads to valvular dysfunction and heart failure.
mitral regurgitation acute chronic pathophysiology hemodynamic diagram
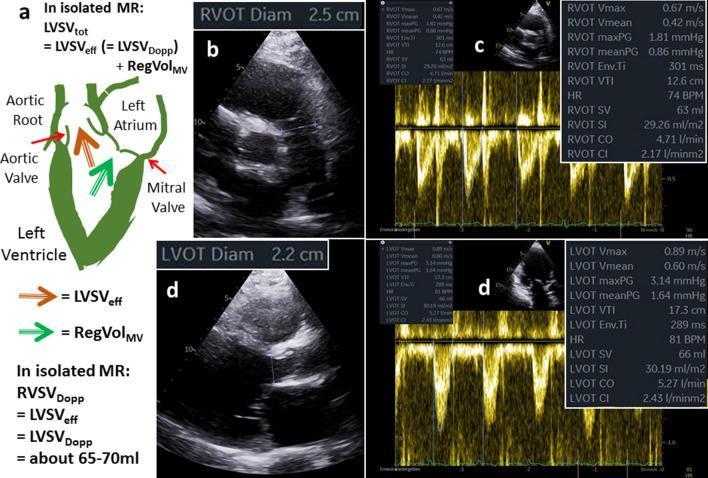
This composite educational graphic illustrates the quantitative assessment of left ventricular (LV) volumes in functional mitral regurgitation (FMR) using echocardiography. Panel (a) features a pathophysiology diagram of the heart during systole, demonstrating that total left ventricular stroke volume (LVSVtot) is the sum of effective stroke volume (LVSVeff, forward flow to the aortic root) and regurgitant volume (RegVolMV, backward flow into the left atrium). Panels (b) and (c) display diagnostic ultrasound images and Pulsed-Wave (PW) Doppler spectra for the Right Ventricular Outflow Tract (RVOT). It shows an RVOT diameter of 2.5 cm and a Velocity Time Integral (VTI) of 12.6 cm, calculating an RVSV of 63 ml. Panels (d) show the corresponding Left Ventricular Outflow Tract (LVOT) measurements, including an LVOT diameter of 2.2 cm and an LVOT VTI of 17.3 cm, resulting in an LVOT SV (LVSVeff) of 66 ml. The image highlights that in isolated FMR, the right ventricular stroke volume (RVSVDopp) can serve as a proxy for the effective forward stroke volume (LVSVeff). This visual is intended for cardiology learners to understand hemodynamic calculations and the continuity equation in valvular heart disease.
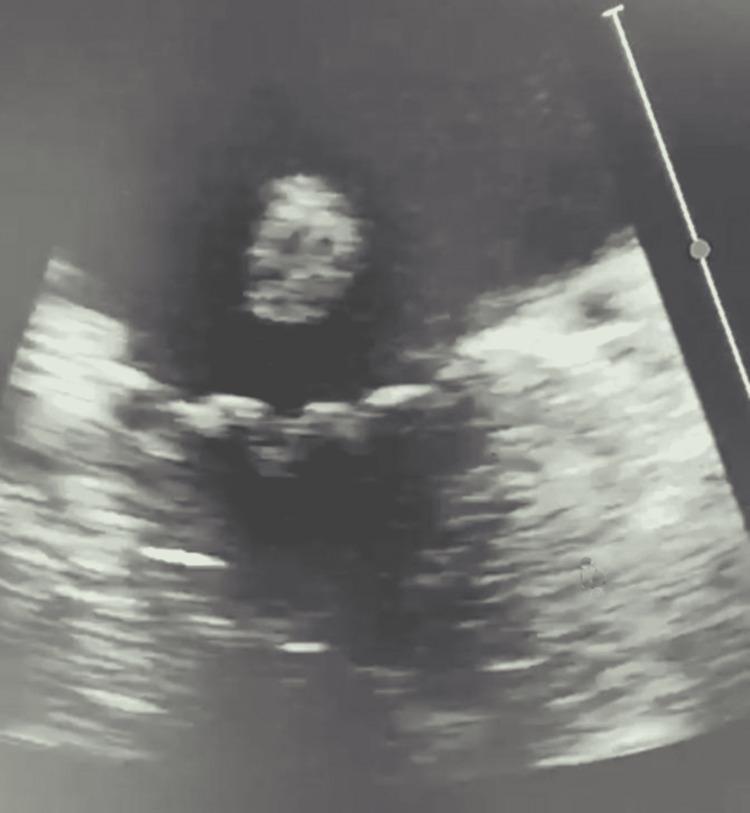
This diagnostic ultrasound image is a gray-scale transesophageal echocardiogram (TOE) capturing a mid-esophageal view of the mitral valve apparatus. The image demonstrates a flail anterior mitral valve leaflet, characterized by a lack of systolic coaptation and an irregular, detached appearance of the leaflet tip extending into the left atrium. The visual findings are consistent with acute mitral regurgitation resulting from structural failure of the subvalvular apparatus, such as chordae tendineae rupture or papillary muscle dysfunction. This clinical photograph serves as a critical educational tool for identifying primary valvular pathology and understanding the pathophysiology of severe, eccentric mitral regurgitation in the context of acute hemodynamic instability. The imaging highlights the importance of TOE in assessing cardiac valve morphology and ruling out conditions like infective endocarditis in patients with acute pulmonary edema.
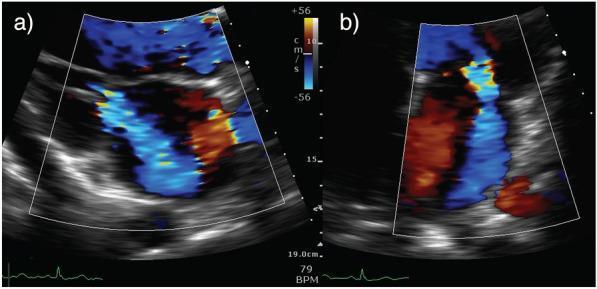
Transthoracic echocardiographic images with color Doppler demonstrating acute on chronic mitral regurgitation (MR). Figure A shows a parasternal long-axis (PLAX) view during systole, highlighting a large, posteriorly directed regurgitant jet originating at the coaptation point of the mitral valve and extending into the left atrium. Figure B displays an apical four-chamber (A4C) view of the same jet. The color Doppler signal is characterized by a mosaic pattern of blue, red, and yellow, indicating high-velocity turbulent flow and significant aliasing. The jet is eccentric, suggesting a specific valvular mechanism such as ischemic tethering of the posterior mitral valve leaflet (PMVL). In both views, the regurgitant volume occupies a significant portion of the left atrial area, supporting the diagnosis of severe mitral regurgitation. The Doppler scale is set at +/- 56 cm/s, and a simultaneous ECG strip at the bottom indicates a heart rate of 79 BPM. This visual is used to teach the identification of jet direction, turbulence, and spatial orientation in secondary mitral valve disease.
MITRAL STENOSIS (MS)
LAQ Answer - MBBS Prof Exam Standard
DEFINITION
- Normal mitral valve area: 4.0-5.0 cm²
- Mild MS: MVA 1.5-4.0 cm²
- Moderate MS: MVA 1.0-1.5 cm²
- Severe MS: MVA < 1.0 cm²
ETIOLOGY
- Rheumatic heart disease (>90% of cases globally, especially in developing countries like India)
- Congenital (parachute mitral valve, cor triatriatum)
- Severe mitral annular calcification with leaflet involvement
- Systemic lupus erythematosus (Libman-Sacks endocarditis)
- Rheumatoid arthritis
- Carcinoid syndrome
- Infective endocarditis with large vegetations
- Radiation-induced valvulitis
PATHOLOGY
- Commissural fusion - the two mitral leaflets fuse at their edges
- Leaflet thickening and fibrosis - leaflets become rigid and immobile
- Subvalvular thickening - chordae tendineae shorten, thicken, and fuse
- Calcification - calcium deposits stiffen the valve further
- Result: the valve takes on a "fish mouth" or "button-hole" appearance (classic gross pathology)
PATHOPHYSIOLOGY
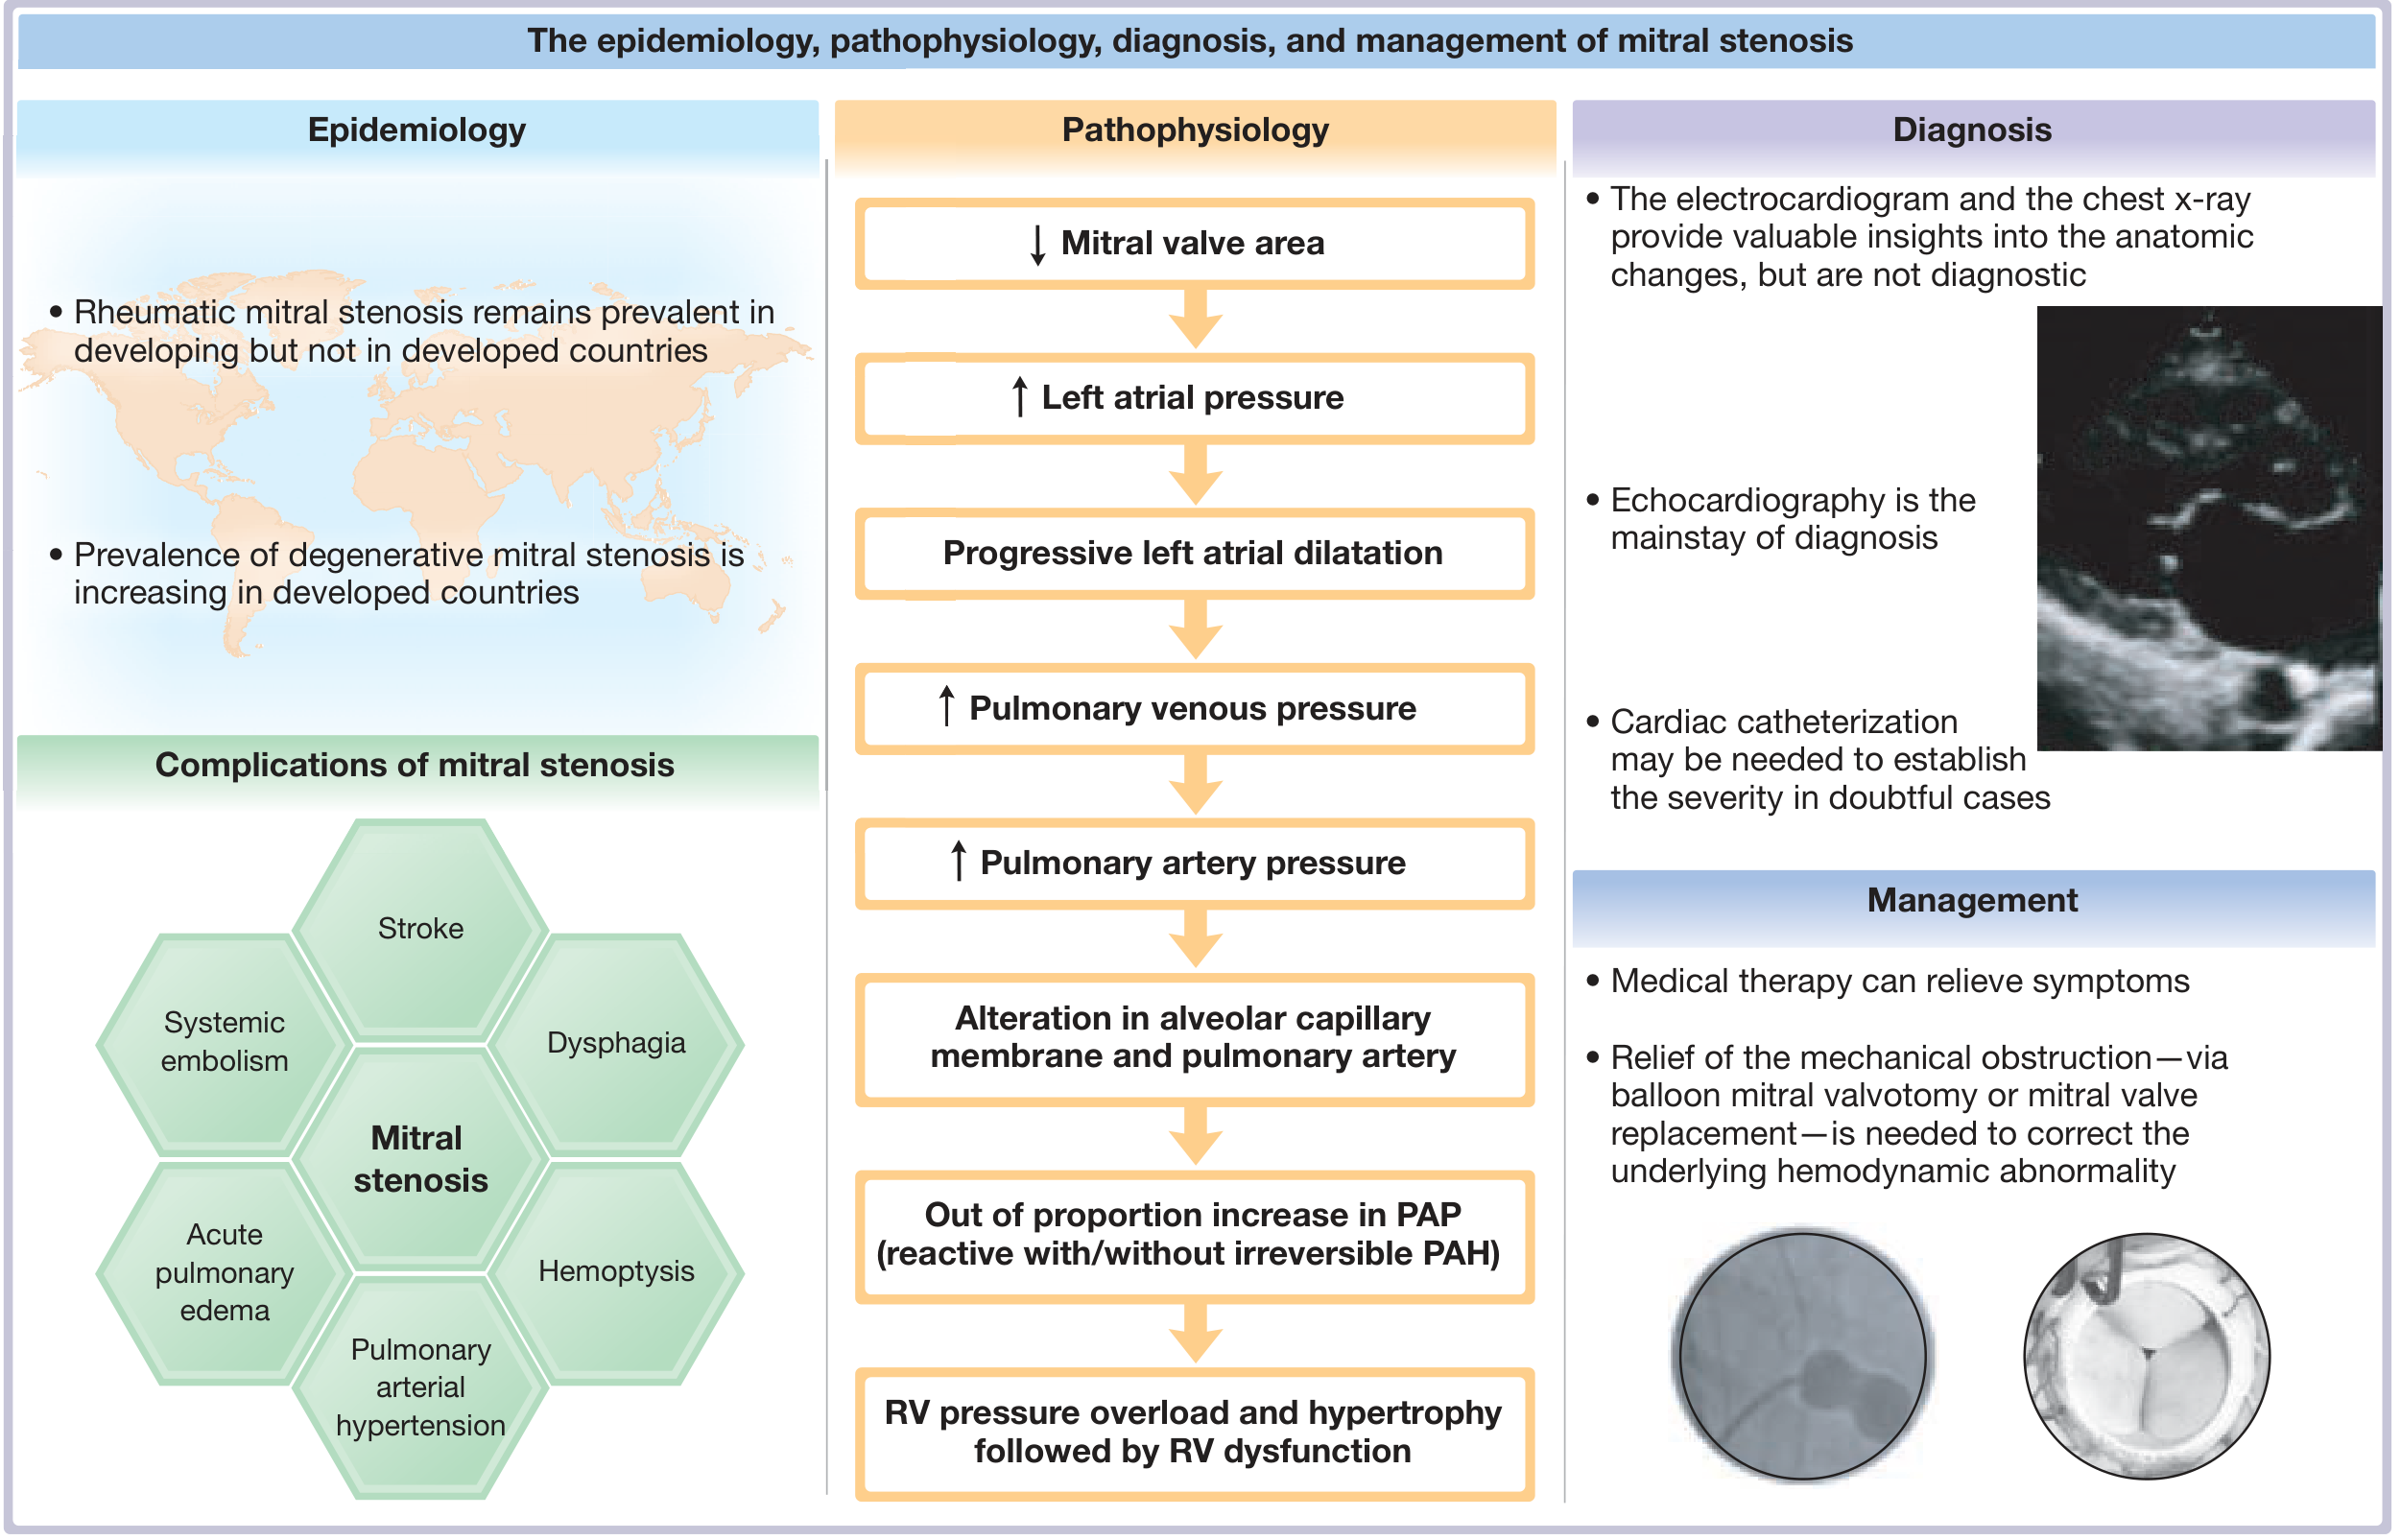
- Normal LA pressure = ~5 mmHg
- In severe MS, LA pressure can rise to 20-25 mmHg
- Creates a transmitral pressure gradient (LA pressure - LV pressure)
- Tachycardia worsens matters: ↑ HR shortens diastole disproportionately → less filling time → LA pressure rises further (important for exams!)
- Chronic LA pressure elevation → progressive LA dilation
- Atrial fibrillation develops (commonest complication) in ~40-50% of patients
- AF further worsens hemodynamics (↑ HR, loss of atrial kick)
- LA stasis + AF → left atrial thrombus (especially in LA appendage) → systemic embolism (stroke)
- ↑ LA pressure → ↑ pulmonary venous pressure → pulmonary congestion → dyspnea
- Passive backward transmission of ↑ LA pressure
- Pulmonary arteriolar constriction ("second stenosis") - reactive pulmonary HTN
- Interstitial edema in walls of small pulmonary vessels
- End-stage: organic obliterative changes in pulmonary vasculature
- ↑ PAP → RV pressure overload → RV hypertrophy → RV failure
- Secondary tricuspid regurgitation (functional, due to RV dilation)
- Graham-Steell murmur (pulmonary regurgitation from pulmonary HTN)
- LV gets less filling → small LV, normal EF, normal or low CO
- This distinguishes MS from MR/AR where LV is volume overloaded
| Stage | Description | MVA | Mean Gradient | PA Systolic Pressure |
|---|---|---|---|---|
| A | At risk | Normal | Normal | Normal |
| B | Progressive | > 1.5 cm² | < 5 mmHg | < 30 mmHg |
| C | Severe asymptomatic | ≤ 1.5 cm² | ≥ 5 mmHg | > 30 mmHg |
| D | Severe symptomatic | ≤ 1.5 cm² | ≥ 5 mmHg | > 30 mmHg |
CLINICAL FEATURES
Symptoms
- Dyspnea on exertion - earliest and most common; initially only on heavy exertion
- Orthopnea and PND - as disease progresses
- Palpitations - due to atrial fibrillation
- Hemoptysis - due to:
- Pulmonary apoplexy (rupture of thin-walled, engorged bronchopulmonary veins)
- Blood-stained sputum (pulmonary edema)
- Pink frothy sputum (acute pulmonary edema)
- Recurrent bronchitis
- Systemic embolism - TIA, stroke, limb ischemia (10-20% incidence; more common with AF)
- Hoarseness (Ortner's syndrome) - enlarged LA compresses left recurrent laryngeal nerve
- Dysphagia - enlarged LA compresses esophagus
- Features of RHF in advanced disease (edema, ascites, hepatomegaly)
Signs
- Malar flush (mitral facies) - rosy-red cheeks with cyanotic hue; due to reduced CO and peripheral vasoconstriction
- Signs of right heart failure in advanced disease
- Tapping apex beat - palpable S1 (loud, tapping quality); displaced if RV enlargement
- Parasternal heave - RV enlargement
- Diastolic thrill at apex (patient in left lateral position) - rare
- Loud (accentuated) S1 - due to increased closing force of the stiff leaflets that are held wide open by elevated LA pressure
- Loud P2 (accentuated pulmonic component of S2) - due to pulmonary hypertension; closely split S2
- Opening Snap (OS) - high-pitched sound after S2; caused by sudden tensing of stenosed mitral valve leaflets as they open; heard best at apex and medial to it
- A2-OS interval: inversely proportional to severity (shorter interval = more severe MS = higher LA pressure)
- A2-OS = 0.05-0.12 seconds
- Mid-diastolic rumbling murmur (MDM) - low-pitched, rumbling, heard at apex with patient in left lateral decubitus position; best heard with bell of stethoscope; accentuated by mild exercise; duration correlates with severity
- Presystolic accentuation - louder murmur just before S1 in patients in sinus rhythm (due to atrial systole accelerating flow)
- Lost when AF supervenes (no atrial contraction)
- Graham Steell murmur - early diastolic decrescendo murmur at left sternal edge; due to pulmonary regurgitation secondary to PAH
- Carey Coombs murmur - mid-diastolic murmur in active rheumatic carditis (from mitral valvulitis, not stenosis)
S1 (loud) → OS → MDM (rumble) → Presystolic accentuation → S1
COMPLICATIONS
- Atrial fibrillation (most common complication, ~40-50%)
- Systemic embolism and stroke
- Pulmonary arterial hypertension
- Acute pulmonary edema
- Hemoptysis
- Infective endocarditis
- Right heart failure
- Tricuspid regurgitation (functional)
INVESTIGATIONS
1. ECG
- P-mitrale: broad (>0.12 sec), bifid, notched P wave in lead II (LA enlargement in sinus rhythm)
- P-mitrale in V1: biphasic P wave with a prominent negative terminal deflection
- RVH: right axis deviation, dominant R in V1, S in V6
- Atrial fibrillation: irregular rhythm (common finding)
2. Chest X-Ray
- Double contour (double density) sign - enlarged LA creates a shadow behind the right heart border
- Straight or bulging left heart border (LA appendage enlargement)
- Splaying of carina (angle > 70°) - LA enlarges to push up the left main bronchus
- Enlarged pulmonary artery knuckle (if PAH)
- RV enlargement - filling of retrosternal space on lateral view
- Upper lobe blood diversion - vessels in upper lobes become larger than lower lobe vessels (earliest sign of pulmonary venous HTN)
- Kerley B lines - short (1-2 cm) horizontal lines at costophrenic angles = interstitial edema in interlobular septa
- Kerley A lines - longer lines from hilum toward periphery
- Pulmonary edema - butterfly/bat-wing pattern (severe)
- Pleural effusions
3. Echocardiography (Gold Standard)
- Hockey stick deformity (doming) of anterior mitral leaflet - restricted leaflet mobility with leaflet tip tethering
- Increased leaflet echogenicity - calcification and thickening
- Commissural fusion
- LA enlargement
- LA thrombus (esp. in LA appendage - better seen on TEE)
- Wilkins score (0-16): assesses suitability for PMBC:
- Leaflet mobility (0-4)
- Leaflet thickening (0-4)
- Subvalvular thickening (0-4)
- Calcification (0-4)
- Score ≤ 8 = favorable for PMBC
- Elevated transmitral pressure gradient
- Prolonged pressure half-time (PHT > 150 ms in severe MS)
- Mitral valve area by PHT: MVA = 220 / PHT
- RV systolic pressure estimation (PASP) via TR jet
- LV size and EF (should be normal in isolated MS)
- Exclude LA thrombus before PMBC or cardioversion
- Better visualization of valve anatomy
4. Cardiac Catheterization
- Right heart catheterization: measures LA (via PCWP) and LV pressures; calculates transmitral gradient and MVA (Gorlin formula)
- Coronary angiography: pre-operative in patients > 40 years or with angina
- Indicated when echo findings are inconclusive or discordant with clinical findings
5. Blood Tests
- CBC, ESR, CRP (rheumatic activity)
- ASO titer (recent streptococcal infection)
- INR (if on anticoagulation)
- Renal and liver function
MANAGEMENT
Medical Management
- Avoid strenuous exertion (precipitates pulmonary edema)
- Treat anemia, fever, pregnancy-related tachycardia aggressively
- Reduce pulmonary congestion and dyspnea
- Furosemide (loop diuretic) ± spironolactone
- Use cautiously - may reduce CO if preload too low
- Beta-blockers (metoprolol, atenolol): first choice for rate control in sinus rhythm and AF
- Rate-limiting calcium channel blockers (verapamil, diltiazem): alternative
- Digoxin: rate control in AF (less effective during exercise)
- Goal: resting HR 60-70 bpm, exercise HR ≤ 110 bpm
- Rationale: slowing heart rate prolongs diastole → more time for LA to empty → ↓ transmitral gradient
- Warfarin (target INR 2.0-3.0) - MANDATORY for:
- Rheumatic MS with AF (paroxysmal, persistent, or permanent)
- Prior systemic embolism
- LA thrombus
- Note: Direct oral anticoagulants (DOACs) are NOT approved for rheumatic MS - warfarin only
- For MS in sinus rhythm without LA thrombus: no routine anticoagulation, but consider if high risk
- Electrical/pharmacological cardioversion for recent-onset AF (< 1 year, LA not massively dilated)
- TEE to exclude LA thrombus before cardioversion
- Cardioversion rarely maintained in severe MS or longstanding AF
- Benzathine penicillin G 1.2 million units IM monthly
- Continue until age 25-40 or 10 years after last attack (whichever is longer)
- Prevents recurrent rheumatic fever and further valve damage
- No longer routinely recommended for dental procedures in MS without prior IE
- Use if history of prior IE
Interventional / Surgical Management
- Symptomatic severe MS (MVA ≤ 1.5 cm², NYHA class II-IV)
- Asymptomatic severe MS with PAP > 50 mmHg, new-onset AF, or hemoptysis
- Procedure of choice for suitable patients
- Inoue balloon technique: balloon catheter passed via transseptal puncture into LA, across mitral valve, inflated to split fused commissures
- Ideal candidates: Wilkins score ≤ 8, pliable leaflets, minimal calcification, no significant MR (≤ 2+), no LA thrombus
- Results: excellent; MVA doubles, gradient halves acutely
- Event-free survival 80-90% over 3-7 years in favorable anatomy
- Complications: acute MR, tamponade, stroke (< 1%), residual ASD
- Closed or open commissurotomy (open preferred)
- Indicated when PMBC is not feasible or fails
- Allows direct visualization and subvalvular apparatus repair
- Indicated when valve is unsuitable for repair/commissurotomy (heavily calcified, significant subvalvular disease, coexistent MR)
- Mechanical prosthesis: long durability; requires lifelong warfarin anticoagulation
- Bioprosthesis: no anticoagulation needed (after 3 months) but less durable; preferred in elderly or women who wish to conceive
KEY EXAMINATION POINTS - MS
| Feature | Value |
|---|---|
| Classic murmur | Low-pitched mid-diastolic rumble at apex |
| Position to hear | Left lateral decubitus |
| S1 | Loud (accentuated) |
| Extra sound | Opening snap (after A2) |
| A2-OS interval | Short = severe (high LA pressure) |
| Presystolic accentuation | Present in sinus rhythm, ABSENT in AF |
| CXR finding | Double density sign, Kerley B lines, upper lobe diversion |
| Echo measurement | PHT; MVA = 220/PHT |
| Best intervention | PMBC if Wilkins ≤ 8 |
| AF anticoagulant | Warfarin (NOT DOACs) |
MITRAL REGURGITATION (MR)
LAQ Answer - MBBS Prof Exam Standard
DEFINITION
ETIOLOGY
- Mitral valve prolapse (MVP) / Myxomatous degeneration - most common cause in developed countries
- Rheumatic heart disease - most common cause in developing countries
- Infective endocarditis (acute or healed)
- Papillary muscle rupture (post-MI - medical emergency)
- Chordal rupture (spontaneous, MVP, IE, trauma)
- Congenital (cleft anterior leaflet, AV canal defect)
- Radiation-induced
- Ischemic cardiomyopathy (papillary muscle displacement, LV dilation)
- Dilated cardiomyopathy (annular dilation)
- Hypertrophic obstructive cardiomyopathy (SAM of anterior leaflet)
- Atrial fibrillation with LA/annular dilation (atrial functional MR)
PATHOPHYSIOLOGY
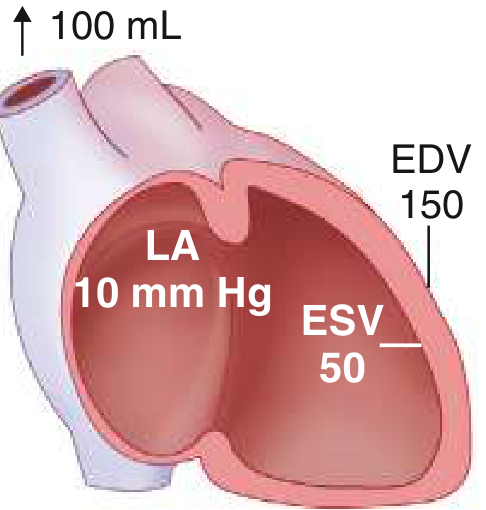
ACUTE MITRAL REGURGITATION (e.g., papillary muscle rupture, chordal rupture)
- Sudden, severe MR → LV ejects blood both forward (into aorta) and backward (into LA)
- The LA and LV have NOT had time to dilate (small, non-compliant chambers)
- ↑ regurgitant volume into a small, stiff LA → marked ↑ LA pressure → acute pulmonary edema
- ↓ effective forward cardiac output → hypotension, cardiogenic shock
- Despite low cardiac output, EF appears normal or high (LV ejects into low-resistance LA)
- LA pressure very high (large v-waves on PCWP)
- Pulmonary edema is severe and rapid
- LV size normal (no time to dilate)
- High EF (deceptive - due to low afterload)
- Represents a life-threatening emergency requiring urgent surgery
CHRONIC COMPENSATED MR
- Over months to years, the LV and LA gradually adapt:
- Eccentric LV hypertrophy (new sarcomeres in series) → LV dilates → ↑ EDV → accommodates regurgitant volume + maintains forward output
- LA enlarges progressively → accommodates regurgitant volume at lower pressure (increased LA compliance)
- EF remains supranormal (elevated; appears >60%) because LV ejects into low-resistance LA
CHRONIC DECOMPENSATED MR
- Eventually, chronic volume overload causes irreversible LV myocardial damage → ↓ contractility
- LV EF falls (though may still appear "normal" at 50-60% while actually reflecting dysfunction)
- ↑ LV end-systolic volume (ESV) → marker of decompensation
- LA pressure rises → pulmonary venous hypertension → dyspnea
- LA enlargement → atrial fibrillation (common complication)
- Continued LA dilation → pulls posterior leaflet away from the orifice → worsens MR → vicious cycle
| Parameter | Normal | Acute MR | Chronic Compensated | Chronic Decompensated |
|---|---|---|---|---|
| LA size | Normal | Normal | Enlarged | Markedly enlarged |
| LV size | Normal | Normal | Dilated | Dilated |
| LV EF | ~67% | ↑ (~82%) | ↑ (~79%) | ↓ (< 60%) |
| LA pressure | Normal | Very high | Near normal | High |
| Symptoms | - | Severe | None/mild | Dyspnea/HF |
CLINICAL FEATURES
Symptoms
- Sudden-onset severe dyspnea (acute pulmonary edema)
- Frothy pink sputum
- Cardiogenic shock (hypotension, cold peripheries, oliguria)
- History of recent MI (papillary muscle rupture), IE, or chest trauma
- Asymptomatic for years in compensated phase
- Exertional dyspnea - first symptom as disease decompensates
- Orthopnea, PND
- Palpitations (AF)
- Fatigue, reduced exercise tolerance (reduced cardiac output)
- Symptoms of right heart failure in advanced disease (edema, ascites)
Signs
- Signs of heart failure in advanced/decompensated MR
- Apex beat displaced laterally and inferiorly - due to LV dilation (this is the most important distinguishing sign from MS, where apex is not displaced)
- Apex beat is hyperdynamic, forceful, diffuse (volume overloaded LV)
- Parasternal heave - systolic impulse due to LA expanding posteriorly and pushing RV forward during systole
- Systolic thrill at apex (in severe MR)
- S1 is soft (diminished) - mitral leaflets fail to close properly; contrast with loud S1 in MS
- Pansystolic (holosystolic) murmur at the apex - hallmark of MR
- Starts with S1 and continues up to S2 (throughout all of systole)
- Loud, blowing, high-pitched
- Radiates to the left axilla (and sometimes to the left scapula)
- Heard best with diaphragm, patient in left lateral position
- Accentuated by expiration, isometric handgrip (↑ systemic vascular resistance → ↑ LV-LA gradient)
- Reduced by Valsalva maneuver, standing (↓ preload → ↓ MR)
- Soft S2 - leaflet not closing well
- S3 gallop - due to rapid ventricular filling (large regurgitant volume rushing back in early diastole); indicates volume overload; NOT necessarily heart failure in MR
- Short mid-diastolic flow murmur (after S3) - due to increased flow across mitral valve from return of regurgitant volume; does NOT mean coexistent MS
| Grade | Jet Area | Vena Contracta |
|---|---|---|
| Mild | < 4 cm² or < 20% of LA | < 0.3 cm |
| Moderate | Intermediate | 0.3-0.69 cm |
| Severe | > 40% of LA or wall-hugging jet | ≥ 0.7 cm |
COMPLICATIONS
- Atrial fibrillation (most common complication)
- Heart failure (left and eventually biventricular)
- Infective endocarditis
- Systemic embolism (less common than in MS)
- Pulmonary arterial hypertension (chronic severe MR)
- LV dysfunction (irreversible if untreated)
- Sudden cardiac death
INVESTIGATIONS
1. ECG
- P-mitrale: broad bifid P waves (LA enlargement) - in sinus rhythm
- LVH: tall R in V5/V6, deep S in V1/V2; broad, notched QRS
- Atrial fibrillation - irregular rhythm (common)
- Non-specific ST-T changes
- Signs of underlying cause (e.g., Q waves of prior MI causing secondary MR)
2. Chest X-Ray
- LV enlargement: displaced apex, boot-shaped heart (cardiomegaly)
- LA enlargement: double density sign, straight/bulging left heart border, splayed carina
- Signs of pulmonary congestion: upper lobe diversion, Kerley B lines, pulmonary edema
- Calcification of mitral annulus if degenerative MR
- In acute severe MR: pulmonary edema with relatively normal cardiac size (no time to dilate)
3. Echocardiography (Investigation of Choice)
- LV dilation - increased EDV and ESD
- Hyperdynamic LV function (increased wall motion, ↑ EF in compensated phase)
- LA enlargement
- Flail leaflet (ruptured chordae or papillary muscle)
- Prolapsing leaflet (MVP)
- Vegetations (IE)
- Wall motion abnormalities (ischemic MR)
- Regurgitant jet area
- Vena contracta width
- Proximal isovelocity surface area (PISA / EROA measurement)
- EF < 60% = already decompensated → urgent surgery
- LVESD > 40 mm (4 cm) = LV enlargement threshold for surgery
- PASP > 50 mmHg at rest = another indication for surgery
- Better detail of leaflet anatomy, subvalvular apparatus
- Essential pre-operatively to plan repair vs. replacement
- Excludes LA thrombus
4. Cardiac Catheterization
- Left ventriculography: quantify regurgitant fraction (angiographic grading 1+ to 4+)
- Coronary angiography (pre-operative, to assess co-existing CAD)
- Right heart cath: PAP, CO measurement in complex cases
5. Cardiac MRI
- Most accurate measurement of regurgitant volume and LV volumes
- Used when echo is non-diagnostic
6. Blood Tests
- CBC, CRP, ESR (active rheumatic fever, IE)
- Blood cultures (if IE suspected - three sets before antibiotics)
- BNP/NT-proBNP (elevated in decompensated MR/heart failure)
- Renal and liver function
MANAGEMENT
Medical Management
- IV sodium nitroprusside (vasodilator) - ↓ afterload → ↑ forward flow, ↓ regurgitant volume
- IV furosemide - reduce pulmonary edema
- Intra-aortic balloon pump (IABP) - reduces afterload, increases diastolic coronary perfusion; bridges to surgery
- Inotropes (dobutamine) if cardiogenic shock
- Urgent surgery - definitive treatment; mortality very high without surgery in papillary muscle rupture
- Vasodilators (ACE inhibitors, ARBs): no proven mortality benefit in isolated chronic primary MR with normal LV function and normal blood pressure; however, used if systemic hypertension is also present
- Diuretics: symptomatic relief of congestion
- Beta-blockers: for rate control in AF
- Anticoagulation (warfarin or DOACs): mandatory if AF present; guided by CHA₂DS₂-VASc score
- GDMT of heart failure (ACE/ARB/ARNI, beta-blockers, MRA, SGLT2i): beneficial for secondary MR (functional MR due to cardiomyopathy)
Surgical / Interventional Management
| Indication | Class |
|---|---|
| Symptomatic severe MR (NYHA II-IV) with EF > 30% | Class I |
| Asymptomatic severe MR with EF 30-60% OR LVESD ≥ 40 mm | Class I |
| Asymptomatic severe MR with new-onset AF | Class IIa |
| Asymptomatic severe MR with PASP > 50 mmHg | Class IIa |
| Asymptomatic severe MR, EF > 60%, LVESD < 40 mm, high repair likelihood | Class IIb |
- Gold standard surgical procedure when feasible
- Advantages over replacement: preserves native valve and subvalvular apparatus, better LV function post-op, no need for long-term anticoagulation (usually), lower operative mortality, better long-term survival
- Techniques: leaflet resection (posterior leaflet prolapse), chordal repair/transfer, Gore-Tex neochordae, annuloplasty ring
- Best results in degenerative/myxomatous MR; repair rate > 95% in experienced centres
- When repair is not feasible (heavily calcified valve, extensive disease, rheumatic MR with severe leaflet involvement)
- Preserve chordal apparatus when possible (better post-op LV function)
- Mechanical prosthesis: durable; requires lifelong warfarin (INR 2.5-3.5 for mitral position)
- Bioprosthesis: no anticoagulation after 3 months; less durable (10-15 years); preferred in elderly, those with bleeding risk, or women desiring pregnancy
- Percutaneous clip placed across mitral valve to create a double orifice
- Indicated for: high/prohibitive surgical risk patients with primary MR and appropriate anatomy
- For secondary MR in heart failure (COAPT trial): reduces HF hospitalization and mortality in selected patients with secondary MR
COMPARISON: MITRAL STENOSIS vs MITRAL REGURGITATION
| Feature | Mitral Stenosis | Mitral Regurgitation |
|---|---|---|
| Most common cause | Rheumatic (developing world) | MVP/myxomatous (developed), Rheumatic (developing) |
| Valve pathology | Narrowed orifice (obstruction) | Incompetent valve (regurgitation) |
| Hemodynamic effect | LA pressure overload | LV volume overload |
| LV size | Small/normal | Dilated |
| LV EF | Normal | Supranormal → ↓ in decompensation |
| S1 | Loud | Soft/absent |
| Extra sound | Opening snap | S3 gallop |
| Murmur | Mid-diastolic rumble at apex | Pansystolic blowing murmur at apex |
| Murmur radiation | None (apex) | Left axilla |
| Presystolic accentuation | Present (SR), lost in AF | Not applicable |
| A2-OS interval | Shortened in severity | No OS |
| Apex beat | Non-displaced, tapping | Displaced, hyperdynamic |
| AF effect | Loss of presystolic accentuation; ↑ gradient | Rate control important |
| CXR | Double density, Kerley B | LV + LA enlargement |
| Key echo measure | MVA, PHT | EF, LVESD, EROA |
| Surgery | PMBC (if suitable) or MVR | Repair preferred over replacement |
| Anticoagulant in AF | Warfarin ONLY (not DOACs) | Warfarin or DOACs (if no rheumatic MS) |
KEY MEMORY POINTS
- Tight leaflets → Loud S1 (forced open against resistance), Opening Snap
- Blocked inflow → Small LV, Large LA
- Leaky valve → Soft S1 (leaflets don't close)
- Volume overload LV → Displaced apex, S3, Pansystolic murmur
- EF drops below 60% → Operate
- LVESD reaches 40 mm → Operate