

im a medical student. answer this question for me and help me understand in simple way
heart anatomy cross section showing chambers valves
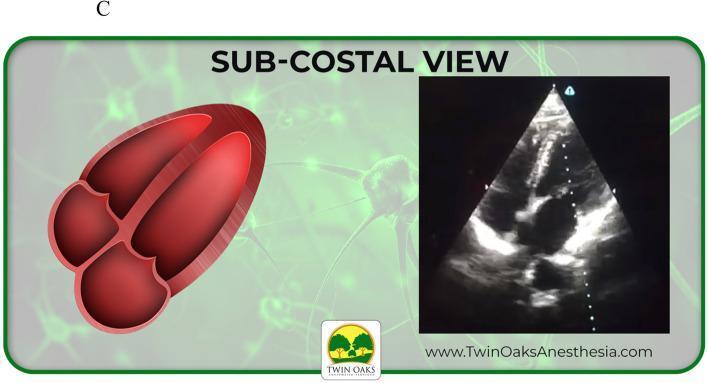
This educational graphic provides a side-by-side comparison of cardiac anatomy and sonographic representation in a subcostal transthoracic echocardiogram (TTE) view. On the left, an anatomical diagram illustrates a four-chamber view of the heart in cross-section, showing the left and right ventricles separated by the interventricular septum, along with the corresponding atria and atrioventricular valves. On the right, a corresponding grayscale echocardiogram (sonogram) in a sector scan format displays the heart from the subcostal acoustic window. The image highlights clinical landmarks including the hyperechoic (bright) ventricular walls and valves against the anechoic (dark) blood-filled chambers. This comparison is intended for medical trainees to correlate simplified anatomical models with real-time diagnostic imaging, specifically focusing on identifying cardiac chambers and orientation in the subcostal four-chamber view often used in emergency or critical care ultrasonography.
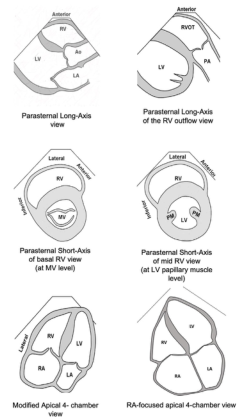
Summary : This figure presents six schematic diagrams of standard echocardiographic views used to visualize the heart chambers and valves, specifically focusing on the right ventricle (RV) and its relationship to other cardiac structures. illustration: # Views Presented : • Parasternal Long-Axis view: Shows RV, Ao (aorta), and LA (left atrium) in a longitudinal section. • Parasternal Long-Axis of the RV outflow view: Displays RVOT (right ventricular outflow tract), PA (pulmonary artery), and LV (left ventricle). • Parasternal Short-Axis of basal RV view (at MV level): Cross-sectional view at the mitral valve (MV) level, showing RV and MV. • Parasternal Short-Axis of mid RV view (at LV papillary muscle level): Cross-sectional view at the level of the LV papillary muscles, showing RV, LV, and papillary muscles (PM). • Modified Apical 4-chamber view: Displays RA (right atrium), RV, LA, and LV in a four-chamber perspective. • RA-focused apical 4-chamber view: Focuses on RA, RV, LA, and LV, emphasizing the right atrium. # Labels & Orientation : • Each diagram is labeled with anatomical structures (RV, LV, LA, RA, Ao, PA, MV, PM). • Orientation markers such as "Anterior," "Lateral," and "Septal" are provided for spatial reference. # Design Encodings : • Simple black-and-white line drawings. • Chamber walls and valves are outlined; no colour or shading. • Each view is titled below the corresponding diagram. # Analysis : • The figure systematically compares different echocardiographic views, highlighting how the right ventricle and associated structures appear in each orientation. • The progression from long-axis to short-axis and apical views demonstrates the versatility of echocardiography in assessing cardiac anatomy and function. • The inclusion of both standard and modified views allows for comprehensive visualization of the right heart.
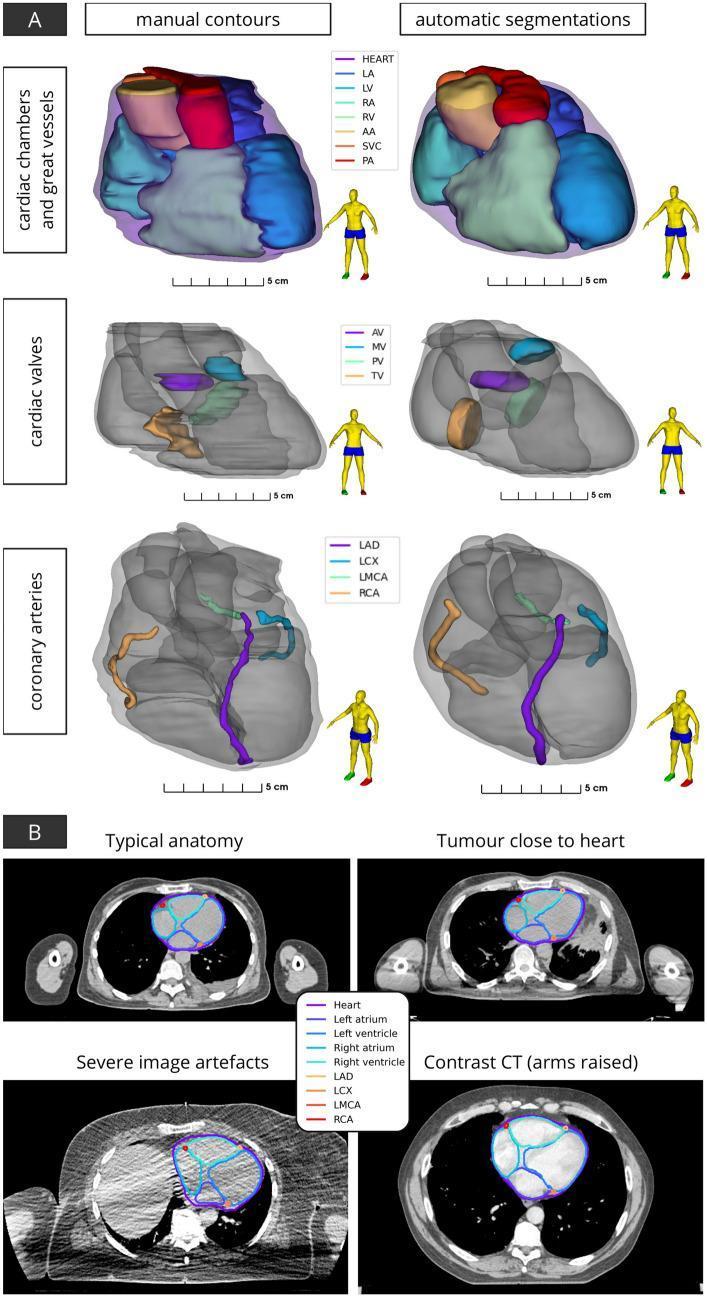
This composite educational graphic illustrates cardiac anatomy segmentation for radiotherapy planning. Section A presents three-dimensional surface renderings comparing manual contours and automatic segmentations across three tiers: cardiac chambers and great vessels (LA, LV, RA, RV, AA, SVC, PA), cardiac valves (AV, MV, PV, TV), and coronary arteries (LAD, LCX, LMCA, RCA). Each rendering highlights spatial relationships between chambers and vessels, with human figure icons indicating anatomical orientation. Section B displays axial computed tomography (CT) slices demonstrating the application of automatic segmentation algorithms in diverse clinical scenarios: 'Typical anatomy', 'Tumour close to heart', 'Severe image artefacts', and 'Contrast CT (arms raised)'. The segmentations delineate the heart, atria, ventricles, and coronary vessels, showing the model's robustness to anatomical variations and imaging challenges common in thoracic oncology. This visualization highlights the clinical utility of deep learning and multi-atlas mapping for accurate cardiac substructure identification in dose-response studies and cardiac-sparing radiotherapy.
pericardium layers fibrous serous visceral parietal diagram
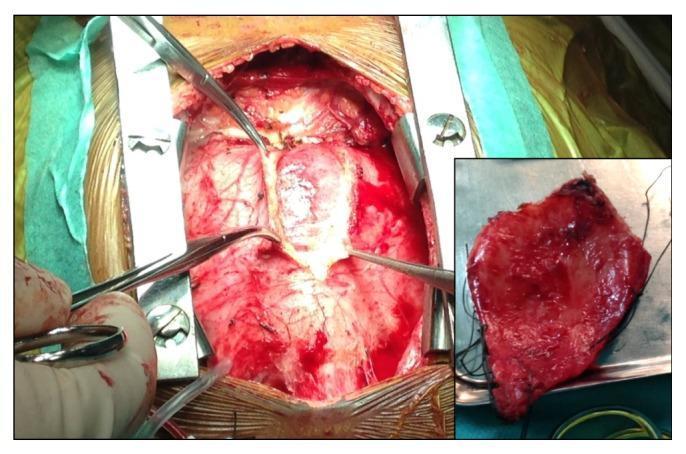
This clinical photograph captures an intraoperative view of a pericardiectomy procedure in a patient with chronic fibrous constrictive pericarditis. The primary image displays a median sternotomy with the heart exposed; the visceral and parietal layers of the pericardium appear significantly thickened, opaque, and whitish-tan in color, demonstrating loss of normal translucency. Surgical retractors and forceps are positioned to elevate the adherent, fibrous tissue from the epicardial surface. An inset image shows a gross pathological specimen of the excised pericardium. The specimen is predominantly reddish due to hypervascularization and surgical hemorrhage, featuring an irregular, roughened texture and marked thickening. The visual findings illustrate the physiological basis for ventricular constriction, where a rigid, non-compliant pericardial sac restricts cardiac filling. This content is representative of advanced cardiothoracic surgical pathology often associated with chronic inflammatory conditions such as tuberculosis.
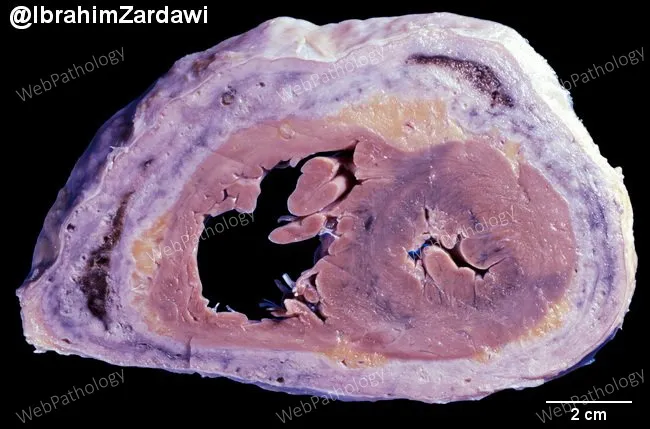
Gross pathology specimen illustrating chronic constrictive pericarditis. Modality: gross pathological examination of a fixed cardiac specimen. Technique: transverse cross-section through the pericardial sac surrounding the ventricles; surrounding mediastinal fat is variably reduced. Notable features: markedly thickened, fibrotic pericardium with calcific rim encasing an incompletely compliant heart. Visceral and parietal pericardial layers are adherent; the pericardial cavity is reduced or obliterated in several regions. The epicardial surface may show mild inflammatory change with preserved myocardial architecture. The myocardium itself demonstrates normal color and architecture but appears constrained by the stiff envelope, with limited diastolic excursion simulated by manual manipulation. Calcific nodules along the pericardial leaflets give a gritty texture on palpation. Collectively, these findings reflect the pathophysiology of constrictive physiology: restricted ventricular filling, reduced stroke volume, and equalization of diastolic pressures. The macroscopic diagnosis is constrictive pericarditis with calcification, often secondary to chronic inflammation from infection (tuberculosis), prior cardiac surgery, or idiopathic causes. Clinically, pericardiectomy removing both visceral and parietal layers is the definitive treatment. The image corroborates surgical planning by demonstrating the extent and distribution of calcification and dense fibrous tissue. Noninvasive imaging (echocardiography, CT, MRI) provides complementary assessment of hemodynamics and pericardial thickness.
cardiac muscle histology intercalated disc myocyte microscopy
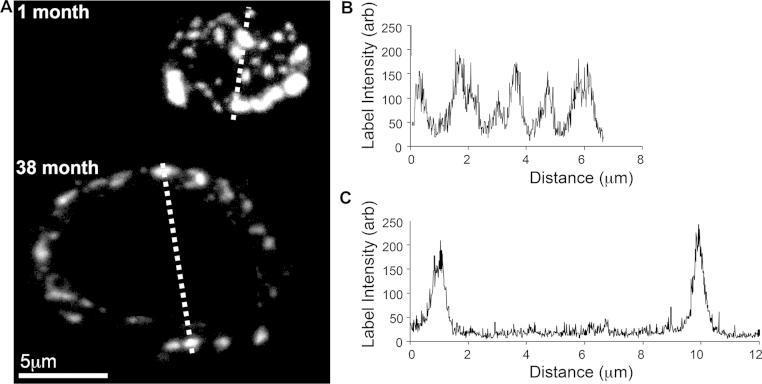
This medical illustration comprises projection confocal images and corresponding line-profile graphs analyzing the spatial distribution of Connexin 43 (Cx43) at cardiac intercalated discs across different ages. Panel A displays two confocal micrographs of atrial myocyte intercalated discs labeled for Cx43. The 1-month-old specimen shows a dense, heterogeneous distribution of Cx43 'hot spots' across the entire area of the disc (approx. 8 μm width). In contrast, the 38-month-old specimen exhibits a larger intercalated disc (approx. 12 μm width) with Cx43 restricted primarily to the outer rim, indicating age-related spatial remodeling and lateralization. Panels B and C provide quantitative intensity profiles (label intensity in arbitrary units vs. distance in μm) corresponding to the dashed lines in Panel A. The 1-month profile (B) demonstrates multiple high-intensity peaks across the disc, while the 38-month profile (C) shows two distinct peaks at the periphery with a significant signal loss in the central region. This visual evidence supports concepts of cellular aging, gap junction remodeling, and potential impacts on atrial conduction velocity.
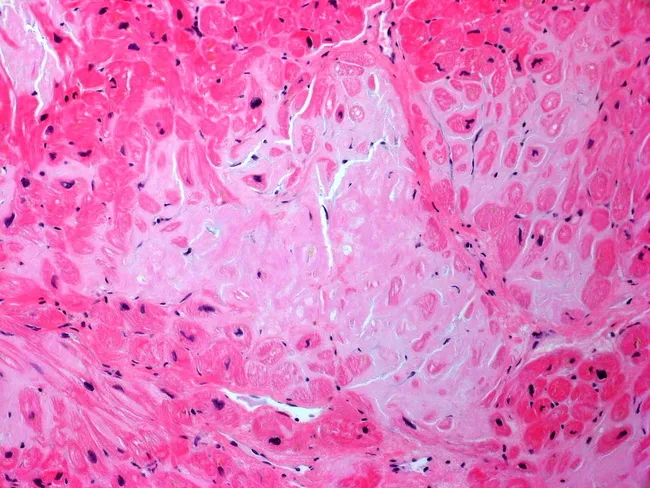
Histology of cardiac tissue demonstrating AL (light-chain) amyloid depositions with associated myocardial atrophy. Prepared as a hematoxylin and eosin stained section, viewed under bright-field microscopy, the myocardium shows extensive extracellular, eosinophilic, amorphous material within the interstitium surrounding relics of cardiac myocytes. The deposits are pale pink, homogeneous, and nonfibrillar by routine light microscopy, consistent with amyloid neuropathologic patterns and typical of AL amyloidosis. Cardiac myocytes exhibit variable atrophy with preserved nuclei in the interstitial milieu; there is sparse inflammatory infiltrate and disruption of normal architecture, contributing to stiff, diastolic-restrictive physiology. The diagnosis is supported by clinical context: a patient with multiple myeloma and lambda light chain clonal plasma cells, whose dyspnea reflects progressive restrictive cardiomyopathy due to myocardial amyloid infiltration. In histopathology terms, extracellular matrix expansion by amyloid coincides with deposition within vessel walls and perimysial spaces, potentially impairing coronary perfusion and contractile function. Clinically, this pattern signals poor prognosis if cardiac involvement is substantial, guiding oncologic therapy and cardiac supportive care. Differential considerations include transthyretin-type amyloid deposition and senile amyloidosis, but the light-chain profile and marrow findings make AL amyloidosis the favored etiology in this case. This slide illustrates characteristic cardiomyopathic changes with light-chain amyloid and myocyte attrition.
mediastinum divisions superior inferior anterior middle posterior diagram
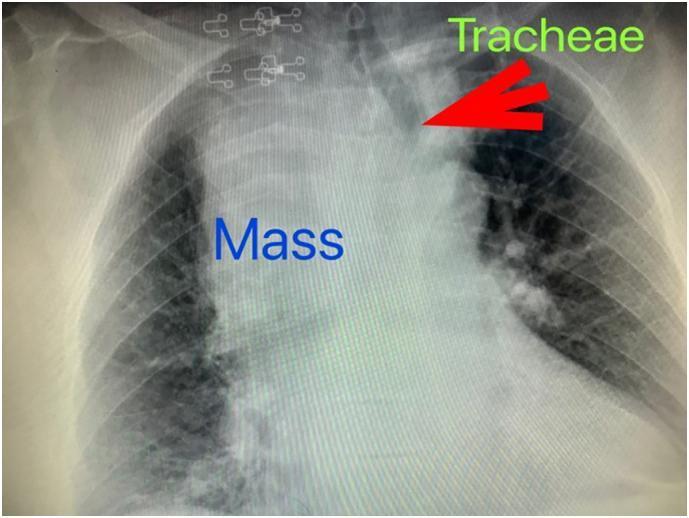
A posterior-anterior (PA) chest x-ray demonstrating significant pathology in the superior and middle mediastinum. The most prominent finding is a severely widened mediastinum, characterized by a large, well-defined radiopaque mass occupying the upper and middle thoracic cavity. This mass is causing a marked mass effect, resulting in the significant deviation of the trachea to the left of the midline, as indicated by the labeled red arrow. The mass displays a radiographic appearance consistent with a retrosternal goiter, extending from the cervical region into the thoracic inlet. Metallic surgical clips are visible in the upper right cervical area, suggesting previous surgery. The lung fields appear relatively clear, though the cardiac silhouette is partially obscured by the large mediastinal opacity. This diagnostic image is used to illustrate the complications of large mediastinal masses, such as airway compression and displacement, relevant for pulmonology, endocrine surgery, and critical care education.
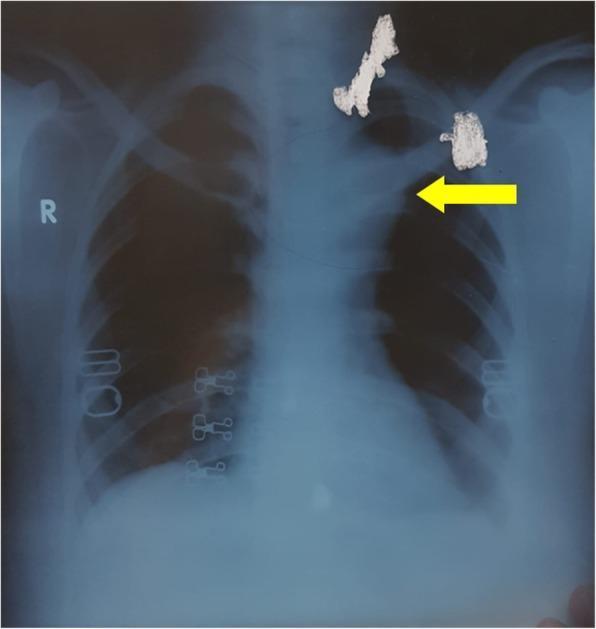
A posterior-anterior (PA) view chest radiograph (diagnostic imaging) demonstrating a significant widening of the superior and middle mediastinum. A yellow arrow points to the left-sided expansion of the mediastinal silhouette, specifically in the region of the aortic knob and descending thoracic aorta, suggesting vascular pathology such as an aortic aneurysm or pseudo-aneurysm. The lung fields appear relatively lucent, though there is some obscured detail in the left upper lobe due to the overlying mass effect of the widened mediastinum. Notable external or iatrogenic findings include irregular, highly radiopaque objects located in the superior chest and supraclavicular regions, as well as metallic surgical clips or staples visible along the lateral ribcage and paraspinal areas. This imaging serves as an educational example for identifying mediastinal mass effects and vascular emergencies in clinical radiology.
🫀 Study Guide 1: Gross & Microscopic Anatomy of the Heart
1. The Mediastinum - What It Is and What's Inside
- Anteriorly: sternum
- Posteriorly: thoracic vertebrae
- Superiorly: superior thoracic aperture (into the neck)
- Inferiorly: diaphragm
- Laterally: mediastinal pleura on each side
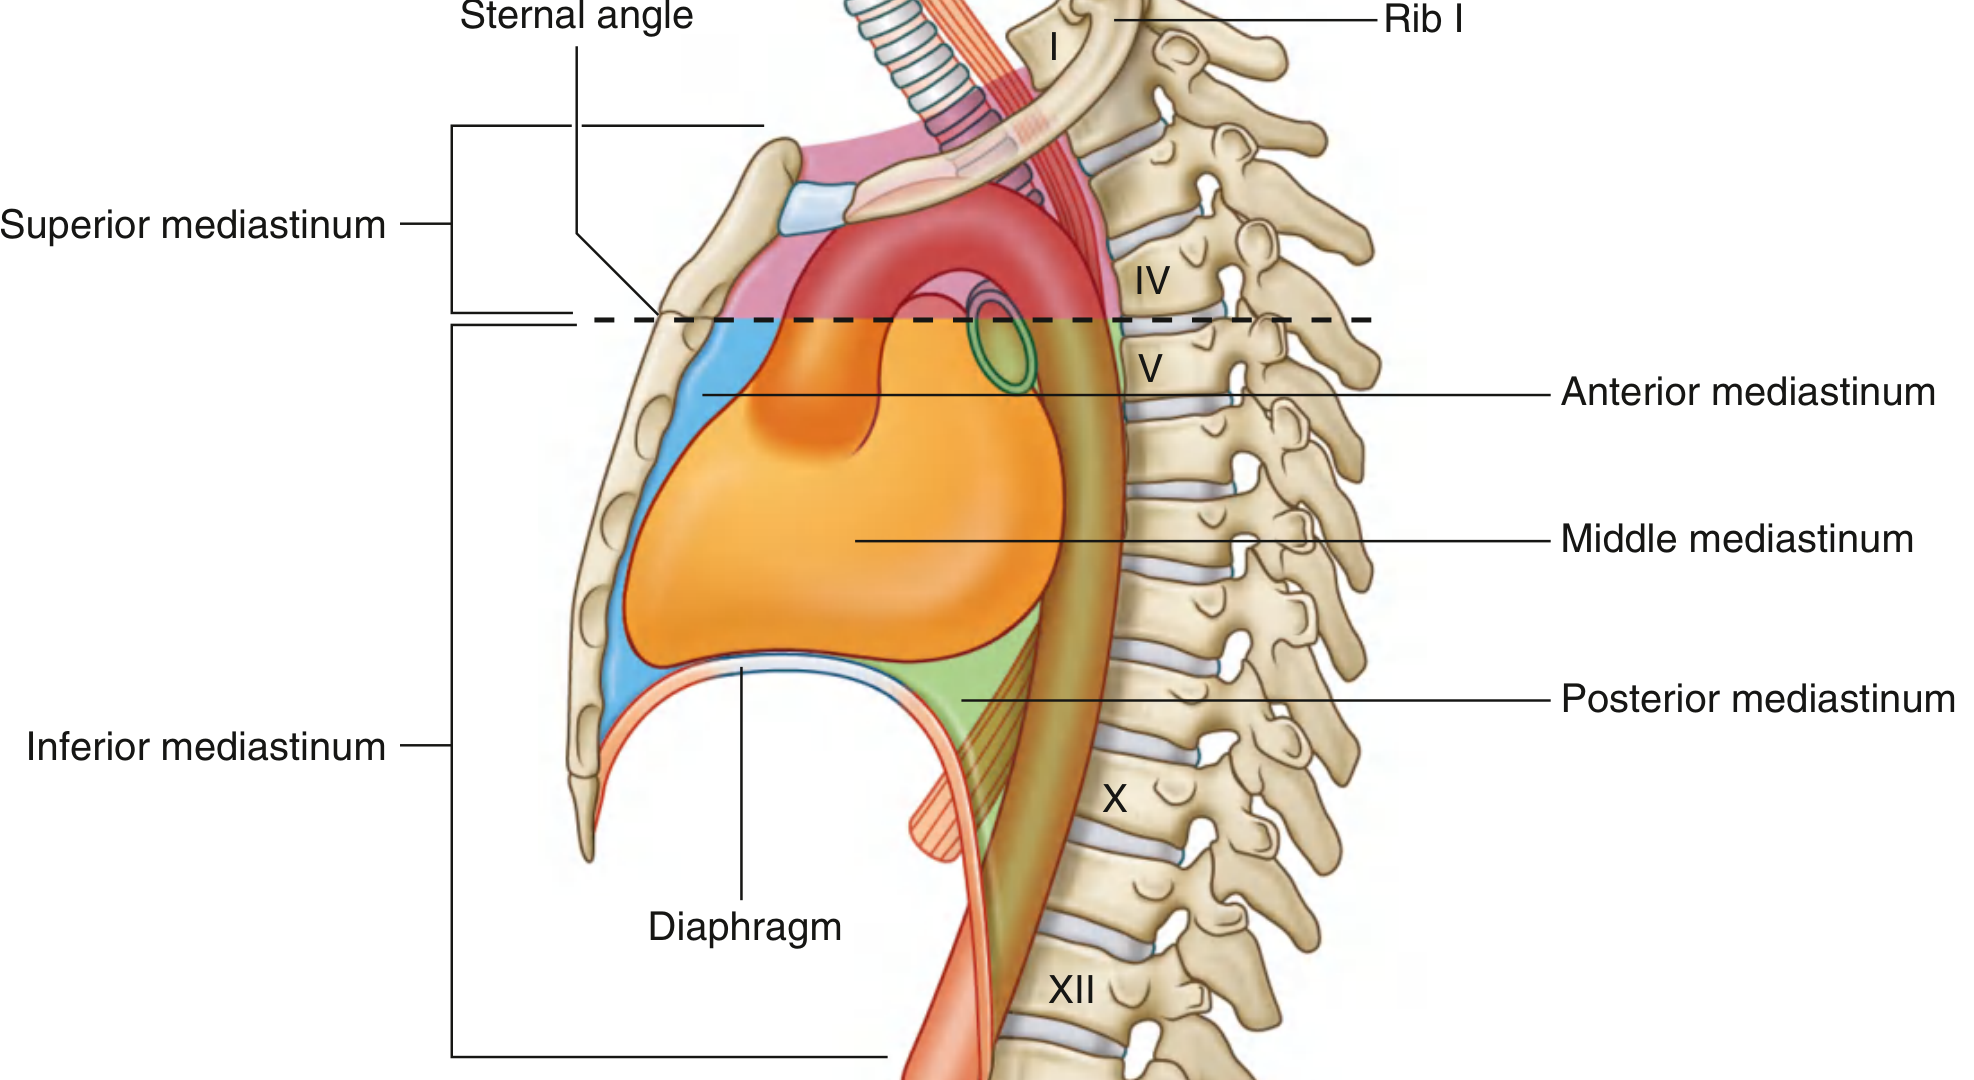
| Division | Contents |
|---|---|
| Superior mediastinum | Thymus, great vessels (aortic arch, SVC, brachiocephalic veins), trachea, oesophagus, thoracic duct, vagus & phrenic nerves |
| Anterior mediastinum | Narrow space between sternum and pericardium - loose connective tissue, lymph nodes |
| Middle mediastinum | Heart + pericardium (the main topic of this guide!) |
| Posterior mediastinum | Descending aorta, oesophagus, thoracic duct, azygos veins, sympathetic chain |
2. Location of the Heart in the Mediastinum and Its Relations
- Two-thirds of the heart lies to the LEFT of the midline
- The apex (tip, formed by the left ventricle) points to the left, downward, and forward - located at the 5th intercostal space, ~2 cm medial to the midclavicular line
- The base (the "top/back" of the heart, formed mainly by the left atrium) faces posteriorly and to the right, receiving the pulmonary veins
- Anterior: sternum and costal cartilages (3rd-6th ribs) - this is why we do sternal compressions in CPR
- Posterior: oesophagus, descending aorta, thoracic vertebrae
- Superior: great vessels (aorta, pulmonary trunk, SVC)
- Inferior: diaphragm
- Laterally: pleural cavities (lungs on each side)
3. Gross Anatomy of the Heart
A) The Pericardium
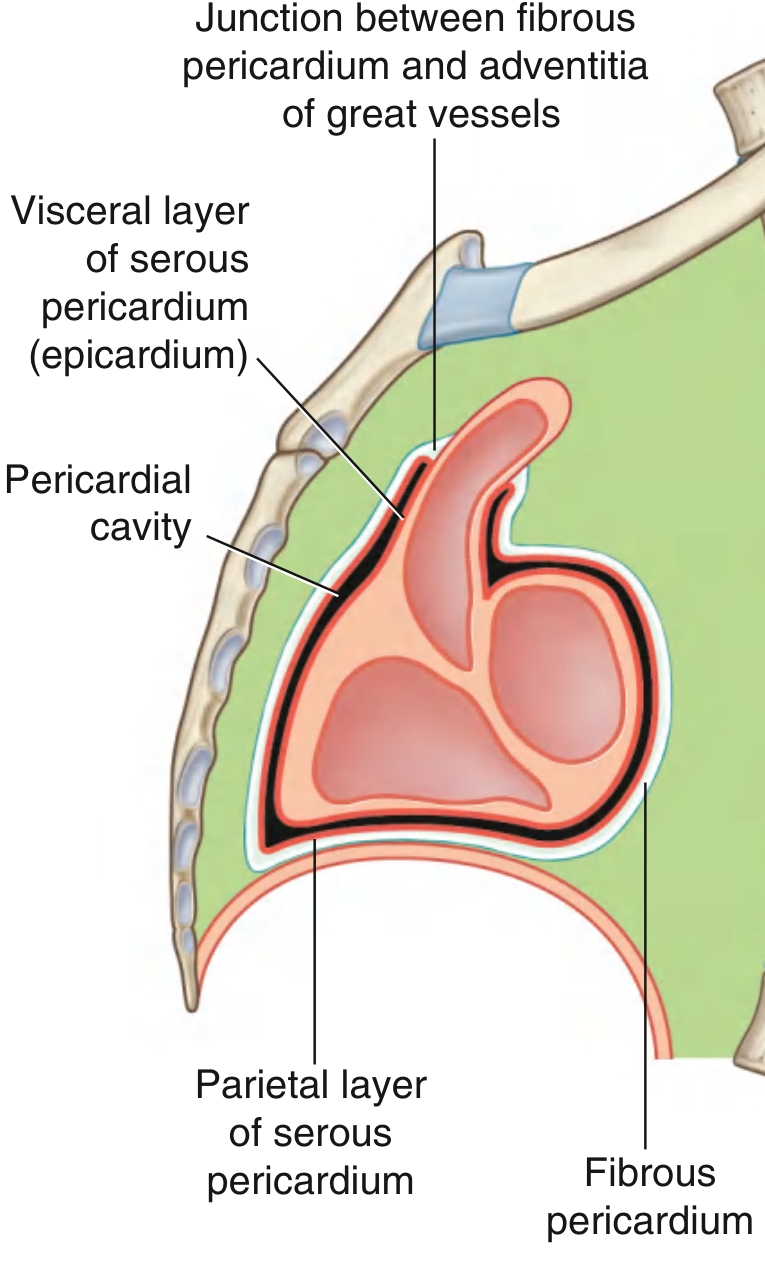
- Tough, inelastic connective tissue
- Cone-shaped sac, base attached to the diaphragm, apex continuous with the adventitia of the great vessels
- Also attached anteriorly to the sternum via sternopericardial ligaments
- Functions: anchors the heart in place, prevents over-distension
- Innervated by the phrenic nerve (C3, C4, C5)
- Parietal layer - lines the inner surface of the fibrous pericardium
- Visceral layer (Epicardium) - directly covers the outer surface of the heart
Clinical pearl: If excess fluid accumulates in this space (pericardial effusion), the rigid fibrous pericardium cannot expand - this compresses the heart and is called cardiac tamponade (a life-threatening emergency).
B) The Layers of the Heart Wall
| Layer | Description |
|---|---|
| Epicardium | = visceral serous pericardium. Thin outer layer, contains coronary vessels and fat |
| Myocardium | The thick muscle layer - the actual pumping muscle. Thickest in the LEFT ventricle |
| Endocardium | Thin inner lining of the heart chambers and valves; smooth to prevent clots |
C) The Chambers and Why Wall Thickness Differs
| Chamber | Wall Thickness | Why? |
|---|---|---|
| Atria (both) | Thin (~2-3 mm) | Just collect blood and push it down a short distance into the ventricles (low pressure) |
| Right ventricle | Moderate (~3-5 mm) | Pumps blood to the lungs (pulmonary circulation - LOW resistance) |
| Left ventricle | Thick (~8-12 mm) | Pumps blood to the entire body (systemic circulation - HIGH resistance) |
D) The Sulcus and Septum
- Atrioventricular (coronary) sulcus: The groove running around the outside of the heart separating the atria from the ventricles. The coronary arteries run in this groove.
- Interventricular sulcus (anterior & posterior): Grooves on the surface of the heart marking where the interventricular septum is inside.
- Interatrial septum: Divides the two atria. Contains the fossa ovalis - the remnant of the foramen ovale from fetal circulation.
- Interventricular septum: Divides the two ventricles. Has a muscular lower part and a thin membranous upper part.
E) The Valves
| Valve | Location | Leaflets (cusps) |
|---|---|---|
| Tricuspid valve | Right AV orifice | 3 cusps (anterior, posterior, septal) |
| Mitral (bicuspid) valve | Left AV orifice | 2 cusps (anterior, posterior) |
| Valve | Location | Cusps |
|---|---|---|
| Pulmonary valve | Right ventricle → pulmonary trunk | 3 semilunar cusps |
| Aortic valve | Left ventricle → aorta | 3 semilunar cusps |
F) Chordae Tendineae and Papillary Muscles
- Papillary muscles: Cone-shaped muscular projections from the inner ventricular wall (trabeculae carneae). The LV has 2 (anterior and posterior); the RV has 3.
- Chordae tendineae: Fibrous string-like cords connecting the free edges of the valve leaflets to the papillary muscles.
- Function: When the ventricle contracts, the papillary muscles also contract simultaneously, pulling on the chordae tendineae to keep the valve cusps from prolapsing back into the atrium. This prevents regurgitation (blood flowing backwards).
Clinical pearl: If a papillary muscle ruptures (e.g. after a heart attack), the chordae tendineae have no support - the mitral valve prolapses back, causing acute severe mitral regurgitation - a cardiac emergency.
4. Histology of the Three Layers of the Heart
| Layer | Histological Features |
|---|---|
| Epicardium | Mesothelium (simple squamous epithelium) on top, loose connective tissue below, contains blood vessels, lymphatics, nerves, and fat |
| Myocardium | Cardiac muscle cells (myocytes) arranged in complex spirals. Cells are branched, striated, and connected by intercalated discs. Lots of mitochondria (25-35% of cell volume) for constant energy supply |
| Endocardium | Simple squamous endothelium (continuous with blood vessel endothelium), subendothelial connective tissue, and a subendocardial layer that contains part of the conducting system (Purkinje fibers) |
5. The Cardiac Muscle Cell (Myocyte) - Special Features
| Feature | Detail |
|---|---|
| Shape | Short, branched, cylindrical cells (~100 µm long, ~15 µm wide) |
| Nucleus | Usually ONE central nucleus (skeletal muscle has multiple peripheral nuclei) |
| Striations | Present - due to organized actin and myosin filaments (sarcomeres) |
| Intercalated discs | Dark transverse bands visible on H&E staining - these are the cell junctions connecting adjacent myocytes |
| Mitochondria | Extremely abundant (25-35% of cell volume) - cardiac muscle NEVER rests, needs constant ATP |
| T-tubules | Present but wider than in skeletal muscle; help spread electrical signals deep into the cell |
-
Desmosomes (Macula adherens) - Strong mechanical anchors; hold cells together against the force of contraction so cells don't pull apart. Made of desmoplakin and cadherins.
-
Fascia adherens - Also a mechanical junction; anchors actin filaments from the last sarcomere to the cell membrane. Largest component of the intercalated disc.
-
Gap junctions (Nexus) - Formed by connexin proteins (mainly Connexin 43 in ventricles). These are tiny aqueous channels that directly connect the cytoplasm of adjacent cells, allowing free flow of ions (Na⁺, K⁺, Ca²⁺) and small molecules between cells.
Simple analogy: Desmosomes and fascia adherens = Velcro (mechanical strength). Gap junctions = telephone lines (electrical communication).
Quick Summary Table
| Topic | Key Points |
|---|---|
| Mediastinum | Central chest partition; Superior (above sternal angle) + Inferior (Anterior/Middle/Posterior) |
| Heart location | Middle mediastinum; 2/3 left of midline; apex at 5th ICS midclavicular line |
| Pericardium | Fibrous (outer tough) + Serous (parietal + visceral/epicardium); pericardial fluid between |
| Heart walls | Epi- (outer), Myo- (muscle), Endo- (inner); LV thickest wall |
| Valves | AV valves: tricuspid (R) and mitral (L); Semilunar: pulmonary (R) and aortic (L) |
| Chordae/papillary | Prevent AV valve prolapse during systole |
| Histology | Epi = mesothelium; Myo = cardiac muscle + intercalated discs; Endo = endothelium |
| Myocyte | Branched, 1 central nucleus, striated, intercalated discs (desmosomes + gap junctions) |
| Gap junctions | Made of connexin; allow electrical coupling; make heart a functional syncytium |

do the same for this image too
cardiac conduction system SA node AV node bundle of His Purkinje fibers diagram
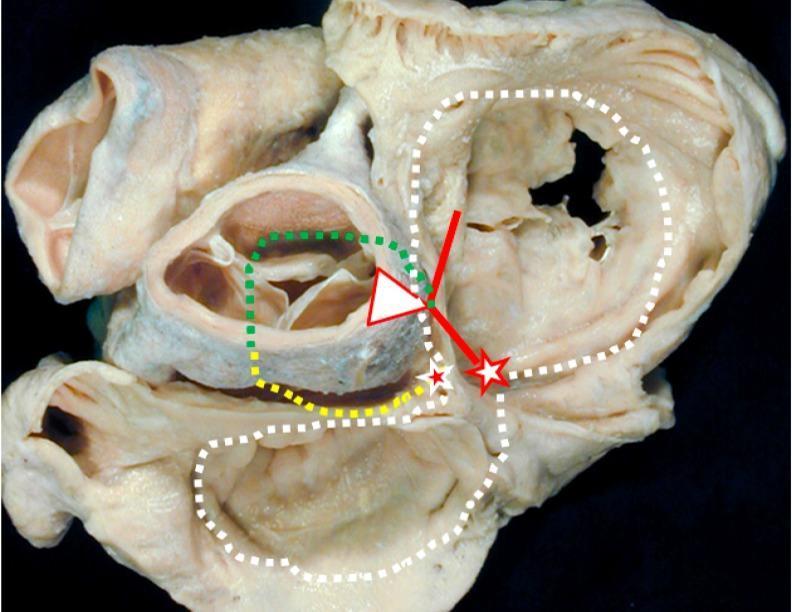
Anatomical Diagram over a clinical photograph of a gross cardiac specimen, viewed from the atrial aspect (superior view) of the cardiac base. The image illustrates the complex anatomy of the cardiac conduction system and vestigial embryonic structures. Key landmarks include the atrioventricular (AV) node (white star with red borders) and the retroaortic node (red star with white borders). The conduction pathway is delineated by a solid red line representing the bundle of His. Supplemental embryonic and auxiliary tracts are marked with dotted lines: a green dotted line shows the 'dead-end tract' continuing from the AV conduction axis toward the outflow tract; a yellow dotted line marks the retro-aortic ring branch; and a white dotted line traces the path of the embryonic atrioventricular ring. This visual is designed for advanced medical education in cardiac electrophysiology and embryology, highlighting the anatomical basis for idiopathic ventricular arrhythmias and the clinical significance of persistent embryonic tissues within the heart's conduction framework.
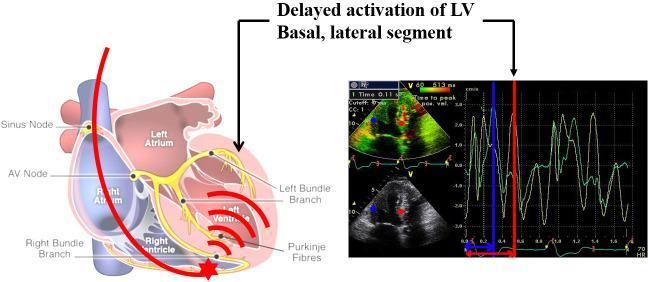
This composite medical illustration demonstrates the pathophysiology of right ventricular (RV) pacing-induced left ventricular (LV) dyssynchrony. The left side features a schematic anatomical diagram of the heart showing the cardiac conduction system (Sinus node, AV node, Bundle branches, and Purkinje fibers). A red line represents a pacing lead traversing the right atrium to the RV apex (marked by a red star). Red wavefront arcs illustrate electrical activation spreading from the RV pacing site to the LV, highlighting the late activation of the LV lateral wall. The right side contains diagnostic images, including a color tissue Doppler echocardiogram and a corresponding velocity-time tracing. The Doppler tracing shows two distinct myocardial velocity curves (green) with vertical blue and red marker lines indicating the significant temporal delay between segmental contractions. A label and arrows point to both the LV basal lateral segment on the diagram and the delayed peak on the Doppler tracing, identifying the mechanical dyssynchrony resulting from the non-physiological electrical sequence of RV apical pacing.
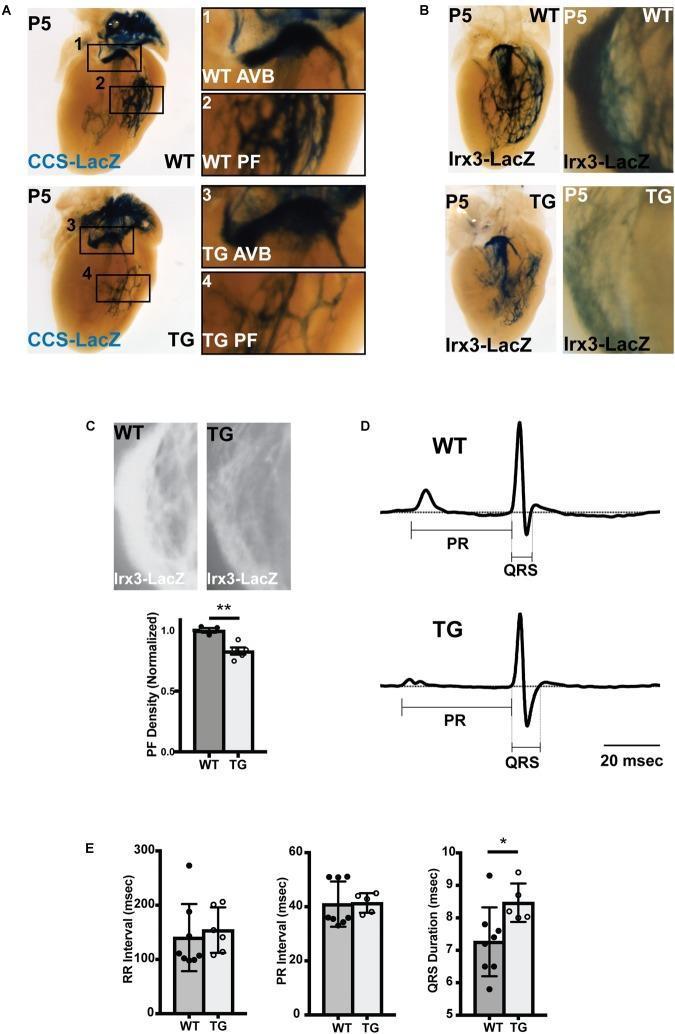
Educational medical graphic illustrating abnormal ventricular conduction system (VCS) structure and electrophysiology in a mouse model of miR-1 overexpression. Panel A shows whole-mount P5 neonatal hearts with CCS-LacZ reporter activity; magnified views compare wild-type (WT) and transgenic (TG) atrioventricular bundles (AVB) and Purkinje fibers (PF), revealing significantly reduced PF branching in TG hearts. Panel B utilizes Irx3-LacZ staining to further demonstrate diminished PF density in the left bundle branch and right ventricle of TG mice. Panel C provides quantification, with a bar graph showing a statistically significant decrease in normalized PF density (p < 0.01). Panel D displays averaged lead aVF ECG tracings, highlighting a prolonged QRS duration in TG mice compared to WT. Panel E includes bar graphs of cardiac intervals (RR, PR, and QRS), confirming that while heart rate and AV node conduction are unchanged, VCS conduction is significantly slowed, as evidenced by increased QRS duration (p < 0.05). This composite figure demonstrates that premature miR-1 upregulation leads to Purkinje fiber hypoplasia and conduction dysfunction.
⚡ Study Guide 2: Cardiac Conduction System & Cardiac Action Potential
1. Properties of Cardiac Muscle
| Property | Meaning | Simple Explanation |
|---|---|---|
| Excitability | Ability to respond to a stimulus | The heart can be triggered by an electrical signal |
| Contractility | Ability to generate force when stimulated | The muscle actually squeezes to pump blood |
| Conductivity | Ability to pass electrical impulses from cell to cell | Signals travel through the heart via gap junctions and specialized pathways |
| Rhythmicity (Automaticity) | Ability to spontaneously generate its own electrical impulse | The SA node fires on its own without brain input - this is why the heart keeps beating even outside the body |
2. The Cardiac Conduction System
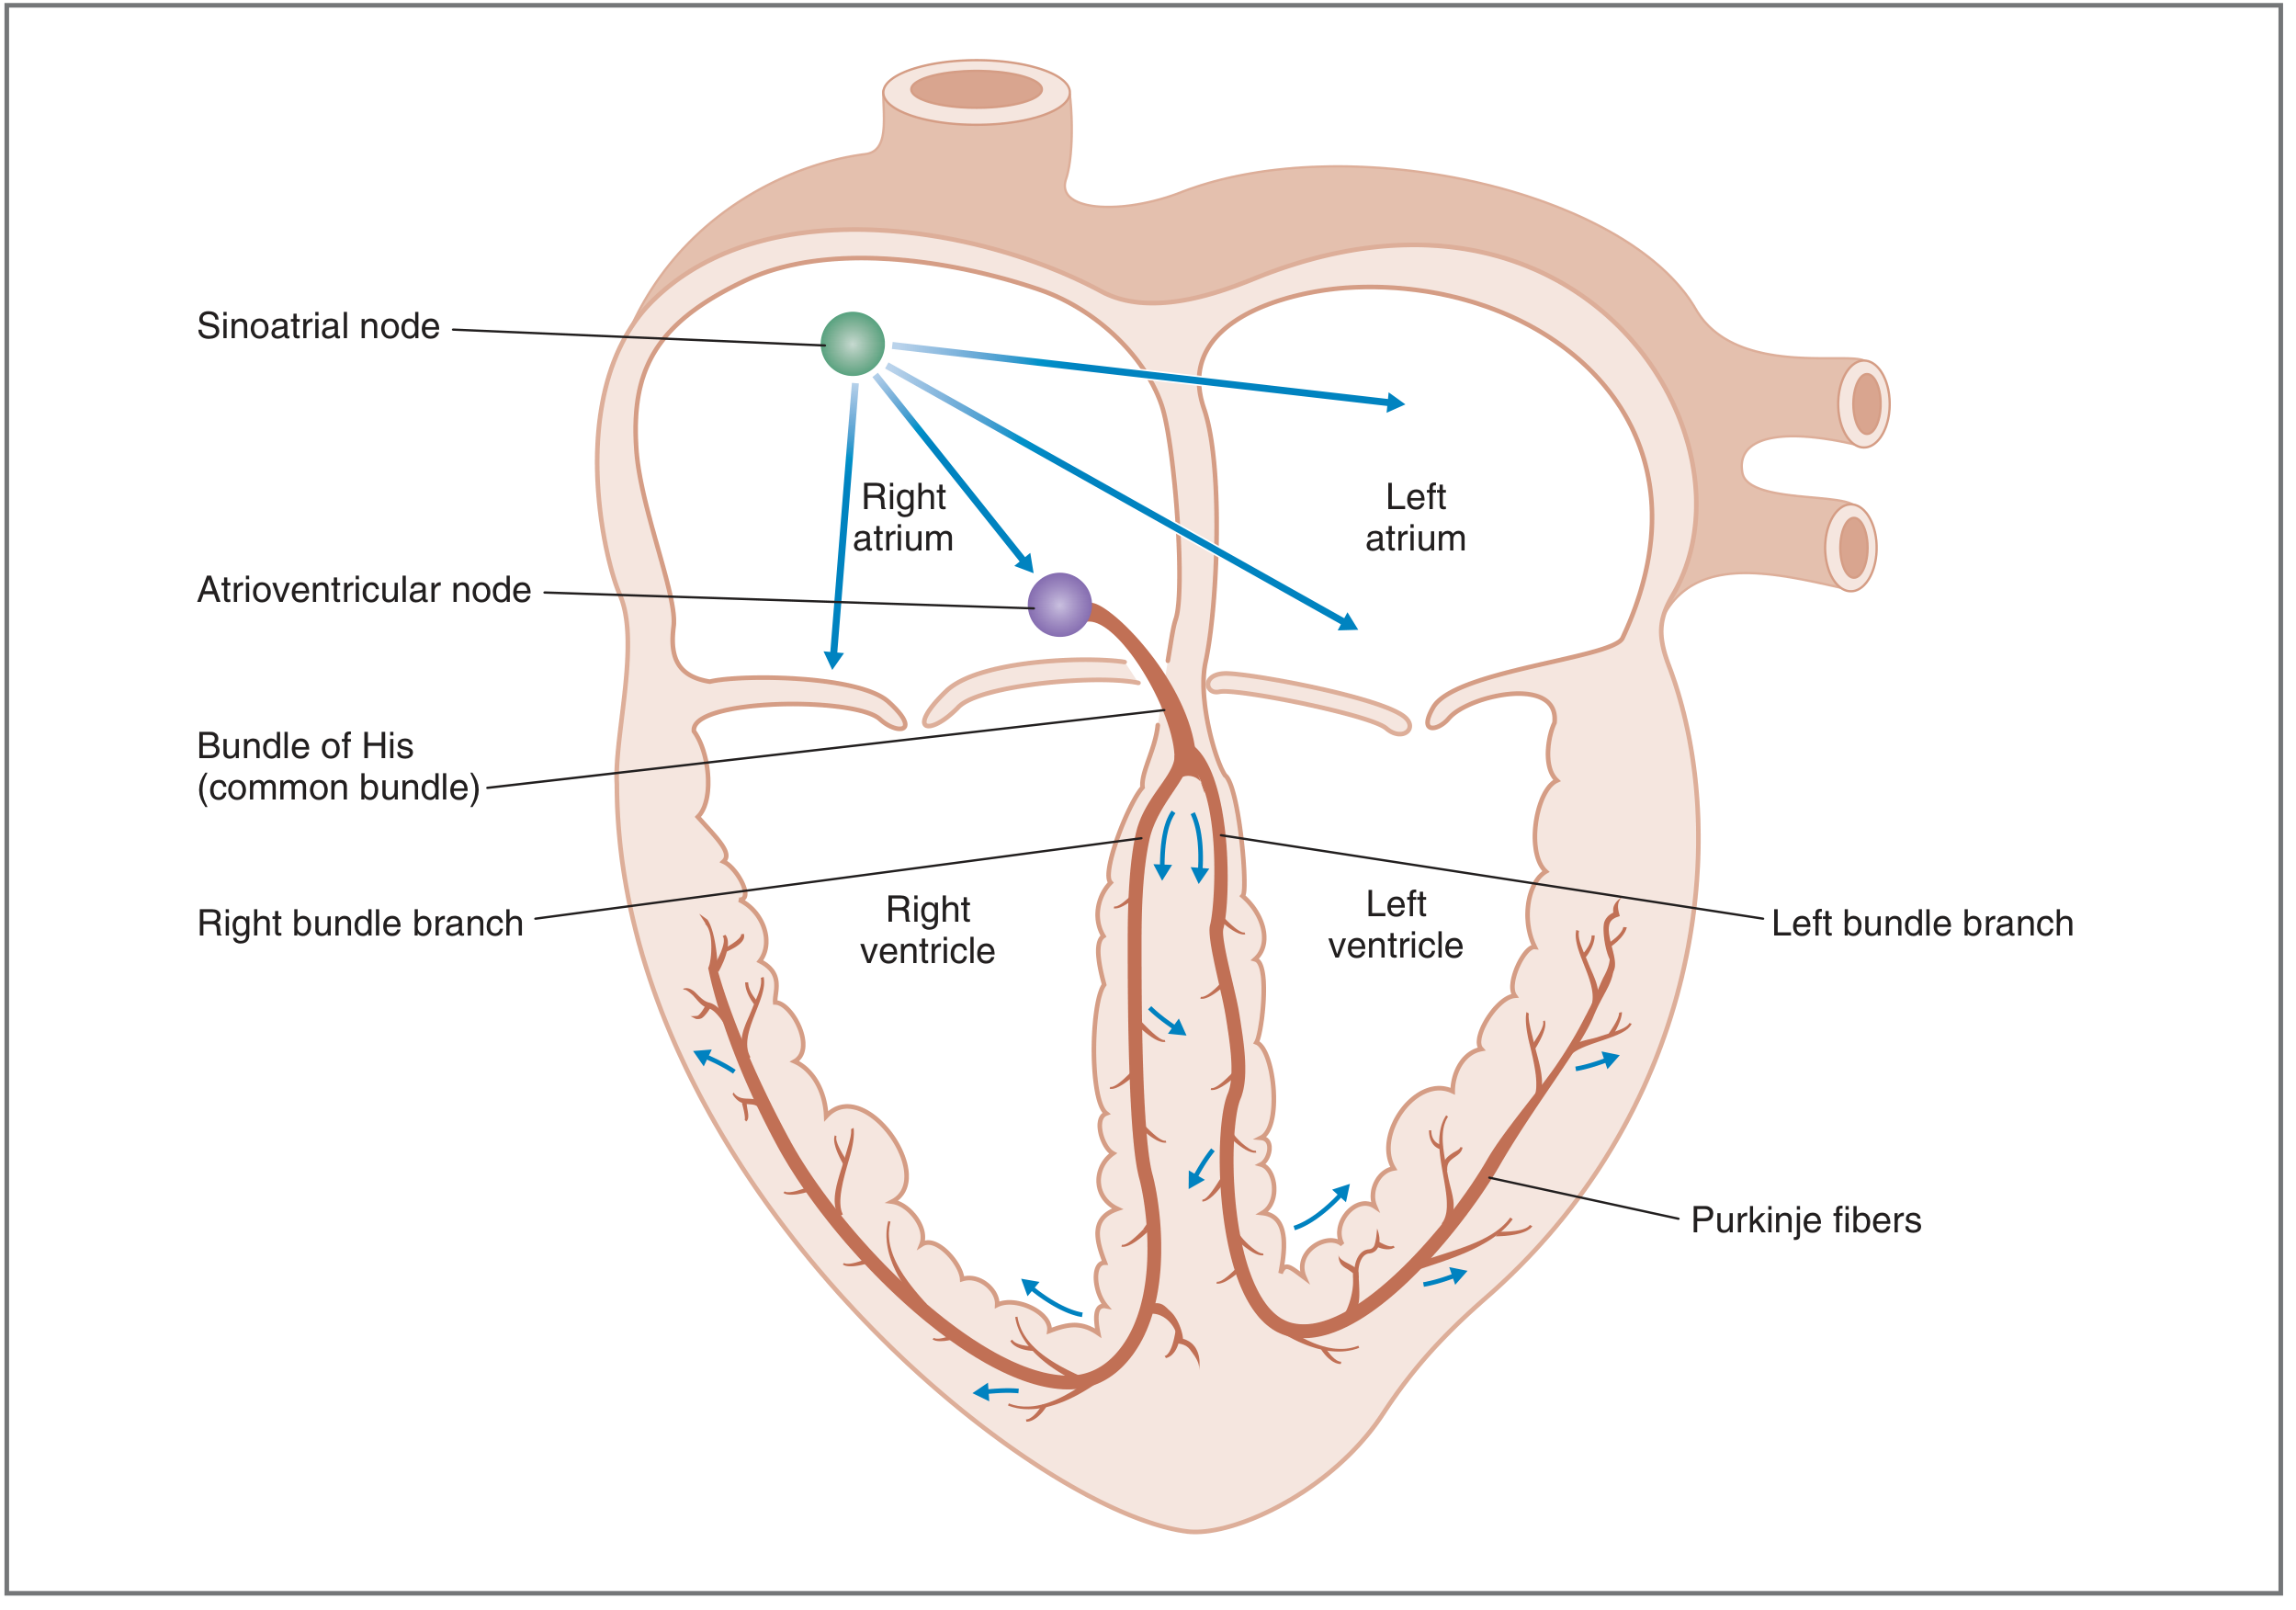
A) The Components and Their Locations
| Structure | Location | Intrinsic Rate |
|---|---|---|
| SA node (Sinoatrial node) | Right atrium, near the junction with the Superior Vena Cava | 60-100 bpm (dominant pacemaker) |
| AV node (Atrioventricular node) | Floor of the right atrium, above the tricuspid valve, at the junction of atria and ventricles | ~40-60 bpm (backup pacemaker) |
| Bundle of His | Penetrates the fibrous skeleton of the heart and runs through the interventricular septum | ~40 bpm |
| Right & Left bundle branches | Run down each side of the interventricular septum | ~20-40 bpm |
| Purkinje fibres | Spread throughout the inner walls of both ventricles (subendocardial) | ~20 bpm (least reliable) |
B) Functions of Autorhythmic Cells
- They do not have a stable resting membrane potential
- Their membrane potential spontaneously drifts upward during diastole (called Phase 4 spontaneous depolarization or pacemaker potential)
- This drift is mainly caused by the funny current (I_f) - an inward Na⁺ current that turns on at very negative potentials
- When this drift reaches threshold, they fire an action potential automatically
Clinical pearl: If the SA node fails, the AV node takes over at 40-60 bpm. If the AV node also fails, Purkinje fibres can pace at 20 bpm - barely enough to maintain life. This is a medical emergency.
C) Conduction Velocity in Different Parts
| Tissue | Conduction Velocity |
|---|---|
| SA node | 0.05 m/s (SLOW) |
| Atrial pathways | 1 m/s |
| AV node | 0.05 m/s (SLOW - intentional delay!) |
| Bundle of His | 1 m/s |
| Purkinje system | 4 m/s (FASTEST) |
| Ventricular muscle | 1 m/s |
D) The Pathway - Step by Step
SA node → atrial internodal tracts → both atria contract
↓
AV node (deliberate delay ~0.1 sec)
↓
Bundle of His (common bundle)
↓
Left bundle branch + Right bundle branch
↓
Purkinje fibres spread throughout ventricles
↓
Ventricles contract from apex → base
- Atria contract BEFORE ventricles (atria fill ventricles first)
- Apex contracts before base (blood is ejected upward toward the outflow tracts)
3. Factors Affecting the Heartbeat
Neural Factors (Autonomic Nervous System)
| Division | Neurotransmitter | Receptor | Effect on Heart |
|---|---|---|---|
| Sympathetic ("fight or flight") | Norepinephrine | β₁-adrenoceptors | ↑ Heart rate (chronotropy), ↑ conduction speed (dromotropy), ↑ force of contraction (inotropy) |
| Parasympathetic / Vagus nerve ("rest and digest") | Acetylcholine | Muscarinic (M2) receptors | ↓ Heart rate, ↓ AV node conduction speed, ↓ atrial contractility |
Hormonal Factors
- Epinephrine (adrenaline) from the adrenal medulla: same effect as sympathetic activation (β₁ stimulation) - speeds up the heart
- Thyroid hormones: increase the number of β₁ receptors on the heart - hyperthyroidism causes tachycardia
- Glucagon: mild positive chronotropic effect
Other Factors
- Temperature: fever raises heart rate (~10 bpm per 1°C rise)
- Electrolytes: hyperkalemia slows conduction; hypokalemia and hypercalcemia can cause arrhythmias
- Cardiovascular centre in the medulla oblongata: integrates all neural and hormonal signals and coordinates output through the sympathetic and parasympathetic nervous systems
4. The Cardiac Action Potential
Type 1: "Fast Response" - Ventricular/Atrial/Purkinje Action Potential
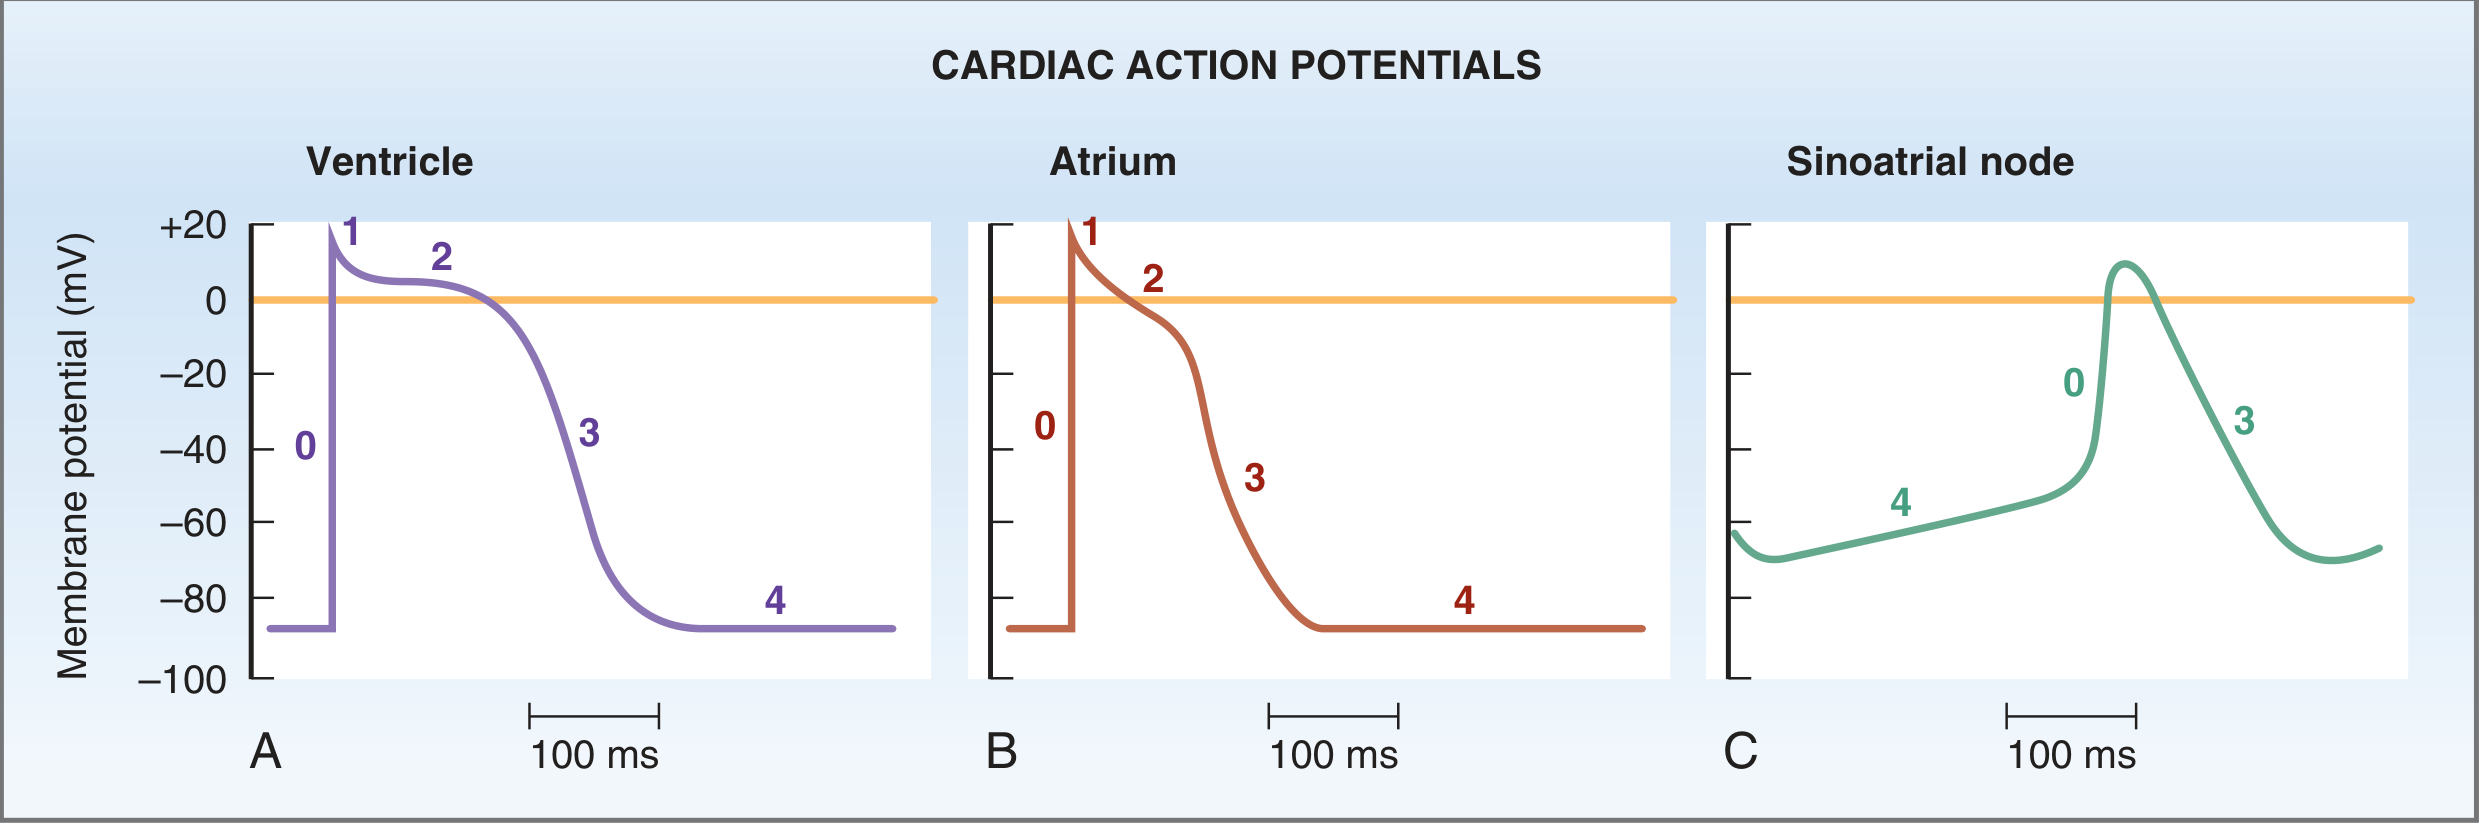
| Phase | Name | What Happens | Ion responsible |
|---|---|---|---|
| Phase 4 | Resting (electrical diastole) | Stable at -85 mV | K⁺ channels (I_K1) keep cell negative |
| Phase 0 | Upstroke (rapid depolarization) | Membrane potential shoots rapidly from -85 mV to +20 mV | Fast Na⁺ channels open - Na⁺ rushes IN |
| Phase 1 | Early rapid repolarization | Brief dip from +20 mV down toward 0 mV | Na⁺ channels inactivate; transient outward K⁺ current (I_to) |
| Phase 2 | Plateau | Membrane stays near 0 mV for ~200 ms | L-type Ca²⁺ channels open - Ca²⁺ flows IN; balances K⁺ flowing OUT |
| Phase 3 | Final repolarization | Membrane returns to -85 mV | Ca²⁺ channels close; K⁺ channels (I_K) open fully - K⁺ rushes OUT |
Type 2: "Slow Response" - SA Node (Pacemaker) Action Potential
| Phase | What Happens | Ion responsible |
|---|---|---|
| Phase 4 | Spontaneous slow depolarization (pacemaker potential) - drifts from ~-60 mV upward | Funny current (I_f) = slow inward Na⁺ current; also T-type Ca²⁺ channels |
| Phase 0 | Slow upstroke (much less steep than fast response) | L-type Ca²⁺ channels open (NOT Na⁺ channels - this is the key difference!) |
| Phase 3 | Repolarization back to ~-60 mV | K⁺ channels open; K⁺ flows OUT |
| No Phase 1 or Phase 2 plateau |
Cardiac vs Skeletal Muscle Action Potential - Key Differences
| Feature | Cardiac Muscle | Skeletal Muscle |
|---|---|---|
| Duration | ~200-300 ms | ~1-2 ms |
| Plateau (Phase 2) | YES - driven by Ca²⁺ | NO |
| Refractory period | Long (~200-250 ms) | Very short (~1-2 ms) |
| Can tetanus occur? | NO - cannot be tetanized | YES - can tetanize |
| Source of Ca²⁺ | Both extracellular (through L-type channels) AND internal SR (via CICR) | Mainly internal SR only |
| Pacemaker activity | SA node fires automatically | Requires nerve stimulus |
The Refractory Period - Why It Matters
Clinical pearl: The vulnerable period is the brief relative refractory period near the end of Phase 3 (at the peak of the T wave on ECG). If a premature stimulus hits during this period (called "R-on-T phenomenon"), it can trigger ventricular fibrillation (VF) - a lethal arrhythmia.
Quick Reference Summary
CONDUCTION PATHWAY:
SA node (60-100bpm) → Atria → AV node [DELAY] → Bundle of His
→ Left + Right bundle branches → Purkinje fibres → Ventricles
Fastest: Purkinje (4 m/s) | Slowest: SA & AV nodes (0.05 m/s)
FAST RESPONSE AP (ventricle):
Ph4: rest (-85mV) → Ph0: Na⁺ in (upstroke) → Ph1: K⁺ out
→ Ph2: Ca²⁺ in (plateau) → Ph3: K⁺ out (repolarization)
SLOW RESPONSE AP (SA node):
Ph4: spontaneous drift (I_f, funny current)
→ Ph0: Ca²⁺ in (slow upstroke) → Ph3: K⁺ out
AUTONOMIC:
Sympathetic (β₁) → ↑HR, ↑conduction, ↑contractility
Parasympathetic (vagus, M2) → ↓HR, ↓AV conduction
REFRACTORY PERIOD = long in cardiac → prevents tetanus → heart can fill