
What is radiation weighting factor, tissue weighting factor, equivalent dose, effective dose, dose limits, determinants? explain in very simple terms i should remeber these without any doubt and confusion afterwards
Radiation Dosimetry - Everything You Need to Know
Step 1 - Absorbed Dose (the raw physical measurement)
1 Gy = 1 joule of energy absorbed per kilogram of tissue
Step 2 - Radiation Weighting Factor (wR) - "How Dangerous Is This Type of Radiation?"
| Radiation Type | wR |
|---|---|
| X-rays, gamma rays, beta particles | 1 |
| Protons | 2 |
| Neutrons | 2 to 20 (energy-dependent) |
| Alpha particles, heavy ions | 20 |
Step 3 - Equivalent Dose (HT) - "How Biologically Harmful Was That Dose?"
HT = Absorbed Dose (DT) × Radiation Weighting Factor (wR)
- 1 Gy of X-rays = 1 Sv equivalent dose
- 1 Gy of alpha particles = 20 Sv equivalent dose - 20x more harmful!
Step 4 - Tissue Weighting Factor (wT) - "Which Organ Was Hit?"
| Organ/Tissue | wT |
|---|---|
| Gonads (testes/ovaries) | 0.08 |
| Red bone marrow, colon, lung, stomach, breast | 0.12 each |
| Bladder, esophagus, liver, thyroid | 0.04 each |
| Bone surface, brain, salivary glands, skin | 0.01 each |
| Remainder tissues | 0.12 |
| Total (all tissues sum to) | 1.0 |
Step 5 - Effective Dose (E) - "What Is the Overall Risk to the Whole Body?"
E = Sum of (HT × wT) for all irradiated organs= Sum of (Absorbed Dose × wR × wT)
- Chest X-ray: ~0.1 mSv
- CT abdomen: ~10 mSv
- Annual background radiation (USA): ~6.2 mSv
The Logical Chain (Summary Formula)
Absorbed Dose (Gy)
        ↓  × wR (radiation type factor)
Equivalent Dose (Sv)
        ↓  × wT (tissue sensitivity factor)
Effective Dose (Sv)
Dose Limits
| Group | Annual Dose Limit |
|---|---|
| General public | 1 mSv/year (above natural background) |
| Radiation workers | 20 mSv/year (averaged over 5 years) |
| Radiation workers (single year max) | 50 mSv in any one year |
| Pregnant radiation workers | 1 mSv to the fetus for the remainder of pregnancy |
| Lens of the eye (workers) | 20 mSv/year |
| Skin/extremities (workers) | 500 mSv/year |
Deterministic vs Stochastic Effects (the "Determinants" you asked about)
Deterministic Effects (Tissue Reactions)
- What: Cell killing - enough cells die that the organ fails to function
- Threshold: YES - there is a minimum dose below which NO harm occurs
- Severity: Gets worse as dose increases
- Examples: Hair loss, cataracts, radiation burns, acute radiation syndrome, infertility, fetal malformations
- Memory trick: "Determined to happen" once you cross the threshold - like a cliff edge. Below the line = safe. Above = harm guaranteed and gets worse with more dose.
Stochastic Effects
- What: DNA mutation in a single cell - can trigger cancer or heritable genetic changes
- Threshold: NO threshold - even one photon could (with very low probability) cause cancer
- Severity: Does NOT get worse with dose - cancer is cancer regardless of dose
- Probability: Increases with dose
- Examples: Cancer, heritable mutations in offspring
- Memory trick: "Stochastic = statistics/probability" - like a lottery ticket. More dose = more lottery tickets = higher chance of winning (cancer), but the prize (cancer) is the same size regardless.
Quick-Fire Memory Table
| Concept | Formula | Unit | Simple reminder |
|---|---|---|---|
| Absorbed dose | Energy / mass | Gray (Gy) | Raw physics, no biology |
| Radiation weighting factor (wR) | Fixed per radiation type | Dimensionless | X-ray=1, Alpha=20 |
| Equivalent dose | D × wR | Sievert (Sv) | "How bad was the radiation type?" |
| Tissue weighting factor (wT) | Fixed per organ | Dimensionless | Gonads & marrow most sensitive |
| Effective dose | Sum(D × wR × wT) | Sievert (Sv) | "What is overall cancer risk?" |
| Public dose limit | - | 1 mSv/year | Above background |
| Worker dose limit | - | 20 mSv/year | Averaged over 5 yrs |
| Deterministic | Cell killing, threshold exists | - | Cliff edge |
| Stochastic | Cancer/mutation, no threshold | - | Lottery ticket |
In the shielding of high-energy beta particles, the formation of bremsstrahlung is of significant concern. The intensity of bremsstrah lung rises with the medium’s atomic number and decreases as the particle’s mass increases. As a result, radiation-induced energy loss is more crit ical in heavy elements than in light particles like electrons. means
bremsstrahlung beta particle shielding atomic number explanation simple
Bremsstrahlung and Beta Shielding - Explained Simply
What is Bremsstrahlung? (The Word Itself)
Now Let's Unpack the Statement Piece by Piece
"In the shielding of high-energy beta particles, bremsstrahlung is of significant concern"
"Intensity of bremsstrahlung RISES with the medium's atomic number"
| Shield Material | Atomic Number (Z) | Bremsstrahlung Produced |
|---|---|---|
| Plastic / Lucite / Water | ~6-8 (Carbon, Oxygen) | Very LOW |
| Aluminium | 13 | Low |
| Glass | ~20 | Moderate |
| Lead (Pb) | 82 | Very HIGH |
f ≈ Z × E / 3000(Z = atomic number of shield, E = beta energy in MeV)
"Bremsstrahlung DECREASES as the particle's mass increases"
Bremsstrahlung power ∝ (charge²) / (mass²)
| Particle | Mass (relative to electron) | Bremsstrahlung |
|---|---|---|
| Electron (beta) | 1 | HIGH |
| Proton | ~1,836 | Very low |
| Alpha particle | ~7,300 | Negligible |
"Radiation-induced energy loss is more critical in heavy elements than in light particles like electrons"
- Electron loses energy mostly through ionization and heat - safe, contained
- Very little bremsstrahlung produced
- A bigger fraction of the electron's energy is lost as bremsstrahlung X-rays - penetrating, dangerous
- The electron stops faster, but the X-rays escape through the shield
The Practical Solution: Two-Layer Shielding
[Beta Source] → [Plastic/Lucite - INNER layer] → [Thin Lead - OUTER layer]
- Inner layer = Low Z material (Lucite, plastic, water): Stops the beta particles with minimal bremsstrahlung
- Outer layer = Lead: Absorbs the small amount of low-energy bremsstrahlung that was produced
One-Line Summary to Remember
"Beta into lead = braking radiation (X-rays). Beta into plastic = just heat. Always shield beta with low-Z material first."
what can be the casues of hypoenhancement seen in kidneys where i cannt differentiate the CMD. can this be pyelonephritis? what are changes seen in pyelonephritis show along with images
pyelonephritis CT scan kidney hypoenhancement wedge shaped
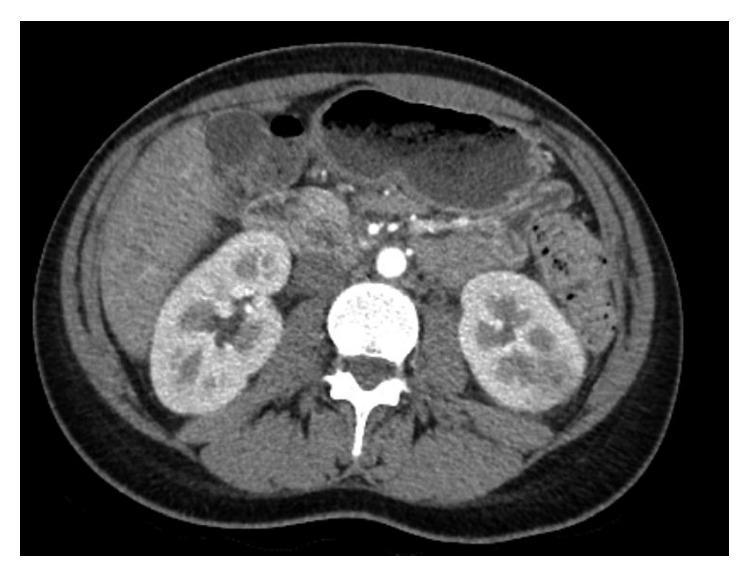
This diagnostic image is an axial slice from a contrast-enhanced computed tomography (CT) scan of the abdomen at the level of the renal hilum. The primary focus is on the bilateral kidneys located on either side of the lumbar spine. The right kidney shows normal parenchymal enhancement. In contrast, the left kidney demonstrates a wedge-shaped, hypoenhancing region localized to the upper pole. This area appears darker (lower attenuation) compared to the surrounding well-perfused renal parenchyma, which is characteristic of reduced blood flow or localized inflammation. The abdominal aorta and major vessels exhibit high density due to the intravascular contrast agent. Other visible structures include the liver, stomach, and bowel loops. Clinically, this focal hypoenhancement in the kidney can be indicative of acute pyelonephritis or a renal infarct. This visual is suitable for medical students and clinicians learning to identify renal pathology through radiological imaging modalities.
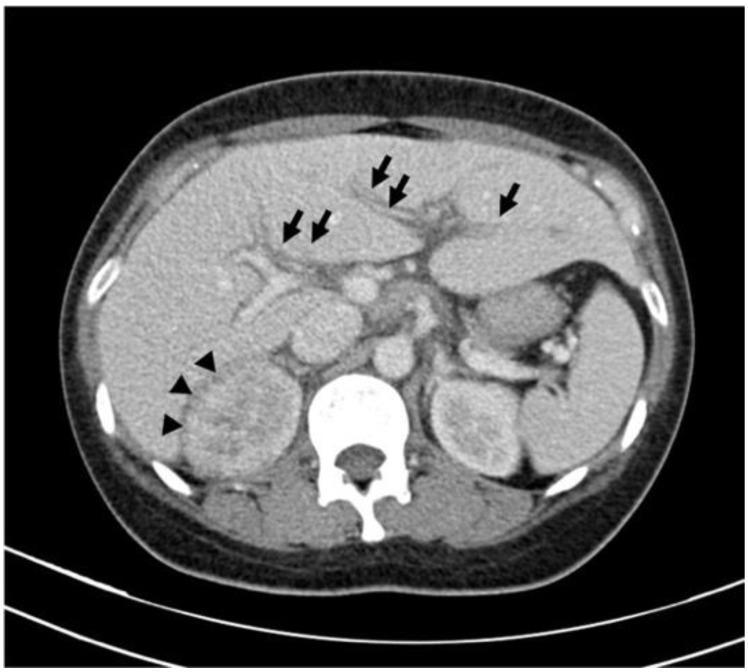
This axial contrast-enhanced CT scan of the abdomen demonstrates characteristic findings of acute pyelonephritis with associated extrarenal manifestations. The right kidney shows compromised corticomedullary differentiation and a distinct, hypoenhanced wedge-shaped lesion (marked by arrowheads), representing focal areas of inflammation or ischemia. In the hepatic region, there is significant reduced attenuation surrounding the intrahepatic portal veins (marked by arrows), which is diagnostic of periportal edema. The image illustrates the radiological presentation of severe urinary tract infection and the potential for systemic inflammatory responses leading to secondary hepatic findings. These markers are used clinically to assess the severity of pyelonephritis and the risk of urosepsis, as periportal edema often correlates with elevated inflammatory markers and prolonged clinical recovery.
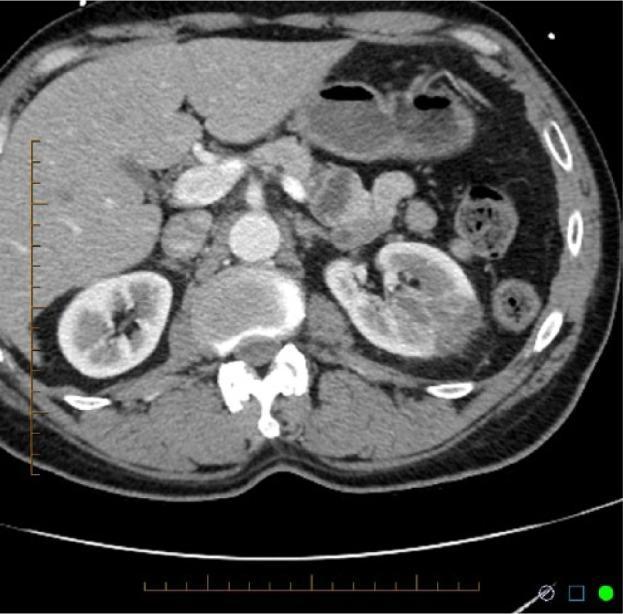
This diagnostic image is an axial contrast-enhanced CT scan of the abdomen at the level of the renal hilum. The primary finding is a well-circumscribed, wedge-shaped area of hypoenhancement in the mid-to-posterior (interpolar) region of the left kidney, characteristic of an acute renal infarction. This non-enhancing defect contrasts sharply with the normally enhancing renal parenchyma of the remaining left kidney and the entirely normal, uniformly enhancing right kidney. Other visible anatomical structures include the liver, which appears homogeneous; the gallbladder; the abdominal aorta and inferior vena cava; and sections of the stomach and bowel. No evidence of significant hydronephrosis or perirenal fat stranding is observed on this slice. The image serves as a classic educational example of the radiological presentation of renal segmental ischemia, highlighting the classic wedge-shaped pattern following the distribution of a segmental renal artery.
This diagnostic image is an axial contrast-enhanced CT scan of the abdomen at the level of the kidneys. The primary finding is located in the left kidney, which demonstrates multiple discrete, wedge-shaped areas of hypoenhancement in the renal parenchyma. These low-density regions extend toward the renal cortex and are classically indicative of acute renal infarction, likely secondary to embolic events. There is associated mild perinephric fat stranding adjacent to the affected areas, suggesting localized inflammatory changes. Other visible anatomical structures include the liver, which appears homogeneous, the stomach with intraluminal air, the abdominal aorta, and the spinal column. The right kidney appears normally enhanced and preserved. This visual content is highly relevant for teaching the radiological presentation of vascular-related renal pathologies and the characteristic 'wedge sign' seen in organ ischemia.
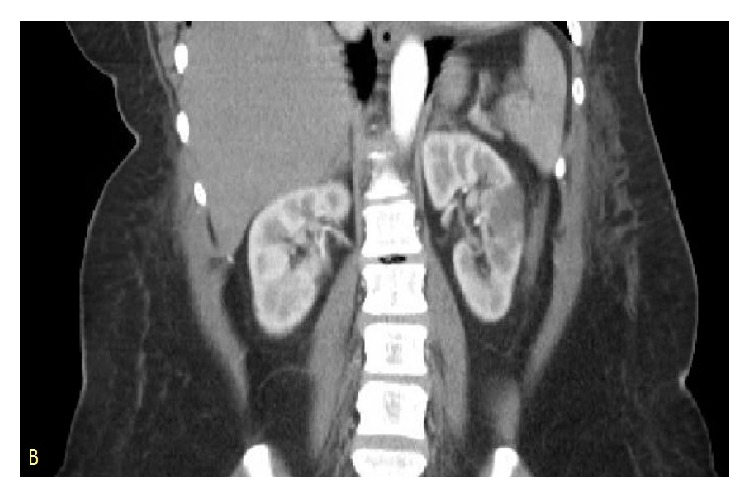
**Imaging Modality:** Contrast-enhanced Computed Tomography (CT). **Anatomical Region:** Abdomen, coronal reformatted view. **Key Landmarks:** Bilateral kidneys, liver, spleen, abdominal aorta, and lumbar spine. **Observed Pathology:** The image demonstrates a localized, wedge-shaped area of hypoenhancement within the renal parenchyma. This focal perfusion defect is situated in the mid-to-lower pole of the right kidney. **Characteristic Visual Features:** * **Morphology:** A well-demarcated, triangular (wedge-shaped) zone of low attenuation with the apex pointing toward the renal hilum and the base at the cortical surface. * **Enhancement Pattern:** Significant lack of contrast uptake compared to the surrounding normally enhancing renal cortex and medulla. * **Surrounding Structures:** The contralateral (left) kidney appears normally enhancing without similar perfusion defects. No gross evidence of perinephric fluid or hemorrhage is visualized in this plane. **Diagnostic Features:** The classic wedge-shaped hypoattenuation is highly characteristic of an acute renal infarct, indicating a localized vascular occlusion and subsequent segmental ischemia. The orientation and sharp margins help differentiate this from pyelonephritis or renal mass lesions.
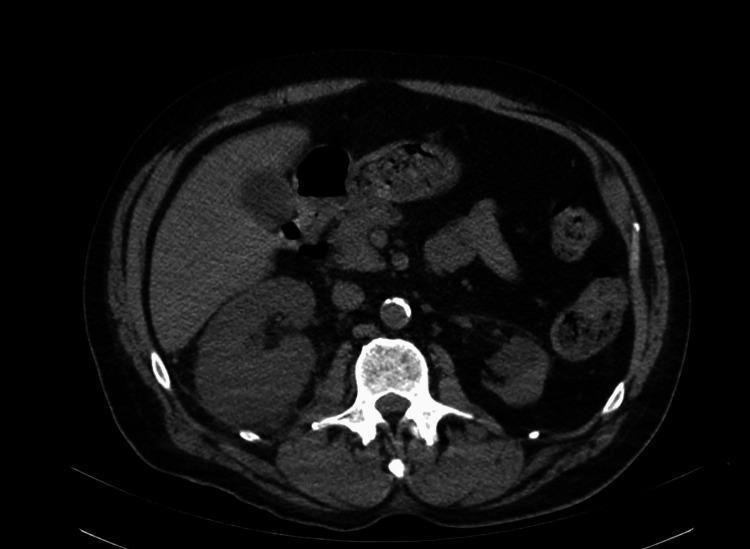
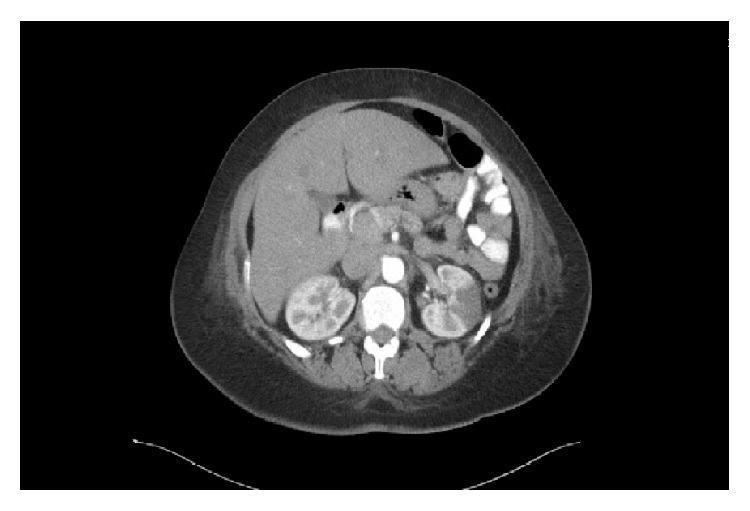
An axial view of a computerized tomography (CT) scan of the abdomen with intravenous contrast, demonstrating diagnostic findings of acute right pyelonephritis. The right kidney is significantly enlarged compared to the left and exhibits a heterogeneous enhancement pattern with prominent hypodense, wedge-shaped areas within the renal parenchyma, suggesting edema or impaired perfusion. The left kidney appears relatively normal in size and enhancement. Other visible structures include the liver in the right upper quadrant, the spleen on the left, and the centrally located lumbar vertebrae. The abdominal aorta is visible anterior to the spine with calcification present in the vessel wall. This diagnostic image is representative of clinical nephrology and radiology, highlighting the classic radiographic appearance of a complicated urinary tract infection leading to renal inflammation.
acute pyelonephritis CT striated nephrogram perinephric fat stranding
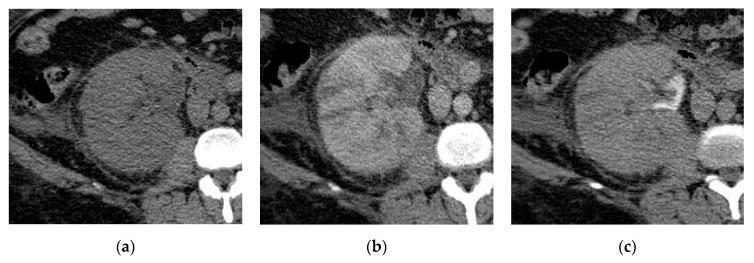
This diagnostic image set consists of three axial CT scans (a, b, and c) of the right kidney, illustrating the radiological presentation of acute pyelonephritis. (a) A non-contrast CT image shows significant renal enlargement with an irregular capsular outline. There is evidence of perinephric inflammation, including thickening of the Gerota fascia and increased density (stranding) in the perinephric fat. (b) An early post-contrast CT image reveals a striated nephrogram pattern, characterized by alternating linear streaks of high and low attenuation extending from the renal papillae to the cortex. This represents impaired or delayed parenchymal enhancement typical of acute infection. (c) A delayed post-contrast CT image demonstrates the persistence of these striated enhancement defects and further highlights the poorly functioning parenchyma. These findings collectively demonstrate the classic CT features used to diagnose acute pyelonephritis and assess for complications like interstitial edema or vasospasm within the renal collecting system.
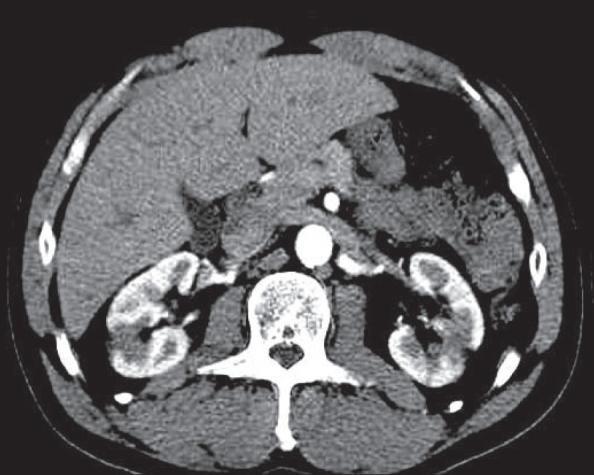
This diagnostic image is an axial contrast-enhanced computerized tomography (CT) scan of the abdomen at the level of the kidneys. The image demonstrates bilateral renal enlargement, characteristic of an inflammatory process. The renal parenchyma exhibits a classic 'striated nephrogram' pattern, defined by alternating linear or streaky areas of decreased attenuation (hypodensities) and normal contrast enhancement. Additionally, there is evidence of minimal perinephric fat stranding, indicating localized inflammation in the surrounding retroperitoneal space. Other visible anatomical structures include the liver, abdominal aorta, and lumbar vertebrae. These visual findings are highly suggestive of acute pyelonephritis. This material is suitable for medical education focusing on uroradiology and the diagnostic features of renal infections.
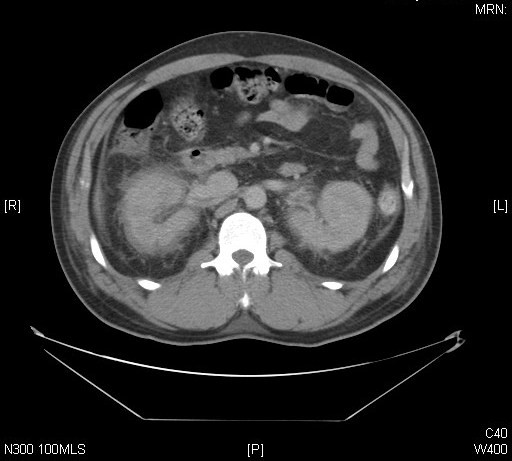
**Imaging Modality:** Axial computed tomography (CT) of the abdomen without oral contrast. **Anatomical Region:** Mid-abdominal section at the level of the kidneys and lumbar spine. **Observed Pathology:** Bilateral renal enlargement with significant perinephric findings. Both kidneys exhibit a striated or heterogeneous enhancement pattern (nephrogram). There is prominent, symmetric thickening of the Gerota’s fascia and extensive perinephric fat stranding. **Characteristic Visual Features:** * **Perinephric Space:** Marked fluid-density infiltration and soft tissue stranding surrounding both kidneys, suggesting an acute inflammatory or infiltrative process. * **Renal Parenchyma:** Bilateral swelling with poorly defined corticomedullary differentiation. * **Associated Findings:** Mild thickening of the lateral conal fascia is noted. No gross hydronephrosis or obstructing calculi are immediately apparent in this single slice. Bowel loops appear unremarkable with normal gas distribution. **Key Diagnostic Cues:** The constellation of bilateral renal swelling, striated nephrogram, and extensive perinephric stranding is highly suggestive of acute bilateral pyelonephritis or an acute systemic inflammatory/vascular condition affecting the renal interstitium. The symmetry of the findings is a critical distinguishing feature for differential diagnosis in renal imaging.
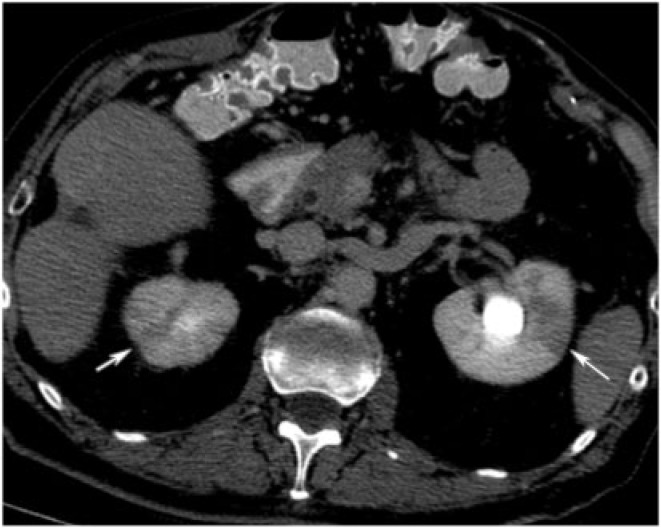
**Modality:** Contrast-enhanced computed tomography (CT) of the abdomen. **Anatomical Region:** Axial section at the level of the kidneys. **Observed Pathology:** Bilateral acute pyelonephritis. **Characteristic Visual Features:** The image demonstrates bilateral, ill-defined, wedge-shaped areas of decreased parenchymal enhancement (hypoattenuation) within the renal cortex of both kidneys (marked by white arrows). These striated or focal low-attenuation zones represent areas of localized edema and reduced perfusion. The left kidney shows more prominent enlargement compared to the right. There is evidence of mild perinephric stranding. An incidental hyperdense structure is noted in the left renal pelvis, consistent with a renal calculus or concentrated contrast in the collecting system. **Clinical Context/Differentiating Features:** The striated nephrogram pattern is a characteristic radiologic sign of acute pyelonephritis. These findings help differentiate inflammatory processes from renal infarction or mass lesions by their distribution across the renal parenchyma and lack of clear borders typical of solid tumors. The presentation is consistent with systemic or ascending urinary tract infection in an immunocompromised or elderly clinical setting.
loss of corticomedullary differentiation kidney causes chronic renal disease diffuse
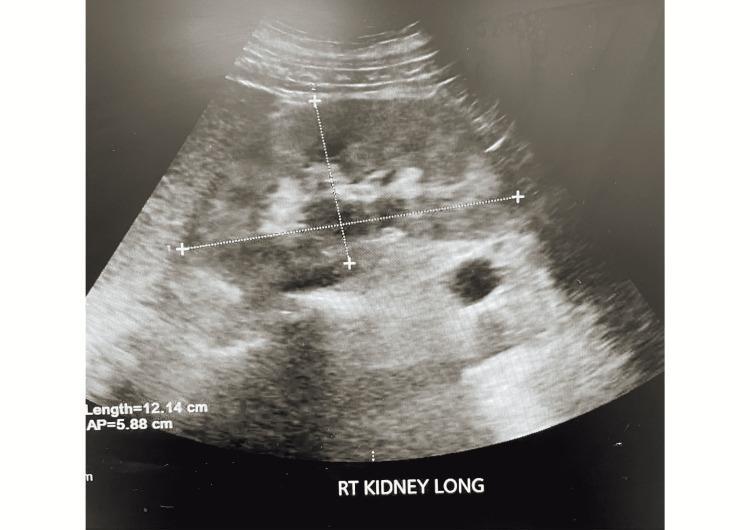
This diagnostic ultrasound image displays a longitudinal view of the right kidney (labeled 'RT KIDNEY LONG'). The renal parenchyma exhibits diffuse, increased echogenicity (hyperechoic appearance), which is a key ultrasonographic sign of parenchymal disease. There is a notable loss of the normal corticomedullary differentiation, as the brightness of the cortex matches or exceeds that of the adjacent liver tissue, often associated with chronic renal disease or acute glomerulonephritis. Two biometry measurements are overlaid on the image: a longitudinal length of 12.14 cm measured pole-to-pole and an anteroposterior (AP) diameter of 5.88 cm taken at the mid-portion. The renal sinus appears relatively echogenic, while the overall morphology suggests underlying pathology such as PR3-ANCA vasculitis or other chronic nephropathies given the clinical context of renal failure and proteinuria. The image serves as an educational example of how ultrasound is used to assess kidney size, echotexture, and structural integrity in a clinical nephrology setting.
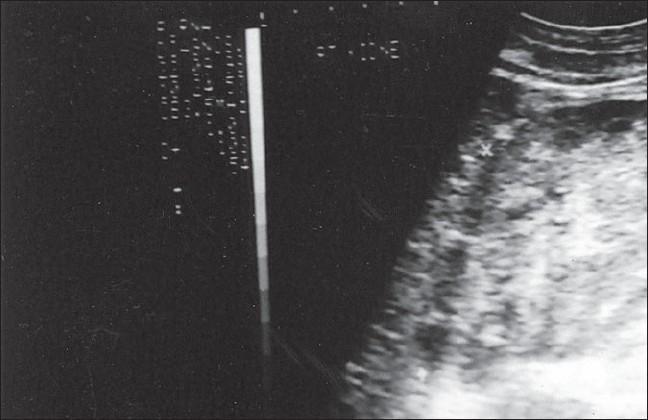
This diagnostic ultrasound image of the abdomen captures a kidney in longitudinal or sagittal view, demonstrating hallmark features of medical renal disease. The kidney is notably enlarged with a significant increase in parenchymal echogenicity (hyperechoic appearance). There is a distinct loss of normal corticomedullary differentiation, where the boundary between the renal cortex and the medullary pyramids is blurred and difficult to resolve. Such findings are characteristic of chronic renal pathologies, including renal amyloidosis or advanced parenchymal disease. The image includes standard sonographic markers, such as a vertical echogenicity scale on the left and subtle anatomical indicators of adjacent soft tissue at the superior aspect. This visual serves as an educational example for radiology and nephrology students to recognize ultrasonographic patterns of diffuse renal parenchymal injury and altered echotexture.
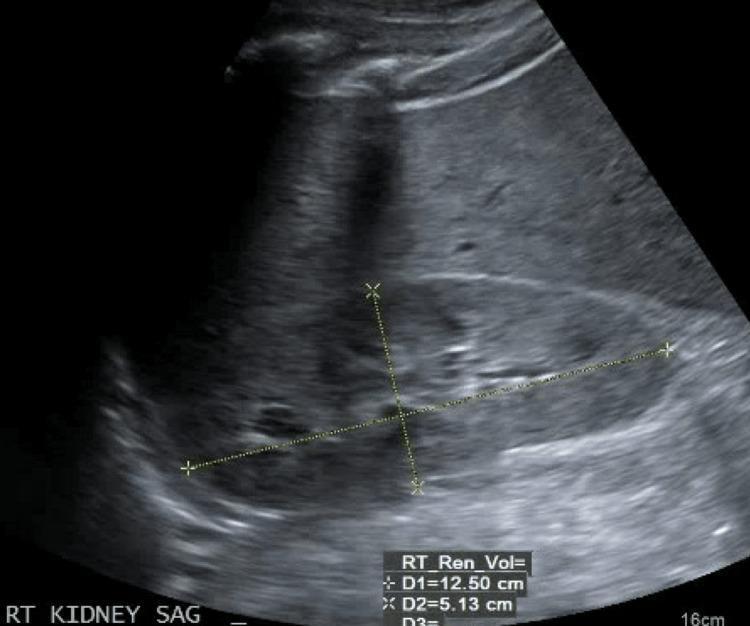
A diagnostic B-mode ultrasound image of the right kidney in a sagittal (longitudinal) plane. The renal parenchyma exhibits diffuse increased echogenicity, appearing hyperechoic relative to the adjacent liver tissue (noted at the top of the field). This loss of normal corticomedullary differentiation and increased brightness are characteristic findings in medical renal disease, such as chronic kidney disease or acute glomerulonephritis. The image includes linear calipers measuring the renal length (D1 = 12.50 cm) and width (D2 = 5.13 cm). Key visible structures include the hyperechoic central renal sinus, the surrounding thickened or hyperechoic renal cortex, and the distinct outer renal capsule. No evidence of hydronephrosis (dilation of the collecting system) is observed. This visual is typical for educational training in nephrology and radiology to identify markers of intrinsic renal parenchymal pathology.
Renal Hypoenhancement with Loss of CMD - Full Radiological Guide
First: What is CMD and why does losing it matter?
- Normal: Cortex enhances brightly in the corticomedullary phase; medulla stays relatively dark. Clear bright outer ring, dark inner zone.
- Lost CMD: The kidney looks uniformly grey/dark - no clear division between cortex and medulla. This is always a sign that something is wrong - either diffuse parenchymal disease or focal perfusion failure.
Part 1 - ALL Causes of Renal Hypoenhancement / Loss of CMD
A. DIFFUSE (whole kidney) loss of CMD
| Cause | Mechanism | Key Features |
|---|---|---|
| Acute pyelonephritis (diffuse) | Interstitial oedema + tubular obstruction + vasospasm | Enlarged kidney, perinephric stranding, fever/UTI |
| Acute tubular necrosis (ATN) | Tubular injury from ischaemia or nephrotoxins | Bilateral, setting of shock/sepsis/contrast |
| Acute glomerulonephritis | Inflammatory glomerular destruction | Proteinuria, haematuria, hypertension |
| Renal vein thrombosis | Outflow obstruction → diffuse oedema | Enlarged swollen kidney, no excretion |
| Global renal infarction | Complete main renal artery occlusion | No enhancement at all, cortical rim sign |
| Lymphoma/diffuse infiltration | Tumour replaces parenchyma uniformly | Bilateral, no discrete mass |
| Amyloidosis / chronic renal disease | Parenchymal replacement by fibrous tissue | Small echogenic kidneys on US, lost CMD |
| Severe dehydration | Low perfusion pressure | Bilateral, reversible, improves with hydration |
B. FOCAL (wedge-shaped or segmental) hypoenhancement
| Cause | Mechanism | Shape | Key Differentiator |
|---|---|---|---|
| Focal acute pyelonephritis | Focal infection + inflammation | Wedge, striated | Fever, UTI, SHOWS SOME enhancement, fat stranding |
| Renal infarction | Arterial occlusion | Wedge, sharp | NO enhancement at all, cortical rim sign, no fat stranding |
| Renal contusion | Trauma | Variable | History of trauma |
| Renal cell carcinoma (necrotic) | Central necrosis | Round/irregular | Mass effect, enhancing rim |
| Renal abscess | Liquefied pus | Round, peripheral | Enhancing wall + central non-enhancement |
The most important differentiator: Pyelonephritis shows some reduced but present enhancement + fat stranding + responds to antibiotics. Infarction shows absolutely no enhancement + no fat stranding + cortical rim sign.
Part 2 - YES, Pyelonephritis CAN cause loss of CMD
Part 3 - Complete CT/MRI/US Changes in Acute Pyelonephritis
On CT (the gold standard - sensitivity 86.8%, specificity 87.5%)
Sign 1 - Wedge-shaped hypoenhancement (striated nephrogram)
- Streaky or wedge-shaped zones of reduced enhancement extending from the renal papilla through the medulla all the way to the renal capsule
- This is the most characteristic sign
- Mechanism: tubular obstruction by inflammatory debris + interstitial oedema + vasospasm → contrast can't reach tubules → dark zones
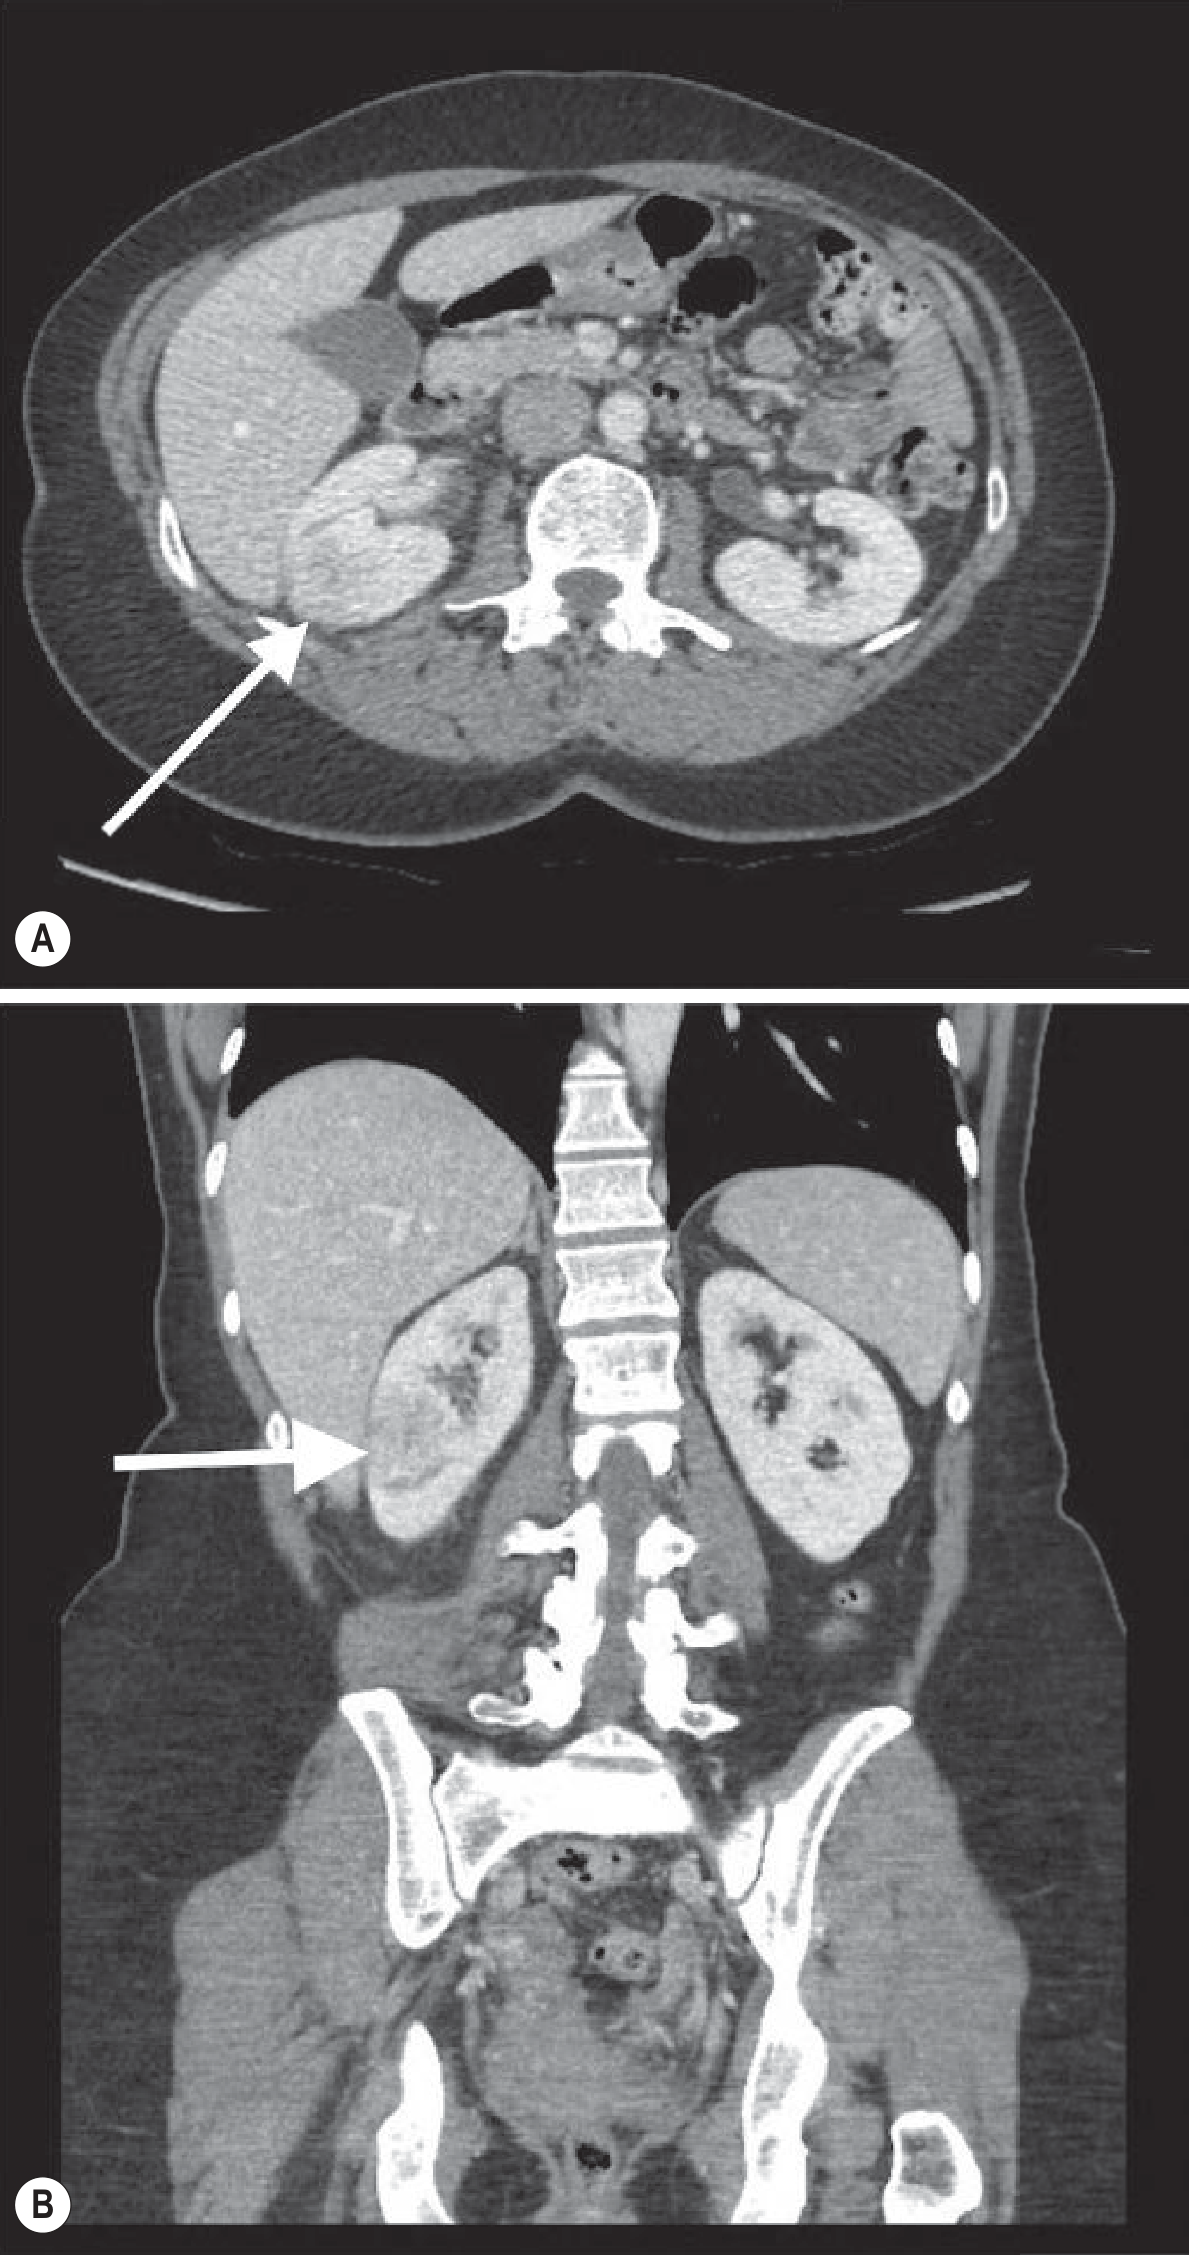
Sign 2 - Enlargement of the kidney
- Focal or diffuse swelling from interstitial oedema and congestion
- Renal length >15 cm or >1.5 cm larger than the unaffected side
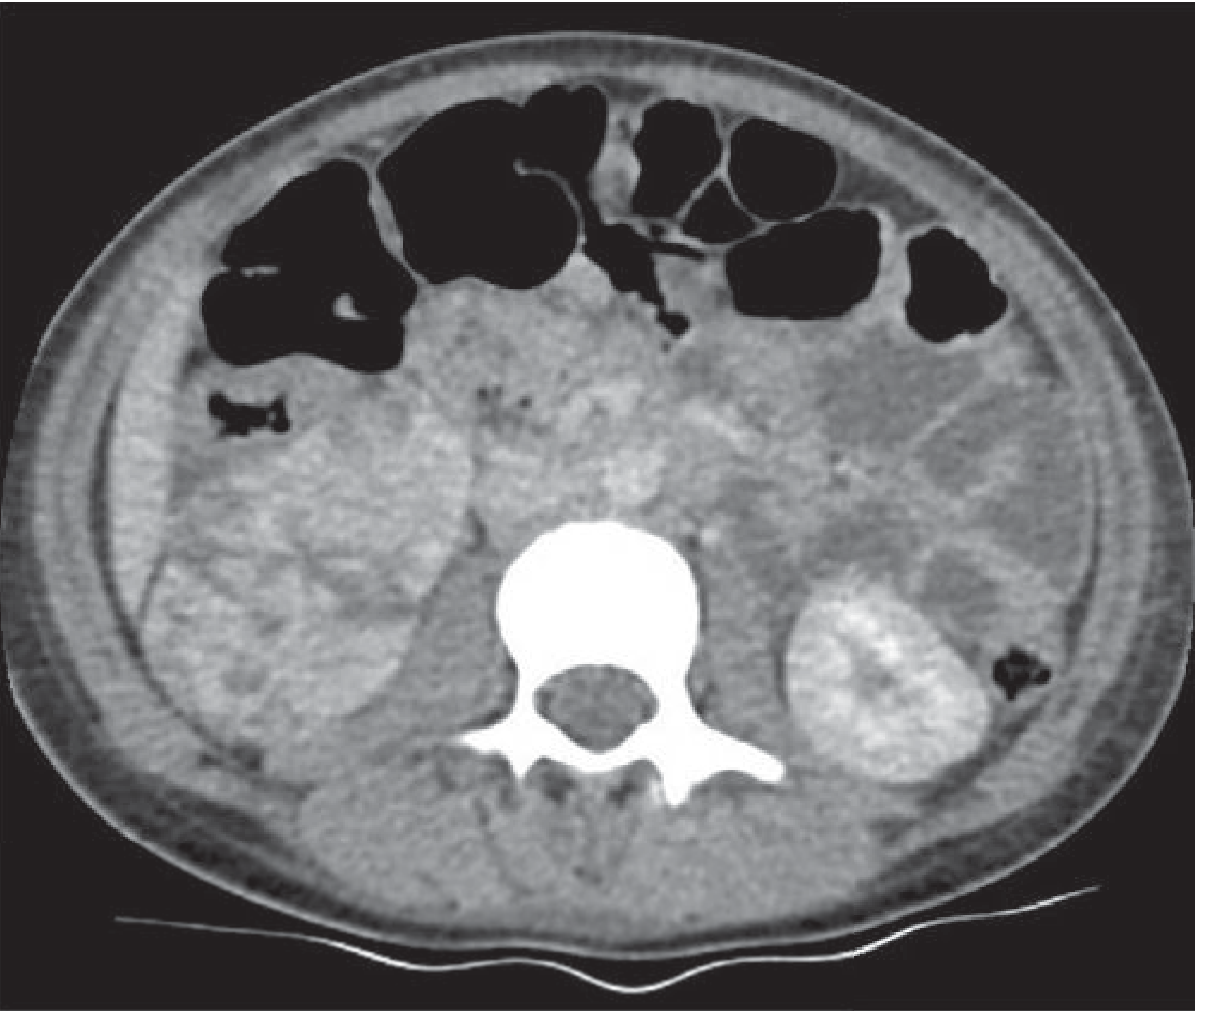
Sign 3 - Striated nephrogram pattern
- Alternating linear streaks of high and low attenuation, parallel to the tubules
- Best seen on delayed phase (3-6 hours post-contrast)
- Caused by alternating columns of functioning vs. non-functioning tubules
Sign 4 - Perinephric fat stranding + Gerota's fascia thickening
- Increased density/haziness in the fat around the kidney
- Thickening of Gerota's fascia (the fascial envelope around the kidney)
- Indicates the inflammatory process has spread beyond the kidney capsule
Sign 5 - Loss of CMD (your question!)
- One or more wedge zones show no corticomedullary differentiation
- The boundary between cortex and medulla is obliterated in infected zones
- This is caused by the same mechanism as the wedge hypoenhancement
Sign 6 - Pelvicalyceal wall thickening
- Thickened, enhancing walls of renal pelvis and proximal ureter
- May be effaced or show mild dilation
- Pelvicalyceal filling defects = sloughed papillae, blood clots, or fungus balls
Sign 7 - Extrarenal manifestations (severe disease / urosepsis)
- Gall bladder wall thickening
- Periportal oedema
- Renal vein or IVC thrombosis
On Ultrasound
| Finding | What it looks like |
|---|---|
| Kidney enlargement | Renal length >15 cm or >1.5 cm asymmetry |
| Loss of CMD | Blurred cortex/medulla boundary |
| Changed echogenicity | Hypoechoic (oedema) OR hyperechoic (haemorrhage) |
| Effaced renal sinus fat | Fat pad around collecting system disappears |
| Hydronephrosis | May indicate underlying obstruction or pyonephrosis |
| Power Doppler | Focal hypoperfusion in affected areas |
On MRI
- T1: Decreased signal in infected areas (relative to normal parenchyma)
- T2: Increased signal in infected areas (oedema = bright on T2)
- Enhancement: Same wedge/striated pattern as CT
- MRI is preferred in pregnancy, contrast allergy, and paediatric patients
Part 4 - Ascending vs. Haematogenous Pyelonephritis: Different Patterns
| Ascending (most common) | Haematogenous (IV drug users, immunocompromised) | |
|---|---|---|
| Route | Bladder → ureter → kidney | Blood → cortex → medulla |
| CT pattern | Wedge-shaped, extends from medulla to capsule | Multiple round cortical foci → becomes confluent |
| Distribution | Lobar/segmental | Peripheral, bilateral, multiple |
Part 5 - Quick Differentiator: Pyelonephritis vs. Renal Infarction
| Feature | Pyelonephritis | Renal Infarction |
|---|---|---|
| Enhancement | Reduced but present | Absent (zero) |
| Cortical rim sign | Absent | Present (thin rim of subcapsular enhancement from capsular vessels) |
| Perinephric fat stranding | Yes | Usually absent |
| Kidney size | Enlarged | Normal or slightly reduced |
| Response to antibiotics | Improves | Does not improve |
| Delayed phase | Persistent enhancement / striated | Still no enhancement |
| Clinically | Fever, dysuria, bacteriuria, flank pain | Sudden flank pain, AF/hypercoagulable state |
when do we see the bremsstrahlung radiation? according to the definition it is charged particles comes closer to the nucleus. here the charged paticle is positron. so my doubt is positron will intereact with surrounidng matter in air or tissue and generate annhilation photons, then how come this radition happens and when does this happen. one more doubt, usually acoording to theory they say that plastic will stop the positrons but in the department mostly lead is only used for shielding so why did they give that plastic can be used beacuse any way positron interacts with electrons and generate photons
Your Two Doubts - Answered in Detail
Doubt 1: "Positrons undergo annihilation, so when does bremsstrahlung actually happen?"
The full story of what happens when a positron enters matter:
Positron emitted
      ↓
Phase 1: SLOWING DOWN (path = few mm to cm)
  - Collides with electrons in the material = ionisation loss
  - Passes near nuclei = BREMSSTRAHLUNG here ←
  - Loses kinetic energy progressively
      ↓
Phase 2: THERMALISATION (positron slows to near-zero kinetic energy)
      ↓
Phase 3: ANNIHILATION (now nearly at rest)
  - Positron + electron → two 511 keV photons
Why doesn't annihilation happen immediately?
- High energy positron: mostly ionisation + bremsstrahlung (annihilation cross-section is low)
- Slowing positron: still bremsstrahlung, increasing annihilation probability
- Near-stationary positron: annihilation dominates → 511 keV pair
So both bremsstrahlung AND 511 keV photons are produced?
- F-18 (max energy 634 keV, used in PET scanning)
- O-15, N-13, C-11 (used in PET)
- Y-86, Rb-82 (higher energy, larger range)
- A spectrum of bremsstrahlung X-rays (during slowing down)
- Two 511 keV annihilation photons (at end of track)
Doubt 2: "If positrons annihilate anyway to give 511 keV photons, why recommend plastic over lead for shielding?"
Layer 1: What actually needs to be shielded?
[Positron Source]
      ↓
[Plastic/Low-Z primary shield]   ← stops the positrons, keeps bremsstrahlung low
      ↓
[Lead secondary shield]          ← stops the 511 keV annihilation photons + any residual bremsstrahlung
Layer 2: Why does it matter WHERE the positron annihilates?
| Scenario | What happens |
|---|---|
| Positron hits lead directly | Travels a short path in Pb (Z=82) → intense bremsstrahlung generated within the lead + 511 keV photons → you get bremsstrahlung + annihilation photons to shield |
| Positron hits plastic first | Travels a longer path in plastic (C,H - low Z) → minimal bremsstrahlung → positron annihilates inside plastic → only 511 keV photons come out → you only need to shield those 511 keV photons with lead |
- Lead produces ~14x more bremsstrahlung than plastic per unit path length
Why do departments use lead anyway?
-
The main hazard is the 511 keV photons - not the positrons themselves. By the time you are thinking about radiation protection for staff handling PET tracers, the 511 keV photons have already escaped the source container. Lead stops those.
-
The positron range is very short - in the syringe or vial, the positrons annihilate inside the liquid itself before even reaching the container wall. Plastic vs lead of the container wall makes little difference for the positrons because they are already gone. The container is shielding the 511 keV photons.
-
Practical compromise: A lead pig (container) for PET syringes is thick enough that even the bremsstrahlung generated within it is attenuated by the lead itself. Lead shielding itself will absorb bremsstrahlung if thick enough - it is only thin lead that is problematic.
Where the plastic rule applies in practice
- Positrons/electrons leave the source and travel several mm in air/tissue
- If they hit a lead shield first → intense bremsstrahlung
- If a plastic barrier intercepts them first → they annihilate/stop in plastic → only then does lead behind it handle the photons
- Y-90 microsphere therapy (high-energy beta, 2.27 MeV max): plastic primary shield is explicitly recommended
- P-32 skin patches: plastic/acrylic holder recommended
- Sr-90 eye applicator handling: plastic forceps, not metal
Summary Table
| Question | Answer |
|---|---|
| When does bremsstrahlung occur? | During the slowing-down phase, before annihilation |
| When does annihilation occur? | After the positron has lost nearly all kinetic energy |
| Are both produced? | Yes - bremsstrahlung spectrum + 511 keV pair |
| Why plastic over lead? | Plastic generates ~14x less bremsstrahlung; lead generates intense X-rays during stopping |
| Why do departments use lead? | For PET sources, positrons annihilate inside the liquid; lead shields the 511 keV photons that matter |
| Correct approach for bare high-energy beta? | Plastic inner layer (stops particles, minimal bremsstrahlung) + lead outer layer (stops annihilation photons + residual bremsstrahlung) |
i have a doubt when comes to nuclear medicine in pet imaging, there are different tracers and different sentivity and specificty for each cancers how to memorise al these things and most of them are in the same range.
PET tracer FDG sensitivity specificity different cancers memorization guide nuclear medicine
How to Actually Remember PET Tracers and Their Performance
The Core Strategy: Stop Memorizing Numbers, Start Understanding Logic
"Does this cancer type have high glucose metabolism?"
Part 1 - Understanding FDG First (the master tracer)
The Two Key Variables That Control FDG Performance
| Variable | High FDG uptake | Low FDG uptake |
|---|---|---|
| Cell proliferation rate | Fast growing tumours | Slow growing / indolent tumours |
| Histological type | Adenocarcinoma, squamous cell, high-grade | Mucinous, clear cell, well-differentiated, neuroendocrine |
Part 2 - The Master Classification (Logic-Based)
Group A - FDG EXCELLENT (sensitivity AND specificity both >85%)
| Cancer | Typical Sensitivity | Why FDG works |
|---|---|---|
| Lung (NSCLC) | 88-97% | High metabolic rate, glucose avid |
| Esophageal cancer | 90-95% | Highly proliferative |
| Head & Neck (SCC) | 90-95% | Squamous cell = glucose avid |
| Colorectal cancer (recurrence) | 89-95% | High GLUT expression |
| Lymphoma (aggressive - DLBCL) | 90-98% | Rapidly dividing B-cells |
| Melanoma (metastatic) | 90-97% | High metabolic rate |
| Breast (distant metastases) | ~97% | High-grade lesions especially |
Group B - FDG MODERATE (sensitivity 70-85%)
| Cancer | Sensitivity | The ONE reason it's not excellent |
|---|---|---|
| Bladder cancer | ~80% | Urinary FDG excretion masks the tumour (urine lights up too) |
| Renal cell carcinoma | ~74% | Clear cell type has LOW glucose metabolism |
| Breast (locoregional) | ~79-89% | Lobular subtype is FDG-negative; lesion size matters |
| Lung nodules <1 cm | Lower | Too small for PET resolution (~4-5 mm limit) |
| Testicular (seminoma staging) | Variable | Post-chemo → false negatives from granulomatous tissue |
- Bladder = urine interference
- Kidney = clear cell = no glucose uptake
- Breast lobular = FDG-negative subtype
Group C - FDG POOR (sensitivity <70%) - The Exceptions You Must Know
| Cancer | Why FDG fails | What to use instead |
|---|---|---|
| Prostate cancer | Very low glucose metabolism, slow growing | Ga-68 PSMA or F-18 PSMA |
| Well-differentiated NETs (carcinoid, gastrinoma) | Low proliferation index (Ki-67 <2%) | Ga-68 DOTATATE (somatostatin receptor) |
| Hepatocellular carcinoma | Contains glucose-6-phosphatase → dephosphorylates FDG, it washes out | C-11 acetate or F-18 choline |
| Gastric cancer (mucinous/signet ring) | Mucinous components are not glycolytic | Limited usefulness, MRI preferred |
| Thyroid (well-differentiated) | Indolent, low metabolism | I-131 whole body scan |
| Low-grade lymphoma (marginal zone) | Indolent B-cells, low turnover | Clinical staging + CT |
- Prostate → no glucose → PSMA
- NETs (low grade) → no glucose → DOTATATE (somatostatin)
- HCC → washes out → acetate/choline
- Thyroid (differentiated) → iodine avid → I-131
- Low-grade lymphoma → indolent → CT staging
Part 3 - The Alternative Tracers (Mechanism = Memory)
Ga-68 PSMA (Prostate-Specific Membrane Antigen)
- Mechanism: PSMA is overexpressed on prostate cancer cells (and paradoxically on the neovasculature of many other cancers too)
- Use: Prostate cancer staging, recurrence detection (even at PSA <0.5 ng/mL)
- Key numbers: Sensitivity ~80-85% for recurrence, specificity ~97%
- Advantage over FDG: Detects disease at much lower PSA levels than CT or bone scan
Ga-68 DOTATATE / DOTATOC (Somatostatin Analogues)
- Mechanism: Radiolabelled somatostatin analogue → binds somatostatin receptors (SSTR2) → overexpressed on neuroendocrine cells
- Use: All well-differentiated NETs (carcinoid, pancreatic NET, paraganglioma, pheochromocytoma)
- Key numbers: Sensitivity 93-96%, specificity ~85-99% - far superior to FDG and CT
- Rule: If Ki-67 <20% (well-differentiated) → DOTATATE. If Ki-67 >20% (poorly-differentiated) → switch back to FDG (now glucose avid)
F-18 Choline / C-11 Choline
- Mechanism: Choline is incorporated into cell membrane phospholipids → high uptake in rapidly dividing cells
- Use: Prostate, HCC, brain tumours (near glucose-avid background brain)
- Limitation: C-11 has a 20-minute half-life → must have on-site cyclotron
F-18 NaF (Sodium Fluoride)
- Mechanism: Fluoride deposits in hydroxyapatite of bone → bone scan with PET resolution
- Use: Bone metastases (better sensitivity than Tc-99m bone scan)
F-18 FLT (Fluorothymidine)
- Mechanism: Thymidine analogue → incorporated during DNA synthesis → measures proliferation directly
- Use: Tumours where FDG has background interference (brain, after treatment assessment)
I-124 (Iodine PET)
- Mechanism: Iodine metabolism in thyroid follicular cells
- Use: Differentiated thyroid cancer dosimetry planning before I-131 therapy
Part 4 - The Clinical Scenarios That Stick
| Situation | Best tracer | Why |
|---|---|---|
| Solitary pulmonary nodule characterisation | FDG | Malignant nodules are glucose avid; negative FDG has high NPV |
| Lymphoma staging (aggressive) | FDG | Glucose avid; response assessment after chemo |
| Lymphoma (indolent - marginal zone) | CT better | Low FDG avidity |
| Prostate cancer biochemical recurrence | Ga-68 PSMA | Detects disease even at PSA 0.2-0.5 ng/mL |
| Carcinoid / pancreatic NET | Ga-68 DOTATATE | SSTR2 overexpression |
| Phaeochromocytoma / paraganglioma | Ga-68 DOTATATE or F-18 DOPA | Catecholamine pathway |
| High-grade NET (Ki-67 >20%) | FDG | Now de-differentiated, becomes glucose avid |
| Post-treatment response assessment | FDG | Metabolic response precedes anatomical response |
| Fever of unknown origin / infection | FDG | Activated inflammatory cells also take up glucose |
| HCC | C-11 acetate or Ga-68 PSMA | Glucose-6-phosphatase washes FDG out |
Part 5 - The Numbers Framework (For Exams)
| Tier | Range | Examples |
|---|---|---|
| Excellent | Sn >90%, Sp >90% | Lung NSCLC, esophageal, H&N SCC, aggressive lymphoma, melanoma, colorectal recurrence |
| Good | Sn 75-90%, Sp 80-90% | Breast, bladder, renal (post-surgery), NSCLC nodal staging |
| Poor - use another tracer | Sn <70% | Prostate, low-grade NETs, HCC primary, well-differentiated thyroid, low-grade lymphoma |
Part 6 - False Positives and False Negatives (Why Specificity Drops)
- Active infections (TB granuloma, sarcoid, abscess)
- Post-surgical/post-radiation inflammation
- Physiological uptake: brain, heart, kidneys (urine), bowel
- Brown fat activation (neck/supraclavicular in cold weather)
- Healing fractures, recent biopsy sites
- Hyperglycaemia (patient not fasting properly → competitive glucose inhibits FDG uptake)
- Small lesions <5-8 mm (below PET resolution)
- Mucinous/signet ring histology
- Well-differentiated / low-grade tumours
- Post-chemotherapy (temporary metabolic suppression → wait 4-6 weeks)
Part 7 - One-Page Cheat Sheet
FDG WORKS → Fast, aggressive, solid, glycolytic
FDG FAILS → PHTL (mnemonic: Pretty Hard To Localise)
  P = Prostate       → use PSMA
  H = HCC            → use Acetate/Choline
  T = Thyroid (diff) → use I-131
  L = Low-grade NETs → use DOTATATE
  L = Low-grade lymphoma → use CT

Bladder = moderate (urine artifact)
Kidney (clear cell) = moderate (no glycolysis)
High glucose/fasting essential → hyperglycaemia causes false negatives

DOTATATE rule: Ki-67 <20% → DOTATATE; Ki-67 >20% → switch to FDG
Create a PET tracer decision tree flowchartst and 2nd choice
A detailed clinical decision tree flowchart titled "PET Tracer Selection - 1st and 2nd Choice" for nuclear medicine. The flowchart starts at the top with "Suspected or Known Cancer - Which PET Tracer?" and branches into two main paths: "Is the cancer GLUCOSE AVID (high metabolic rate)?" YES or NO. YES branch leads to FDG (F-18 FDG) as 1st choice, then lists cancers: Lung NSCLC, Esophageal, Head and Neck SCC, Colorectal (recurrence), Lymphoma (aggressive DLBCL), Melanoma, Breast (distant mets), with sensitivity 88-97%. Under YES branch also shows 2nd choice alternatives: F-18 FLT for post-treatment assessment, NaF-18 for bone mets. NO branch splits into 5 sub-branches: 1. PROSTATE CANCER → 1st: Ga-68 PSMA, 2nd: F-18 PSMA or F-18 Choline 2. NEUROENDOCRINE TUMOR (NET) → Check Ki-67: if less than 20% → 1st: Ga-68 DOTATATE, 2nd: Ga-68 DOTATOC; if greater than 20% → 1st: FDG (now glucose avid) 3. HEPATOCELLULAR CARCINOMA (HCC) → 1st: C-11 Acetate or F-18 Choline, 2nd: Ga-68 PSMA 4. DIFFERENTIATED THYROID CANCER → 1st: I-131 Whole Body Scan, 2nd: I-124 PET for dosimetry 5. PHEOCHROMOCYTOMA / PARAGANGLIOMA → 1st: Ga-68 DOTATATE, 2nd: F-18 FDOPA Bottom section shows a red warning box: "FDG PITFALLS - False Positives: infection, sarcoid, brown fat. False Negatives: hyperglycemia, lesions less than 5mm, mucinous histology, post-chemo within 4-6 weeks" Color coding: FDG boxes in blue, PSMA in green, DOTATATE in orange, special tracers in purple. Professional medical infographic style with clean arrows and clear hierarchy.
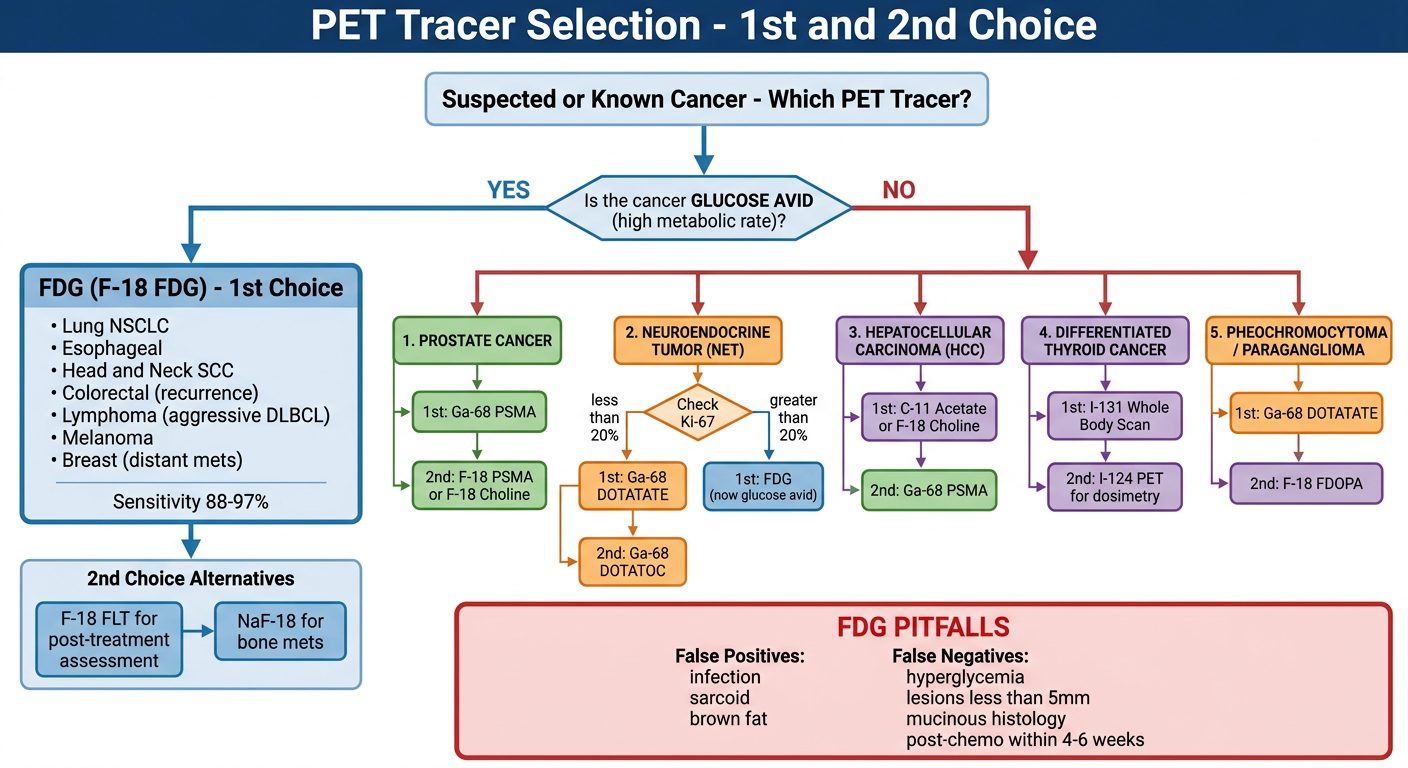
Decision Logic at a Glance
| Answer | 1st Choice | 2nd Choice |
|---|---|---|
| YES - most solid tumours | F-18 FDG | F-18 FLT (post-treatment), NaF-18 (bone mets) |
| NO - Prostate | Ga-68 PSMA | F-18 PSMA or F-18 Choline |
| NO - NET (Ki-67 <20%) | Ga-68 DOTATATE | Ga-68 DOTATOC |
| NO - NET (Ki-67 >20%) | F-18 FDG (now aggressive) | Ga-68 DOTATATE less reliable |
| NO - HCC | C-11 Acetate / F-18 Choline | Ga-68 PSMA |
| NO - Differentiated Thyroid | I-131 WBS | I-124 PET (for dosimetry) |
| NO - Pheo / Paraganglioma | Ga-68 DOTATATE | F-18 FDOPA |
The ONE rule that replaces all memorization:
Ki-67 >20% (poorly diff NET) → switch to FDG Everything else: match the tracer to the tumour's molecular target, not to glucose.
DOTATATE AND DOPA tracers which cancers these tracers are used and in these cancers if these two tracers are not available which alternative can be used
Ga-68 DOTATATE FDOPA PET tracers indications alternatives MIBG somatostatin receptor imaging neuroendocrine
FDOPA PET alternatives MIBG scintigraphy pheo paraganglioma carcinoid when DOTATATE not available
DOTATATE and DOPA Tracers - Complete Guide with Alternatives
Understanding WHY These Tracers Exist (The Logic First)
| Tracer | Mechanism | What it detects |
|---|---|---|
| Ga-68 DOTATATE | Binds somatostatin receptors (SSTR2) on cell surface | Somatostatin receptor expression |
| F-18 FDOPA | Enters via amino acid transporter → decarboxylated and stored inside cell | DOPA decarboxylase activity + catecholamine synthesis pathway |
TRACER 1: Ga-68 DOTATATE (NETSPOT)
Mechanism
Cancers Where DOTATATE is 1st Choice
| Cancer | Sensitivity | Why DOTATATE works |
|---|---|---|
| GI Carcinoids (midgut: ileum, appendix) | 90-96% | Highest SSTR2 expression of all NETs |
| Pancreatic NETs (gastrinoma, VIPoma, glucagonoma, non-functioning) | 85-95% | High SSTR2 expression |
| Gastrinoma (Zollinger-Ellison) | ~90% | SSTR2 strongly expressed; replaces OctreoScan |
| Bronchial carcinoid | 85-93% | Pulmonary NETs express SSTR2 |
| Pheochromocytoma (sporadic) | 75-85% | Moderate-high SSTR2 |
| Paraganglioma | 85-95% | High SSTR2, especially head & neck paraganglioma |
| Meningioma | 85-90% | SSTR2 overexpressed (emerging use) |
| Sarcoidosis | Emerging | Activated granulomatous cells express SSTR2 |
Key rule: Ki-67 <20% (well-differentiated) → DOTATATE works beautifully. Ki-67 >20% (poorly differentiated) → tumour loses SSTR2 expression → DOTATATE fails → switch to FDG.
Special strength of DOTATATE
- Superior to OctreoScan (In-111 octreotide SPECT) in detecting lesions - more lesions detected in bone, liver, and viscera
- Also used for PRRT patient selection (Peptide Receptor Radionuclide Therapy with Lu-177 DOTATATE) - you must confirm SSTR expression before therapy
If DOTATATE is NOT Available - Alternatives in Order
| Alternative | How it works | How good? |
|---|---|---|
| 1st alt: In-111 OctreoScan (Octreotide SPECT) | Same somatostatin receptor targeting but with SPECT not PET; lower resolution | Sensitivity ~60-80%; still useful, widely available, older technology |
| 2nd alt: Ga-68 DOTATOC or Ga-68 DOTANOC | Same Ga-68 PET but different somatostatin peptide; DOTATOC has slightly different SSTR affinity | Nearly equivalent to DOTATATE; DOTANOC binds SSTR2+3+5 |
| 3rd alt: F-18 FDOPA | Different mechanism (see below); works for pheo/paraganglioma and carcinoid | Inferior for pancreatic NETs, good for midgut carcinoids |
| 4th alt: F-18 FDG | Only if Ki-67 >20% (high-grade NET) | Useless for well-differentiated NETs |
| 5th alt: Tc-99m Octreotide SPECT | Low-resolution somatostatin scan | Least sensitive; last resort |
| Last resort: CT/MRI + clinical | Anatomical imaging only | Misses small/occult lesions |
TRACER 2: F-18 FDOPA (Fluorodihydroxyphenylalanine)
Mechanism
Cancers Where FDOPA is 1st or Strong 2nd Choice
| Cancer | FDOPA role | Sensitivity | Notes |
|---|---|---|---|
| Pheochromocytoma (sporadic/non-hereditary) | 1st or co-equal choice | 76-90% | Especially for sporadic, non-metastatic pheo |
| Paraganglioma (head & neck) | Strong 2nd choice | 80-92% | Head & neck PGLs have low MIBG avidity; FDOPA excellent here |
| Midgut carcinoids (ileum, appendix) | 2nd choice after DOTATATE | 85-95% | Very high DOPA decarboxylase activity in midgut cells |
| Hereditary pheo (MEN2, VHL, NF1) | 2nd choice | Variable | DOTATATE may be better for VHL/SDHx mutations |
| Insulinoma | Emerging niche | ~80% | After carbidopa premedication; when GLP-1 receptor imaging unavailable |
| Medullary thyroid cancer | 2nd choice | 63-78% | Calcitonin-secreting C-cells share amino acid transport |
| DOPA-secreting neoplasms | Direct indication | High | Follows catecholamine pathway directly |
FDOPA vs DOTATATE in Pheo/Paraganglioma - The Critical Comparison
| Mutation/Type | Best tracer | Why |
|---|---|---|
| Sporadic pheo | FDOPA ≥ DOTATATE | High DOPA decarboxylase activity |
| Head & neck paraganglioma | FDOPA ≈ DOTATATE | Both good; FDOPA especially useful |
| VHL mutation pheo | DOTATATE > FDOPA | High SSTR2; lower catecholamine activity |
| SDHx mutation (SDHB) | FDG > both | Highly aggressive, poorly differentiated; loses SSTR2 and DOPA pathway |
| NF1 mutation pheo | FDOPA | High catecholamine synthesis |
| MEN2 pheo | FDOPA | High catecholamine activity |
| Metastatic pheo (aggressive) | FDG | Now glucose-avid; both FDOPA and DOTATATE may miss lesions |
Key rule: SDHB mutation = aggressive = use FDG. All others = use FDOPA or DOTATATE depending on availability.
If FDOPA is NOT Available - Alternatives in Order
| Alternative | Notes |
|---|---|
| 1st alt: Ga-68 DOTATATE | Best overall alternative; superior for paraganglioma and most NETs |
| 2nd alt: I-123 MIBG SPECT | Classic workhorse; sensitivity 77-90% for pheo; also guides I-131 MIBG therapy decision |
| 3rd alt: I-131 MIBG scan | Lower image quality than I-123 but available in more centres; mainly therapeutic |
| 4th alt: F-18 Fluorodopamine PET | Same pathway as FDOPA; not widely available |
| 5th alt: F-18 FDG | Only if metastatic/aggressive (SDHB mutation) |
| Last resort: CT/MRI adrenals | Anatomical only; misses multifocal/metastatic disease |
Master Comparison Table
| Tumour | 1st Choice | 2nd Choice | 3rd Choice (if both unavailable) |
|---|---|---|---|
| Midgut carcinoid | Ga-68 DOTATATE | F-18 FDOPA | In-111 OctreoScan |
| Pancreatic NET (gastrinoma, etc.) | Ga-68 DOTATATE | In-111 OctreoScan | F-18 FDG (if Ki-67 >20%) |
| Sporadic pheo | Ga-68 DOTATATE or F-18 FDOPA | I-123 MIBG | F-18 FDG |
| Head & neck paraganglioma | Ga-68 DOTATATE | F-18 FDOPA | I-123 MIBG |
| SDHB-mutant pheo/PGL | F-18 FDG | Ga-68 DOTATATE | F-18 FDOPA |
| Bronchial carcinoid | Ga-68 DOTATATE | In-111 OctreoScan | F-18 FDG |
| Medullary thyroid cancer | F-18 FDOPA | F-18 FDG | Ga-68 DOTATATE |
| High-grade NET (Ki-67 >20%) | F-18 FDG | Ga-68 DOTATATE (partial) | CT/MRI |
| Insulinoma | GLP-1R PET (Exendin) or F-18 FDOPA | Ga-68 DOTATATE | EUS |
The One-Paragraph Summary to Remember
DOTATATE targets somatostatin receptors on the cell surface - it works for ALL well-differentiated NETs (carcinoids, pancreatic NETs, paragangliomas). When not available, use OctreoScan (same target, lower quality) or FDOPA.FDOPA maps the catecholamine synthesis pathway inside the cell - it works best for pheo, paraganglioma, and midgut carcinoids. When not available, use DOTATATE or I-123 MIBG.For SDHB-mutant or metastatic aggressive disease, both fail - use FDG. For medullary thyroid cancer - FDOPA is the specific choice; DOTATATE is weak here.