Explain me 10 most common heart disease with ecg changes from scratch
Reading File
Finding Sources
Finding Sources
Finding Sources
Reading File
Reading File
Reading File
Finding Sources
Finding Sources
Finding Sources
Finding Sources
Finding Sources
Finding Sources
Searching Images
ECG changes myocardial infarction STEMI ST elevation leads
Reading File
Reading File
Searching Images
atrial fibrillation ECG no P waves irregularly irregular rhythm
Searching Images
pericarditis ECG diffuse ST elevation PR depression saddle shape
Searching Images
pulmonary embolism ECG S1Q3T3 right bundle branch block sinus tachycardia
Searching Images
hypertrophic cardiomyopathy ECG LVH deep narrow Q waves
Searching Images
ventricular tachycardia ECG wide complex AV dissociation
Searching Images
heart failure left ventricular hypertrophy ECG strain pattern ST depression T wave inversion
Searching Images
complete heart block third degree AV block ECG P waves dissociated QRS
I now have all the textbook content and ECG images I need to write a comprehensive answer. Let me compile it now.
10 Most Common Heart Diseases with ECG Changes — From Scratch
ECG Basics First
The 12-lead ECG records the heart's electrical activity from different angles. Key components:
| Waveform | What it represents |
|---|---|
| P wave | Atrial depolarization |
| PR interval | AV conduction time (normal: 120–200 ms) |
| QRS complex | Ventricular depolarization (normal: <120 ms) |
| ST segment | Early ventricular repolarization (should be isoelectric) |
| T wave | Ventricular repolarization |
| QT interval | Total ventricular electrical activity |
1. ST-Elevation Myocardial Infarction (STEMI)
What it is: Complete occlusion of a coronary artery → transmural (full-thickness) myocardial necrosis.
Why the ECG changes: Three simultaneous processes occur in infarcted cells: (1) rapid repolarization, (2) decreased resting membrane potential from K⁺ loss, and (3) delayed depolarization. All three cause current flow out of the infarcted zone, producing ST elevation in overlying leads. "The hallmark of acute myocardial infarction is elevation of the ST segments in the leads overlying the area of infarction." — Ganong's Review of Medical Physiology
ECG changes (by stage):
| Phase | Findings |
|---|---|
| Hyperacute (minutes) | Tall, broad, peaked "hyperacute" T waves |
| Acute (hours) | ST elevation (convex/tombstone shape), reciprocal ST depression in opposite leads |
| Evolving (days) | ST normalises, pathological Q waves develop, T-wave inversions |
| Chronic (weeks–months) | Persistent Q waves, T waves may normalise |
Lead localisation:
| Territory | Occluded artery | Leads with ST elevation |
|---|---|---|
| Anterior | LAD | V1–V6, I, aVL |
| Inferior | RCA (or LCx) | II, III, aVF |
| Lateral | LCx | I, aVL, V5–V6 |
| Posterior | RCA/LCx | Reciprocal ST depression in V1–V3; tall R in V1 |
| Right ventricular | Proximal RCA | V1, V4R |
As Harrison's notes: "Posterior wall ischemia may be indirectly recognized by reciprocal ST depressions in leads V1 to V3."

12-lead ECG: Acute anterolateral STEMI. Convex ST elevation V1–V6 and leads I, aVL; reciprocal ST depression in II, III, aVF. Classic LAD occlusion.
2. Non-ST-Elevation Myocardial Infarction / Unstable Angina (NSTEMI/UA)
What it is: Partial occlusion or subtotal stenosis → subendocardial ischemia (inner layer most vulnerable). No full-thickness necrosis in NSTEMI; no myocyte death in UA.
Why the ECG changes: Subendocardial ischemia directs the ST vector toward the cavity of the ventricle, so overlying leads show ST depression rather than elevation.
ECG changes:
- ST depression ≥0.5 mm in ≥2 contiguous leads (horizontal or downsloping — worse prognosis)
- T-wave inversions — symmetric deep inversions in V1–V4 with preserved R waves = Wellens' syndrome (critical LAD stenosis!)
- May also be normal or show only non-specific ST-T changes
- No pathological Q waves (distinguishes from STEMI evolution)
"Patients with ischemic chest pain who present with deep T-wave inversions in multiple precordial leads (V1–V4…) typically have severe obstruction in the left anterior descending coronary artery." — Harrison's 22e
3. Atrial Fibrillation (AF)
What it is: Chaotic, disorganized atrial electrical activity at 350–600 impulses/min. AV node acts as a "gatekeeper," producing an irregularly irregular ventricular response.
Why the ECG changes: Hundreds of re-entrant wavelets cancel each other out electrically; no organised atrial depolarisation → no P waves. Impulses reach the AV node randomly → irregular QRS timing.
ECG changes:
- Absent P waves — replaced by chaotic "f" (fibrillation) waves at 350–600/min (best seen in V1, II)
- Irregularly irregular RR intervals — the defining feature
- Normal, narrow QRS (unless aberrant conduction or pre-excitation)
- Ventricular rate: uncontrolled ~100–160 bpm; controlled <100 bpm
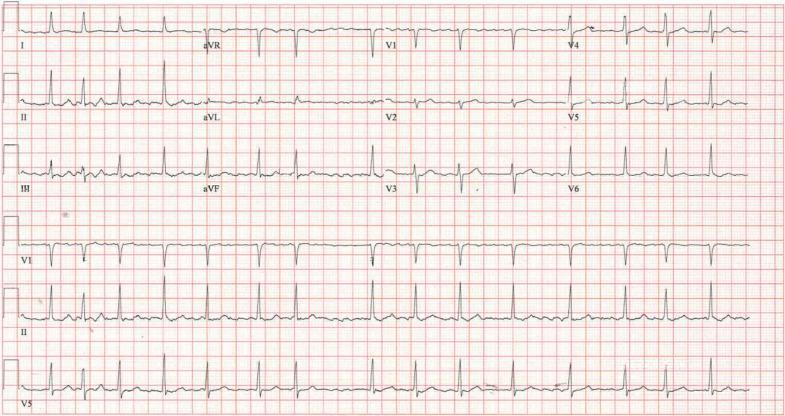
Atrial fibrillation: No organised P waves, fine fibrillatory baseline (best in V1), irregularly irregular QRS complexes with narrow morphology.
4. Heart Failure with Left Ventricular Hypertrophy (LVH) — Hypertensive Heart Disease
What it is: Chronic pressure overload (hypertension, aortic stenosis) → concentric LV hypertrophy → diastolic/systolic dysfunction. ECG reflects the enlarged ventricular muscle mass.
ECG changes:
- High QRS voltage (Sokolow-Lyon: S in V1 + R in V5 or V6 ≥35 mm; Cornell: R aVL + S V3 >28 mm in men)
- LVH strain pattern: ST depression + asymmetric T-wave inversion in lateral leads (I, aVL, V4–V6) — not ischaemia
- Left axis deviation
- Broad, notched P wave (P mitrale) in lead II, biphasic P in V1 → left atrial enlargement
- May show LBBB in advanced disease
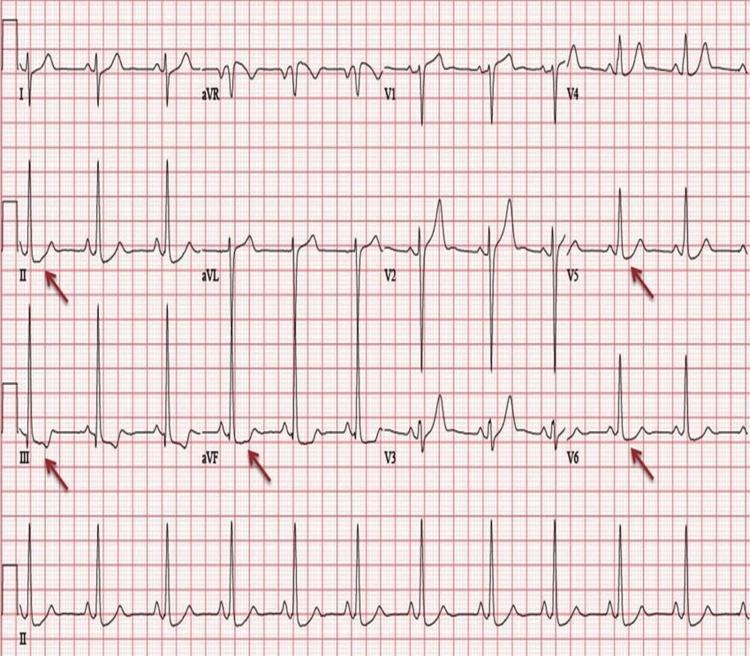
LVH with strain pattern: High voltage in precordial leads, ST depression and T-wave inversions in II, III, aVF, V5–V6 (red arrows).
5. Acute Pericarditis
What it is: Inflammation of the pericardial sac. ECG changes occur because the epicardium (not the electrically silent pericardium) is inflamed — causing diffuse myocardial injury current.
ECG changes (4 stages):
| Stage | Timing | ECG findings |
|---|---|---|
| 1 (Acute) | Hours–days | Diffuse saddle-shaped (concave) ST elevation in nearly all leads; PR depression (most visible in II, V4–V6); PR elevation in aVR |
| 2 | Days | ST returns to baseline, PR normalises |
| 3 | 1–3 weeks | Diffuse T-wave inversions |
| 4 | Weeks–months | ECG normalises (60% of cases don't complete all stages) |
Key differentiator from STEMI:
- ST elevation is diffuse (not in one coronary territory)
- ST morphology is concave ("saddle-shaped"), not convex
- PR depression is virtually pathognomonic
- No reciprocal ST depression (except in aVR and V1)
"PR-depression can occur without ST elevation and be the initial or sole ECG manifestation." — Braunwald's Heart Disease

Pericarditis: Diffuse concave ST elevation across multiple leads, PR depression in II (most visible), reciprocal PR elevation and ST depression in aVR. Spodick's sign (downsloping TP segment) also visible.
6. Pulmonary Embolism (PE)
What it is: Thrombus in pulmonary artery → acute right ventricular pressure overload → RV strain and dilation.
Why the ECG changes: Acute RV dilation shifts the cardiac axis rightward and anteriorly; RV ischaemia and conduction delay produce characteristic patterns.
ECG changes:
- Sinus tachycardia — most common finding (~50%)
- S1Q3T3 pattern — deep S wave in lead I + Q wave in III + T-wave inversion in III (present in ~20%, not sensitive but classic)
- Incomplete or complete RBBB — RV conduction delay
- Right axis deviation
- T-wave inversions V1–V4 — RV strain
- P pulmonale — tall peaked P in II (RA enlargement)
- Sinus tachycardia alone in many mild cases
Pulmonary embolism: Sinus tachycardia, classic S1Q3T3 pattern, RBBB (rsR' in V1), right axis deviation, and T-wave inversions V1–V3 indicating acute right ventricular strain.
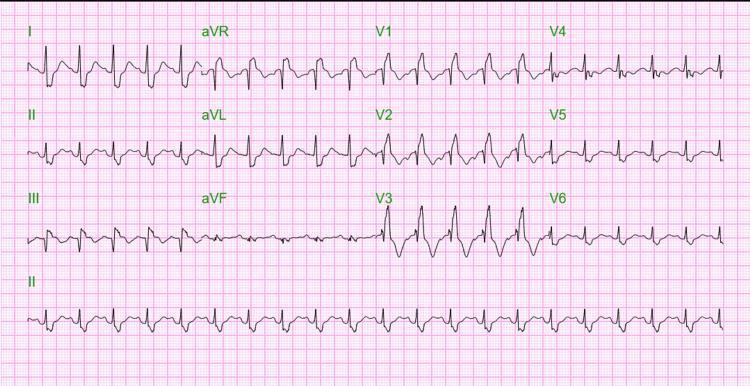
7. Hypertrophic Cardiomyopathy (HCM)
What it is: Genetic disorder (sarcomere protein mutations) → asymmetric septal hypertrophy → diastolic dysfunction, LVOT obstruction, arrhythmias. A leading cause of sudden cardiac death in young athletes.
ECG changes (abnormal in ~75–95% of patients):
- LVH voltage criteria (as above)
- Deep, narrow "dagger-like" Q waves in lateral (I, aVL, V5–V6) and/or inferior leads (II, III, aVF) — from septal hypertrophy, not infarction
- ST depression + T-wave inversions in lateral leads (strain pattern)
- "Giant" symmetric T-wave inversions in precordial leads V1–V5 (especially apical HCM / Yamaguchi syndrome — deep inversions ≥10 mm)
- Left axis deviation
- Atrial fibrillation (complication)
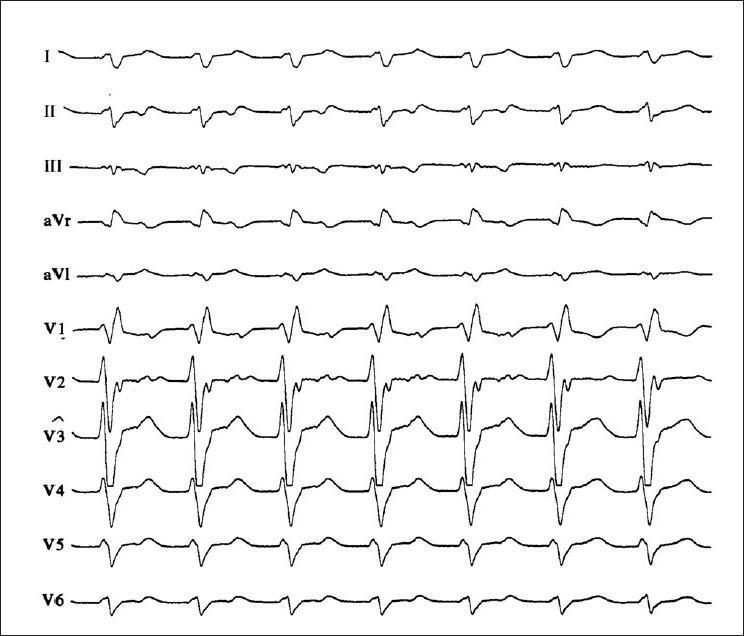
Apical hypertrophic cardiomyopathy (Yamaguchi syndrome): High QRS voltage meeting LVH criteria, with deep symmetric "giant" T-wave inversions most prominent in V3–V5.
8. Ventricular Tachycardia (VT)
What it is: A life-threatening arrhythmia originating in the ventricular myocardium or Purkinje system. Usually occurs on a substrate of structural heart disease (post-MI scar, cardiomyopathy).
ECG changes:
- Wide QRS complex tachycardia (QRS ≥120 ms, typically 140–200 ms)
- Rate: 100–250 bpm, regular
- AV dissociation — P waves march independently through QRS complexes (most specific finding)
- Capture beats — occasional narrow QRS when sinus impulse captures ventricle
- Fusion beats — hybrid beat from simultaneous ventricular + sinus depolarization
- Concordance — all QRS complexes in V1–V6 pointing same direction (positive or negative) = VT
- QRS >160 ms argues strongly for VT over SVT with aberrancy
VT vs SVT with aberrancy — key rule: "Extreme QRS durations >160 milliseconds argue in favor of ventricular tachycardia." — Tintinalli's Emergency Medicine
Monomorphic VT: Wide QRS tachycardia with RBBB pattern, northwest axis (extreme right axis deviation), AV dissociation visible — hallmark of ventricular origin.
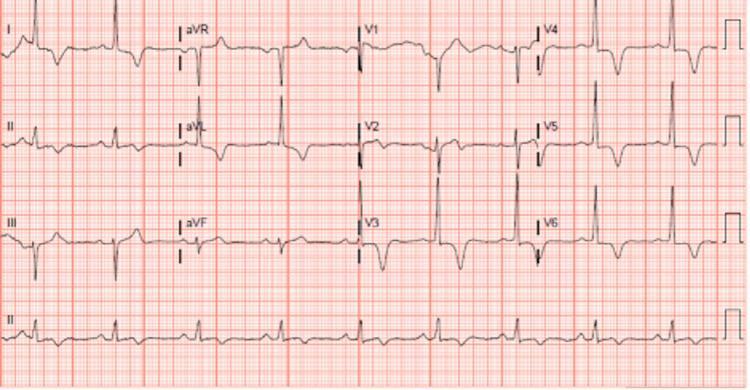
9. Complete Heart Block (3rd-Degree AV Block)
What it is: Complete failure of conduction between atria and ventricles. Atria and ventricles beat independently — atria at the sinus rate (60–100 bpm), ventricles at an escape rate (25–50 bpm depending on level of block). Causes: ischaemia (especially inferior MI), fibrosis, drugs (digoxin, beta-blockers), post-cardiac surgery.
ECG changes:
- Regular P waves at normal sinus rate (~60–100 bpm)
- Regular but SLOW QRS at escape rate (30–60 bpm)
- Complete AV dissociation — no fixed PR interval; P waves appear before, within, and after QRS complexes
- QRS morphology:
- Narrow (junctional escape) if block is at/above His bundle (e.g., inferior MI)
- Wide (ventricular escape) if block is below the His bundle (worse prognosis)
- Heart rate: bradycardia is the clinical emergency
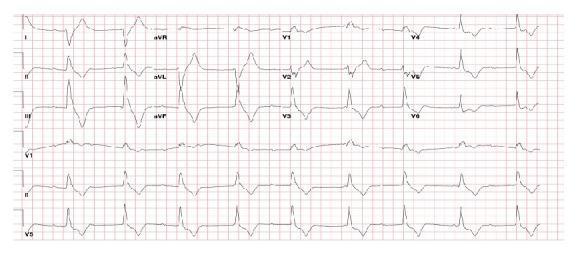
Third-degree AV block: Regular P waves (faster rate) completely dissociated from wide QRS escape complexes (slow rate). No fixed PR interval — P waves seen before, during, and after QRS.
10. Dilated Cardiomyopathy (DCM)
What it is: Ventricular dilation + systolic dysfunction (reduced EF) from various causes (idiopathic, viral, alcohol, genetic). The dilated, fibrotic ventricle produces characteristic but non-specific ECG changes.
ECG changes:
- Left bundle branch block (LBBB) — most common; broad notched R in I, aVL, V5–V6; QS pattern in V1–V3; QRS ≥120 ms; secondary discordant ST-T changes
- Non-specific intraventricular conduction delay (IVCD)
- Poor R-wave progression in V1–V4 (mimics anterior MI)
- Low voltage in all leads if extensive fibrosis or pericardial effusion
- Left axis deviation
- Atrial fibrillation (common complication)
- Frequent PVCs or ventricular tachyarrhythmias
- Prolonged QT interval (substrate for arrhythmia)
LBBB in the context of heart failure is particularly important because it creates dyssynchrony — and is an indication for cardiac resynchronization therapy (CRT/biventricular pacing).
Quick Reference Summary Table
| # | Condition | Key ECG Findings | Classic Pattern |
|---|---|---|---|
| 1 | STEMI | ST elevation + reciprocal depression + Q waves | Convex ST↑ in territory |
| 2 | NSTEMI/UA | ST depression, T inversions, or normal | Wellens' T waves (V1–V4) |
| 3 | Atrial fibrillation | No P waves, irregularly irregular QRS | Fibrillatory baseline |
| 4 | LVH / Hypertensive HD | High voltage, lateral strain pattern | Sokolow-Lyon criteria |
| 5 | Acute pericarditis | Diffuse saddle ST↑, PR depression | Concave ST in all leads |
| 6 | Pulmonary embolism | S1Q3T3, sinus tachycardia, RBBB | Right heart strain pattern |
| 7 | HCM | LVH + deep narrow Q waves, giant T inversions | Asymmetric LVH pattern |
| 8 | Ventricular tachycardia | Wide QRS, AV dissociation, fusion/capture beats | Concordant wide complex |
| 9 | Complete heart block | P waves dissociated from slow escape QRS | No fixed PR interval |
| 10 | Dilated cardiomyopathy | LBBB, poor R progression, low voltage | Non-specific + LBBB |
Sources: Ganong's Review of Medical Physiology; Harrison's Principles of Internal Medicine 22e; Braunwald's Heart Disease; Tintinalli's Emergency Medicine; Guyton and Hall Textbook of Medical Physiology; Goldman-Cecil Medicine; Fuster and Hurst's The Heart 15e.
This is a shared conversation. Sign in to Orris to start your own chat.