Poor R wave progression meaning in ECG

Reading File
Finding Sources
Searching PubMed

"poor R wave progression"

Searching the Web

poor R wave progression ECG causes clinical significance

Searching Images

ECG precordial leads poor R wave progression example
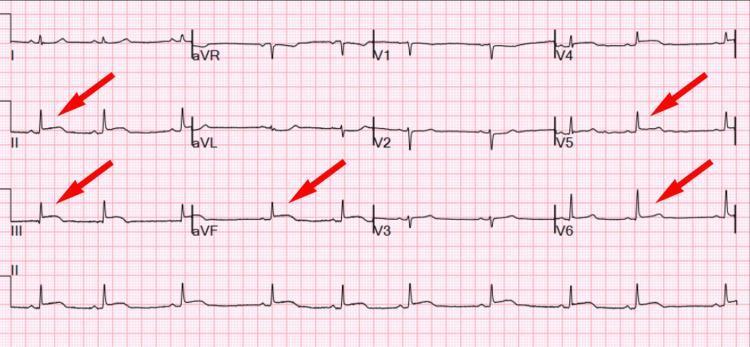
A 12-lead electrocardiogram (ECG) demonstrating abnormalities in a patient with cardiovascular collapse. The tracing shows a sinus rhythm with key pathological features highlighted by red arrows. Notable findings include significant ST-segment elevation in the inferior leads (II, III, and aVF) and lateral leads (V5, V6), indicating an inferolateral ST-elevation myocardial infarction (STEMI) pattern or acute pericardial involvement. Additionally, there is evidence of poor R-wave progression across the precordial leads (V1 through V6), where the expected increase in R-wave amplitude is absent. These visual findings correlate clinically with cardiac tamponade or myocardial injury. The image serves as an educational example of identifying acute ischemic or inflammatory patterns on ECG and recognizing poor R-wave progression as a sign of underlying pathology or loss of viable myocardium.
A 12-lead electrocardiogram (ECG) demonstrating abnormalities in a patient with cardiovascular collapse. The tracing shows a sinus rhythm with key pathological features highlighted by red arrows. Notable findings include significant ST-segment elevation in the inferior leads (II, III, and aVF) and lateral leads (V5, V6), indicating an inferolateral ST-elevation myocardial infarction (STEMI) pattern or acute pericardial involvement. Additionally, there is evidence of poor R-wave progression across the precordial leads (V1 through V6), where the expected increase in R-wave amplitude is absent. These visual findings correlate clinically with cardiac tamponade or myocardial injury. The image serves as an educational example of identifying acute ischemic or inflammatory patterns on ECG and recognizing poor R-wave progression as a sign of underlying pathology or loss of viable myocardium.

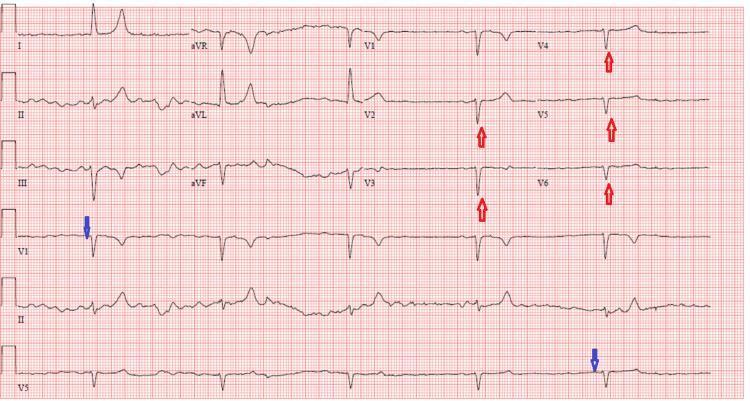
A 12-lead electrocardiogram (ECG) demonstrating a junctional rhythm characterized by a significant bradycardia (heart rate approximately 32 bpm) and the absence of discernible P-waves, as indicated by blue arrows in leads III and V5. The QRS complexes are relatively narrow, typical of a junctional origin. Notable precordial findings include poor R-wave progression (PRWP), highlighted by red arrows in leads V2 through V6, where the expected incremental increase in R-wave amplitude from the right to left precordial leads is absent. T-waves in several leads appear peaked or tall, which, in the clinical context of the patient's severe hyperkalemia (8.3 mEq/L) and acute kidney injury, suggests electrolyte-induced cardiac conduction abnormalities. This ECG provides a classic educational example of metabolic derangements affecting cardiac rhythm and conduction, specifically illustrating a junctional escape rhythm common in severe hyperkalemic states.
A 12-lead electrocardiogram (ECG) demonstrating a junctional rhythm characterized by a significant bradycardia (heart rate approximately 32 bpm) and the absence of discernible P-waves, as indicated by blue arrows in leads III and V5. The QRS complexes are relatively narrow, typical of a junctional origin. Notable precordial findings include poor R-wave progression (PRWP), highlighted by red arrows in leads V2 through V6, where the expected incremental increase in R-wave amplitude from the right to left precordial leads is absent. T-waves in several leads appear peaked or tall, which, in the clinical context of the patient's severe hyperkalemia (8.3 mEq/L) and acute kidney injury, suggests electrolyte-induced cardiac conduction abnormalities. This ECG provides a classic educational example of metabolic derangements affecting cardiac rhythm and conduction, specifically illustrating a junctional escape rhythm common in severe hyperkalemic states.

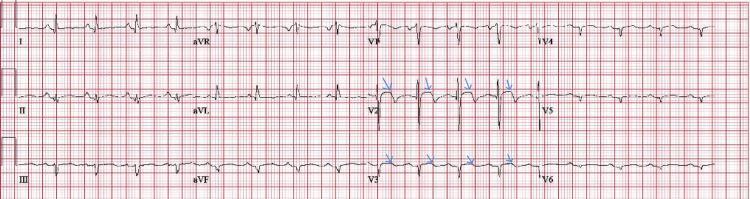
This diagnostic image is a 12-lead electrocardiogram (ECG) tracing recorded on standard grid paper. The tracing demonstrates a sinus rhythm with several clinically significant morphological abnormalities. Blue arrows highlight mild ST-segment elevations specifically in the precordial leads V2 and V3. Additionally, pathological Q-waves are evident in the lateral leads, suggesting potential myocardial injury or sequelae. T-wave morphology varies across the leads, with notably peaked T-waves in V2 and V3, while polarity remains positive in leads I, II, aVF, and V4-V6. The R-wave amplitude appears relatively preserved, though there is poor R-wave progression across the precordial leads. This ECG pattern is visually indicative of myocarditis, particularly in clinical scenarios where obstructive coronary artery disease has been ruled out. It serves as an educational example of immunotherapy-induced cardiotoxicity, such as that seen with immune checkpoint inhibitors like pembrolizumab, illustrating how non-ST-elevation myocardial infarction (NSTEMI) or inflammatory myocarditis can present with subtle ST-segment and T-wave changes.

This diagnostic image is a 12-lead electrocardiogram (ECG) tracing recorded on standard grid paper. The tracing demonstrates a sinus rhythm with several clinically significant morphological abnormalities. Blue arrows highlight mild ST-segment elevations specifically in the precordial leads V2 and V3. Additionally, pathological Q-waves are evident in the lateral leads, suggesting potential myocardial injury or sequelae. T-wave morphology varies across the leads, with notably peaked T-waves in V2 and V3, while polarity remains positive in leads I, II, aVF, and V4-V6. The R-wave amplitude appears relatively preserved, though there is poor R-wave progression across the precordial leads. This ECG pattern is visually indicative of myocarditis, particularly in clinical scenarios where obstructive coronary artery disease has been ruled out. It serves as an educational example of immunotherapy-induced cardiotoxicity, such as that seen with immune checkpoint inhibitors like pembrolizumab, illustrating how non-ST-elevation myocardial infarction (NSTEMI) or inflammatory myocarditis can present with subtle ST-segment and T-wave changes.

Poor R-wave progression (PRWP) means the R waves in the chest leads do not increase in size as expected from V1 through V4/V5.
Normally, the R wave becomes progressively taller moving from the right to left chest leads. PRWP is commonly described when the R wave in V3 is 3 mm or less.
It is an ECG pattern, not a diagnosis. Possible causes include:
  • Incorrect chest-lead placement, a very common reason
  • Normal variant
  • Previous anterior or anteroseptal myocardial infarction
  • Left ventricular hypertrophy or right ventricular hypertrophy
  • COPD/emphysema with lung hyperinflation
  • Cardiomyopathies, including hypertrophic or infiltrative disease such as amyloidosis
  • Less commonly, conduction abnormalities or dextrocardia
By itself, it does not prove a heart attack. A review found that PRWP is suggestive but not diagnostic of anterior MI, and can arise from several non-infarct causes such as ventricular hypertrophy or normal reduced anterior electrical forces (review summary). The ECG interpretation should be correlated with symptoms, prior ECGs, lead placement, examination, and sometimes echocardiography or further cardiac testing.
Seek urgent medical care if it occurs with chest pressure/pain, shortness of breath, sweating, nausea, fainting, or new marked weakness.
This is a shared conversation. Sign in to Orris to start your own chat.